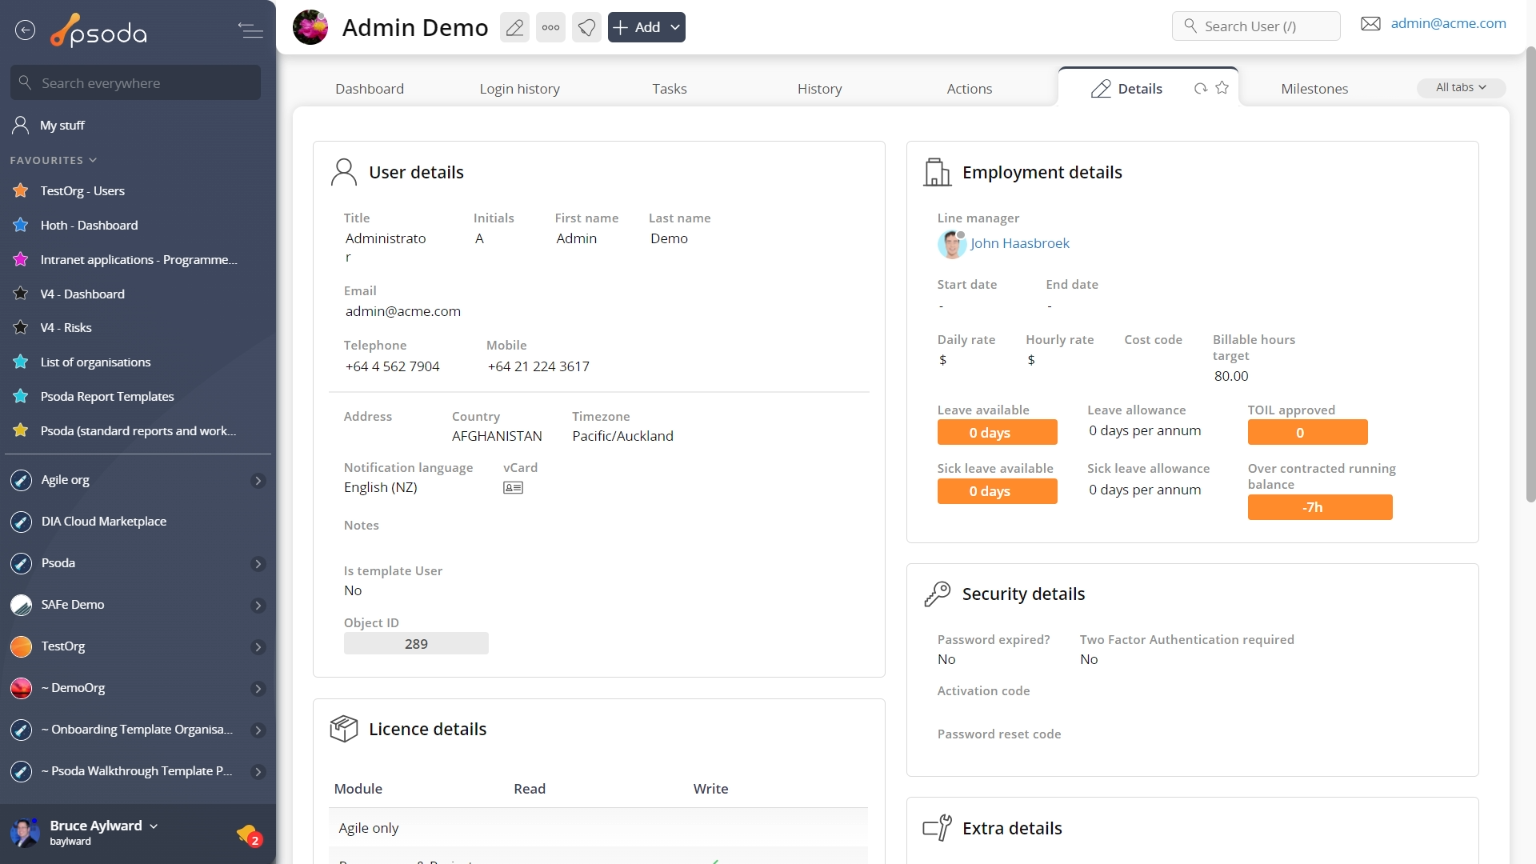
Figure 1 – User view page
The top header area allows you to Access Control Lists
This tab shows an asset listing of all of the groups that this user is a member of as well as all the Access Control Lists applicable to those groups, as shown in Figure 2. By default, this table will present you with a number of details about the ACLs such as the group of users that have access to this ACL and the a link to the list itself. If you click the link in the group column, you will navigate into the selected group’s view page. Equally, if you click the link in the ACL column, you will navigate into the selected ACL’s view page
From the Actions column of this ACLs table, you can act on individual ACLs by 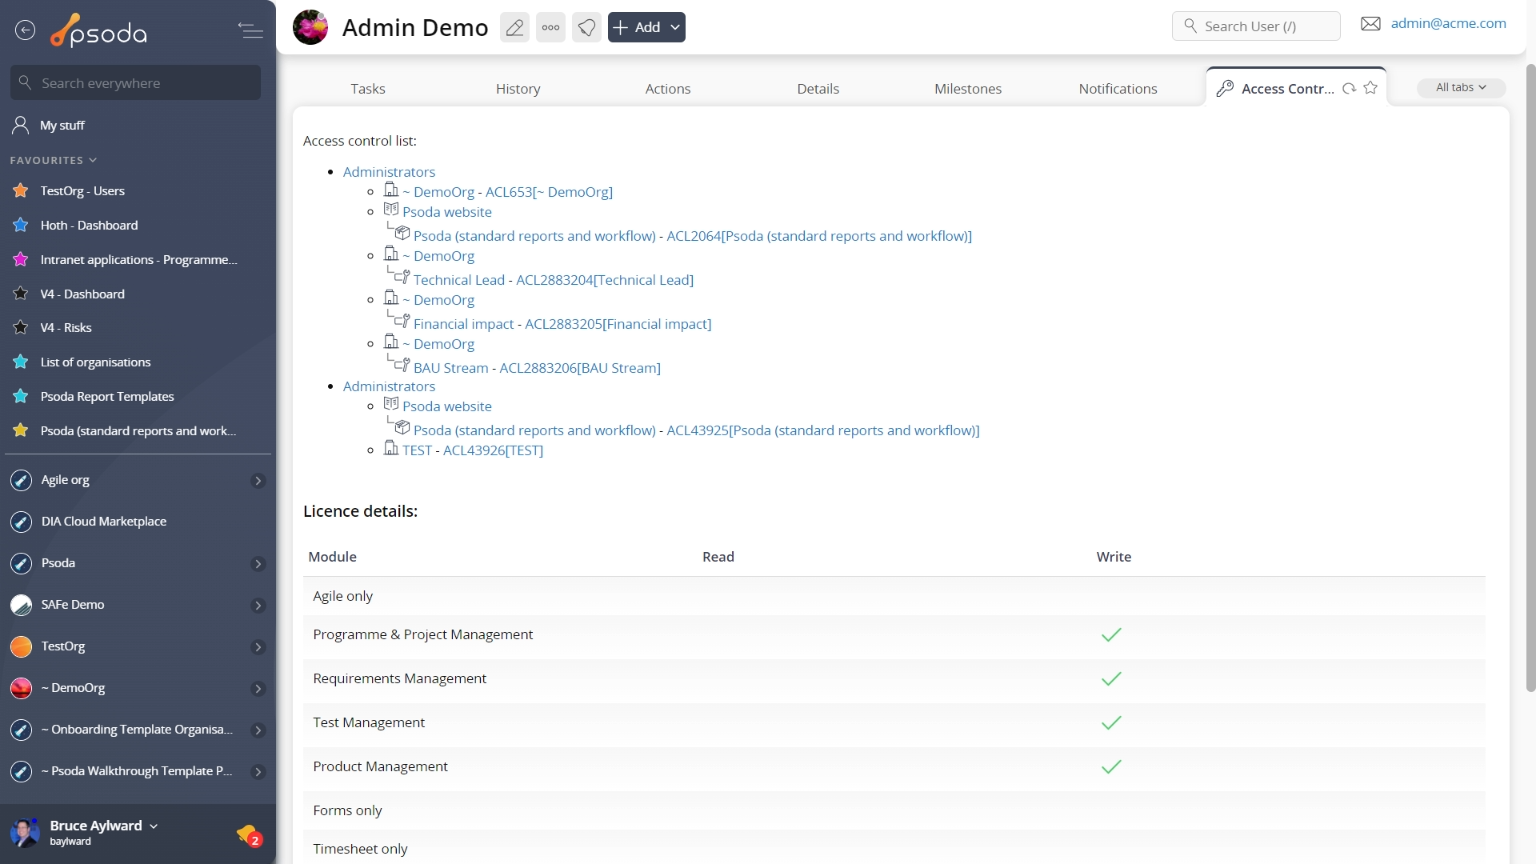
Figure 2 – User ACL tab
Note that you can customise your table view by clicking the Actions
This tab shows an asset listing of all of the actions that have been allocated to or created by this user, as shown in Figure 3. By default, this table will present you with a number of details about the actions such as it’s context, reference, description, priority and due date to name a few. If you click on the reference link of the listed action, you will navigate to that action’s view page.
From the Actions column of this actions table, you can act on individual actions by 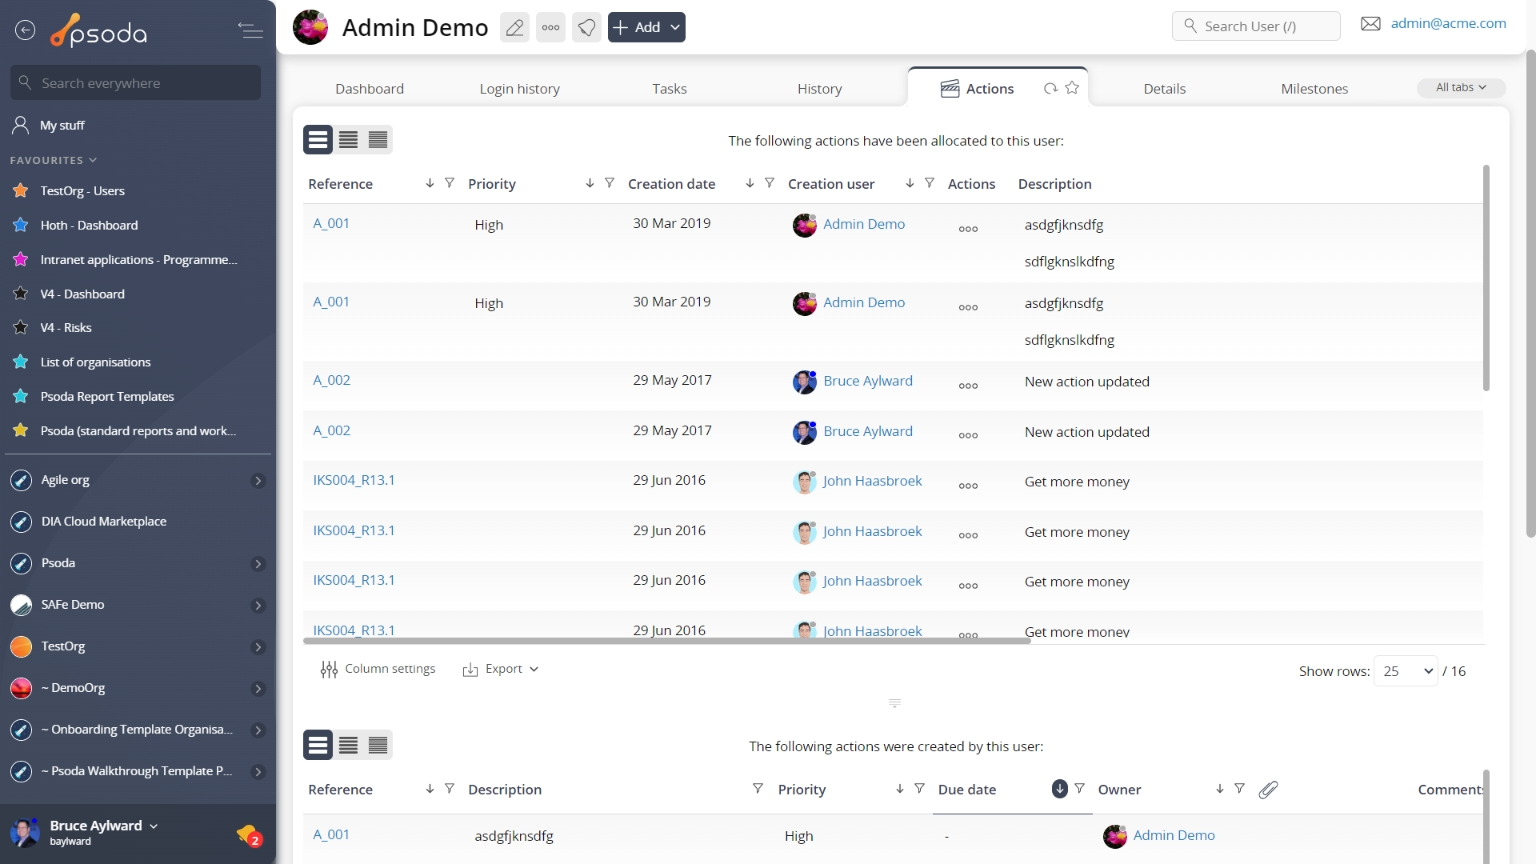
Figure 3 – User actions tab
Note that you can customise your table view by clicking the Advanced estimates
This tab shows an asset listing of all of the tasks that have been allocated to this user that are scheduled according to advanced estimates, as shown in Figure 4. By default, this table will present you with a number of details about the advanced estimates such as it’s context, reference, start and end dates, the users listed as resources for that estimate, resource total and a breakdown of actual and variance comparisons for time breakdowns.
From the Actions column of this advanced estimates table, you can act on individual estimate by 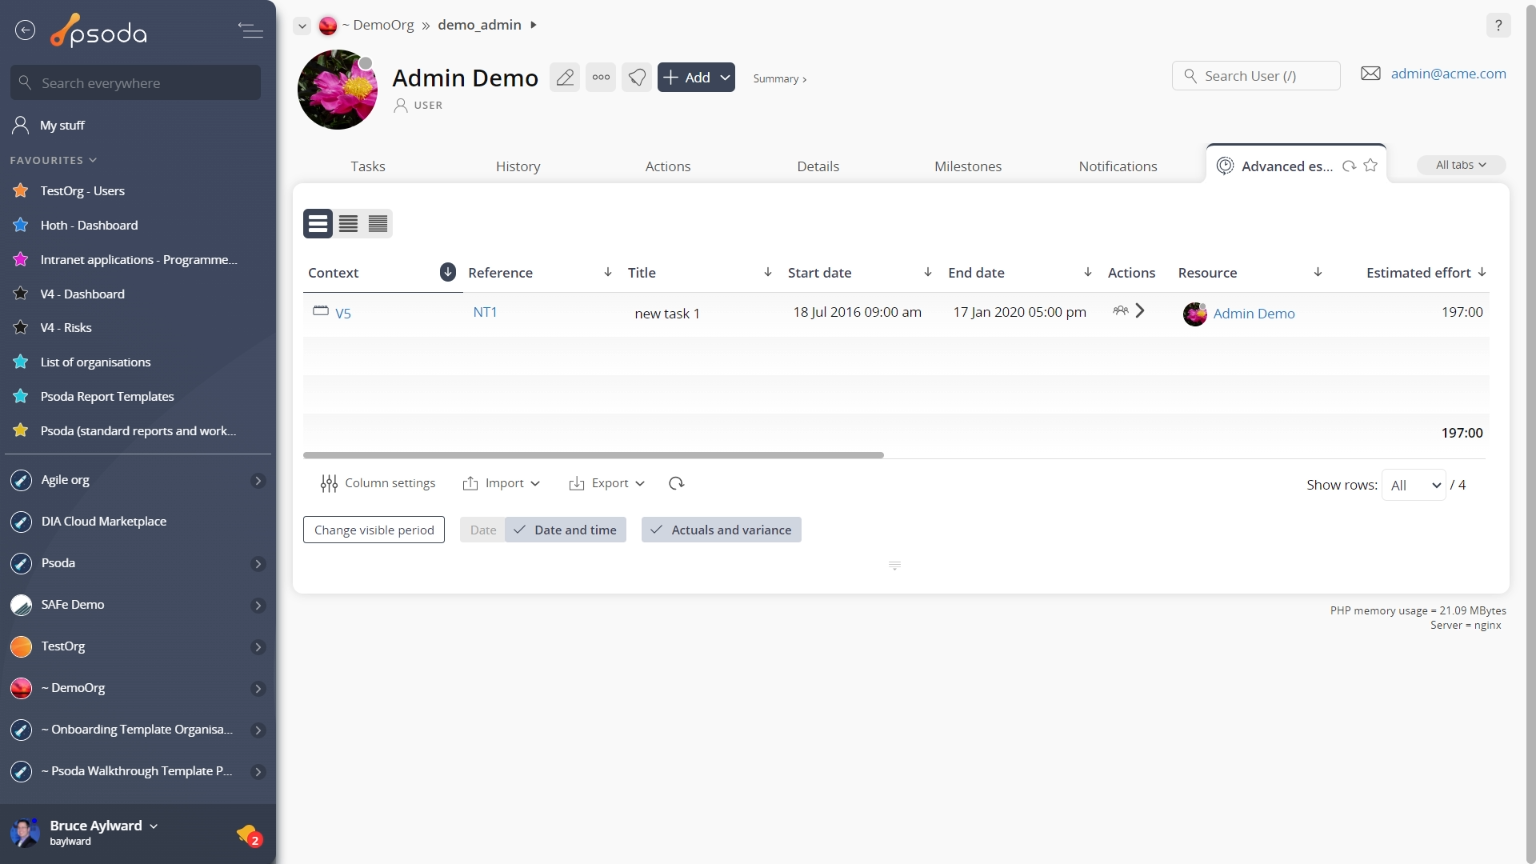
Figure 4 – User advanced estimates tab
Note that you can customise your table view by clicking the ![]() edit button at the bottom of the advanced estimates table. Here, you can also export this list to
edit button at the bottom of the advanced estimates table. Here, you can also export this list to ![]() Excel or
Excel or ![]() CSV files.
CSV files.
 Attachments
This tab shows an asset listing of all of the attachments that have been allocated to or added to this user, as shown in Figure 5. By default, this table will present you with a number of details about the attachments such as the file’s name, attachment type, view the version and access a download link.
From the Actions column of this attachments table, you can act on individual attachments by 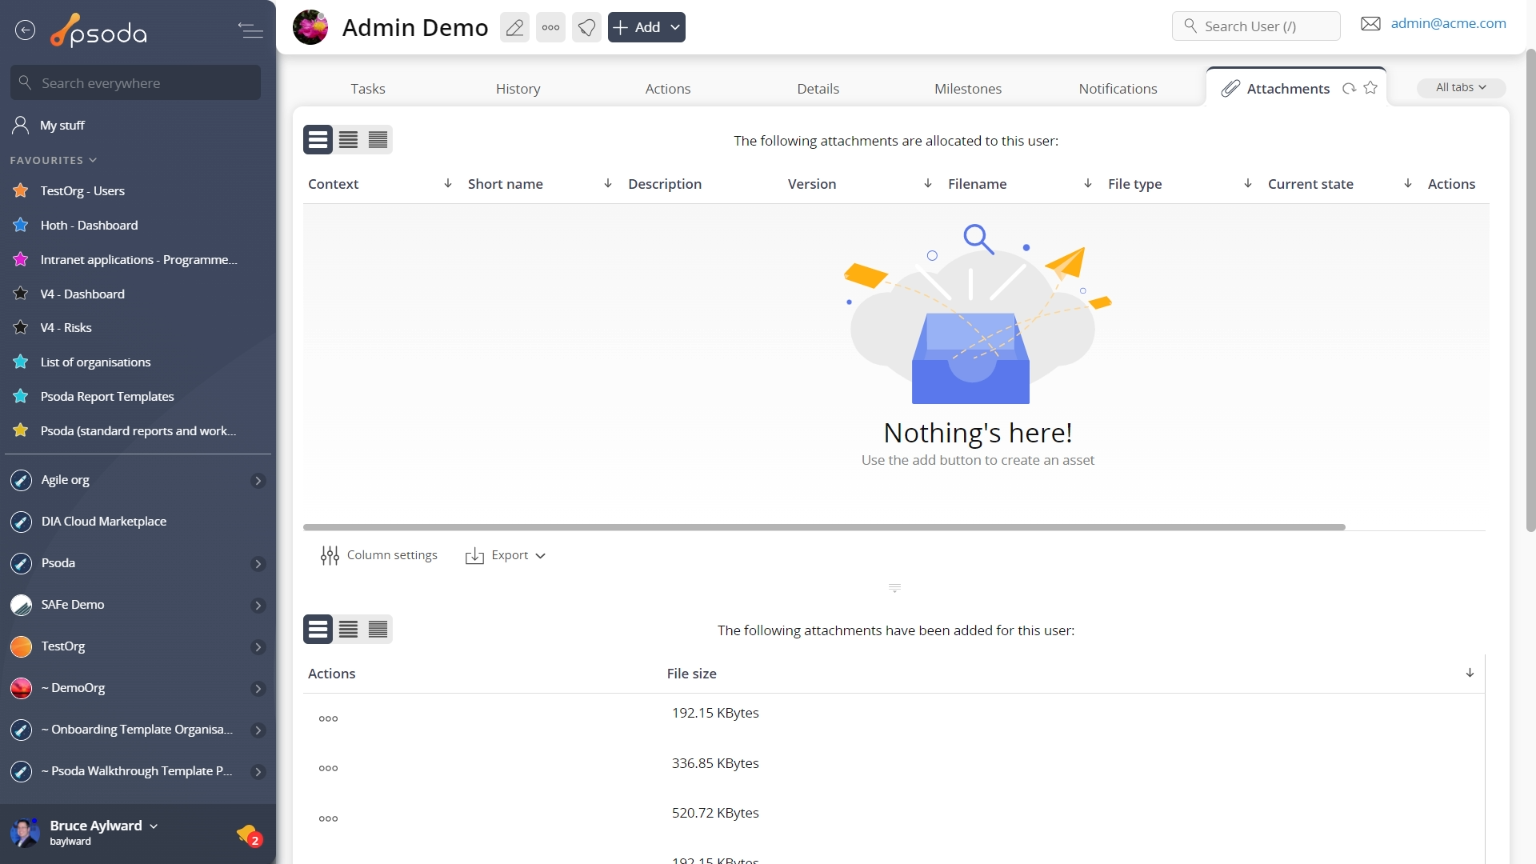
Figure 5 – User attachments tab
Note that you can customise your table view by clicking the Budget items
This tab shows an asset listing of all of the budget items that have been allocated to this user, as shown in Figure 6. By default, this table shows the baseline and actual cost details for this budget or group, together with all of the budget items and groups it contains.
From the Actions column of this budgets table, you can act on individual budget groups by 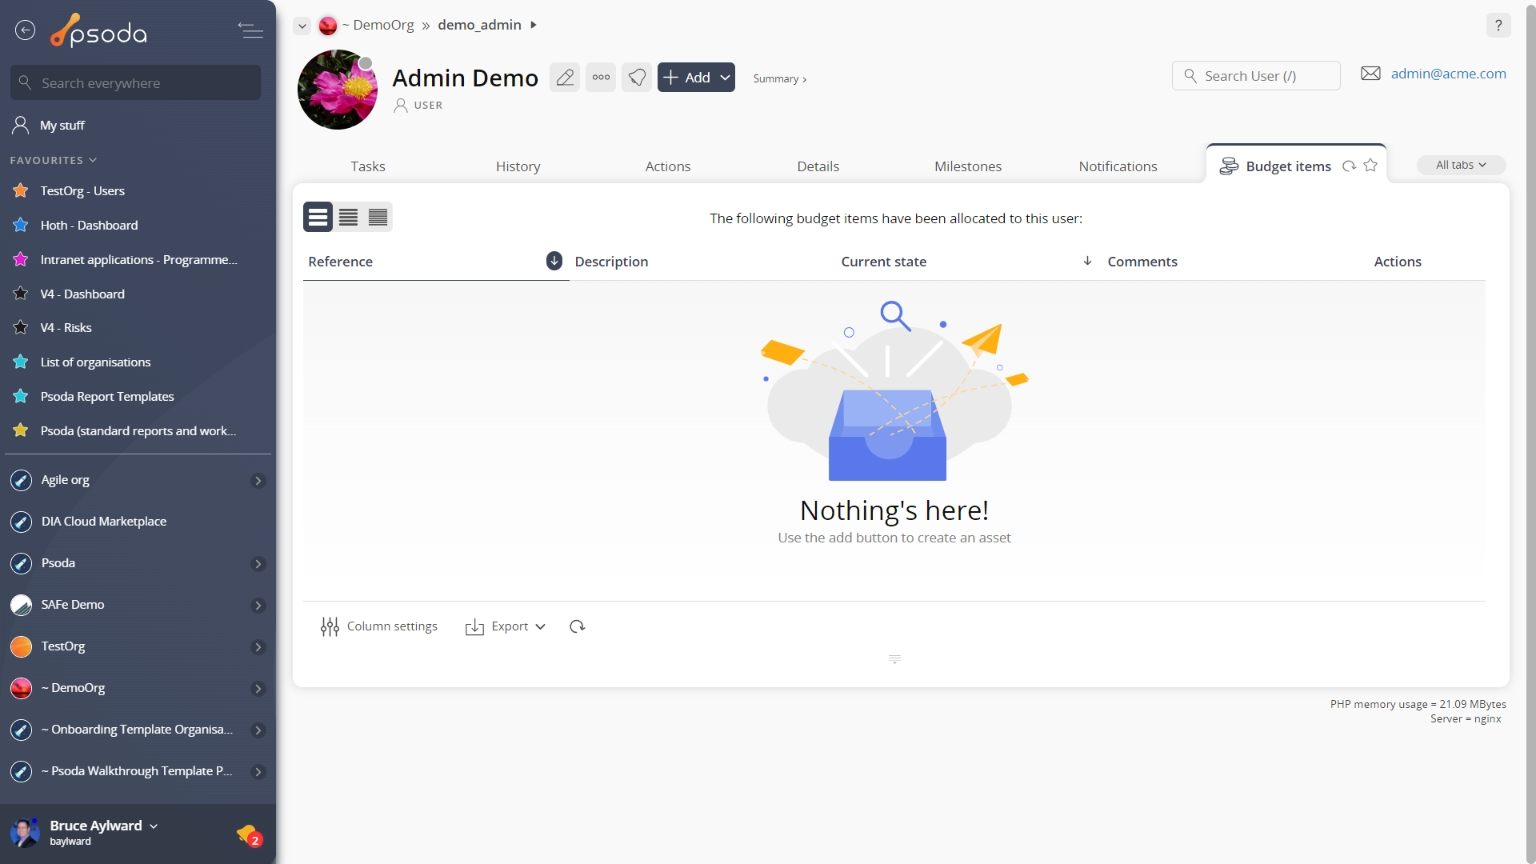
Figure 6 – User budget items tab
Note that you can customise your table view by clicking the ![]() edit button at the bottom of the budget table. Here, you can also export this budget list to
edit button at the bottom of the budget table. Here, you can also export this budget list to ![]() Excel or
Excel or ![]() CSV files.
CSV files.
 Calendar
This tab shows a calendar view, as shown in Figure 7, of the 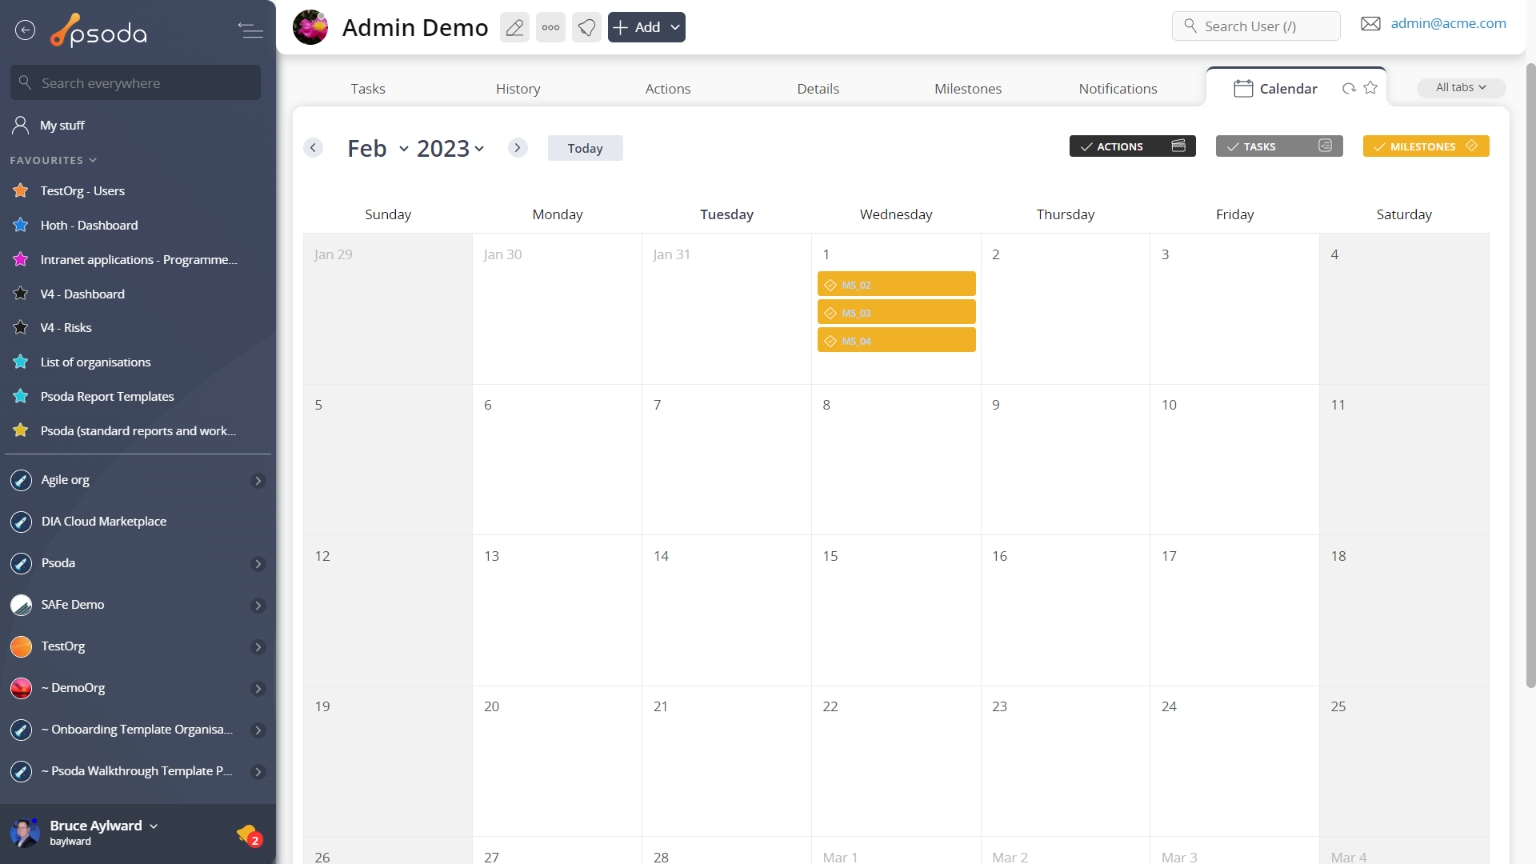
Figure 7 – User calendar tab
You can adjust whether you which calendar week you want to view by selecting it in the calendar month on the left-hand side of the tab. You can also customise the layers that are views by selecting or de-selecting the listed layers options in this same location.
 Change requests
This tabbed view provides the change requests table, as shown in Figure 8, listing any change requests that have been allocated to or initiated by this user.
By default you will be presented with the link to view the change request itself, title, category, description, scheduling information, the user who initiated this request, the owner of the request, it’s current state and any actions or workflow transitions that are available.
From this change request listing, you can utilise any of the functions in the Actions column to act on a specific request. These functions may include 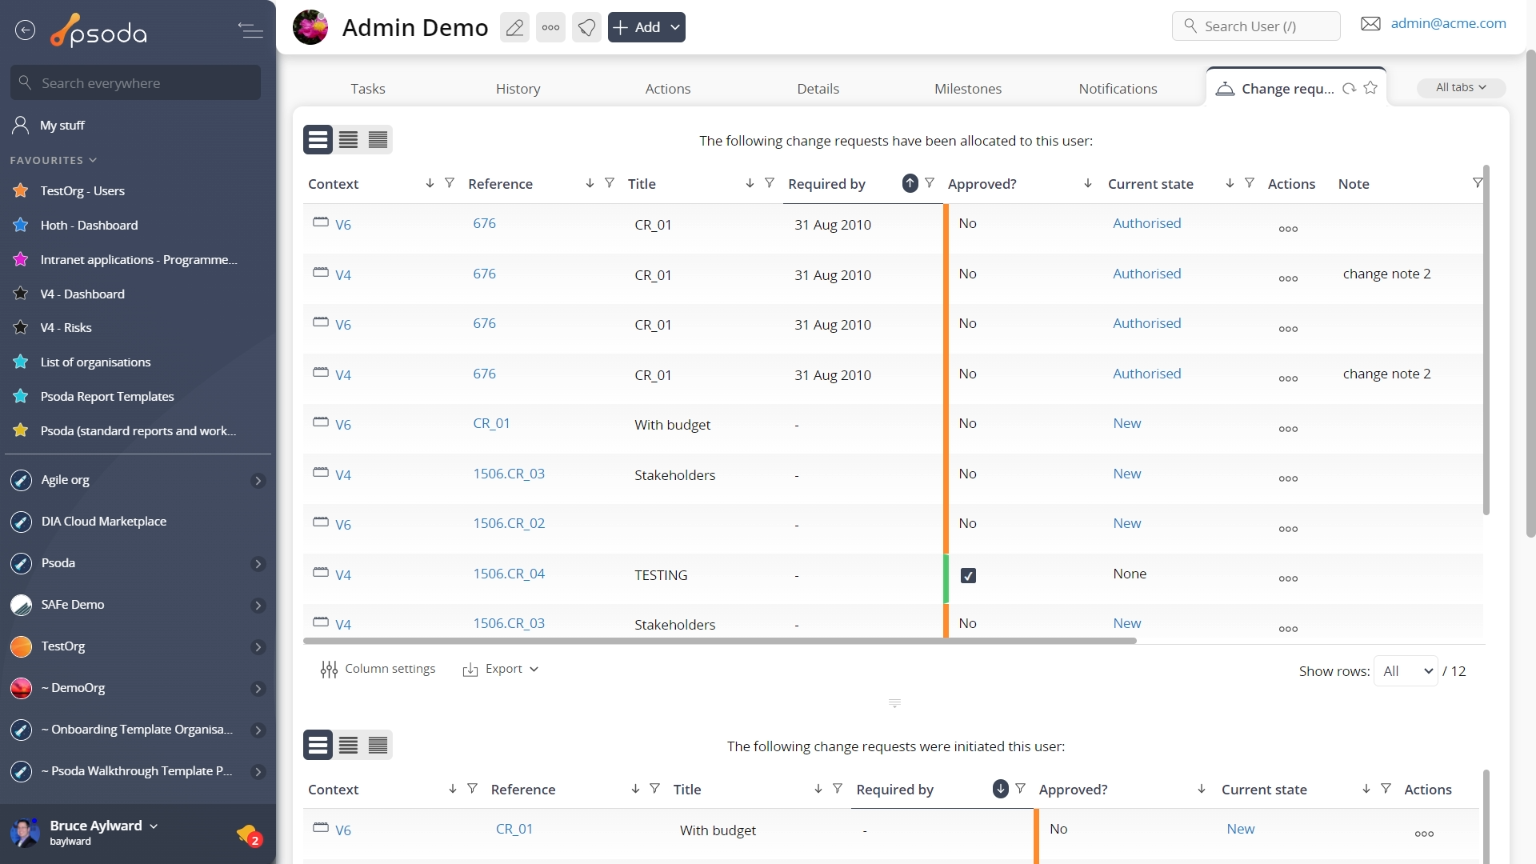 Figure 8 – User change requests table
Note that at the bottom of the table you can ![]() add more change requests,
add more change requests, ![]() edit the table columns to show or hide request information, or export this list to
edit the table columns to show or hide request information, or export this list to ![]() Excel or
Excel or ![]() CSV files.
CSV files.
 Comments
This tab shows an asset listing of all of the comments that 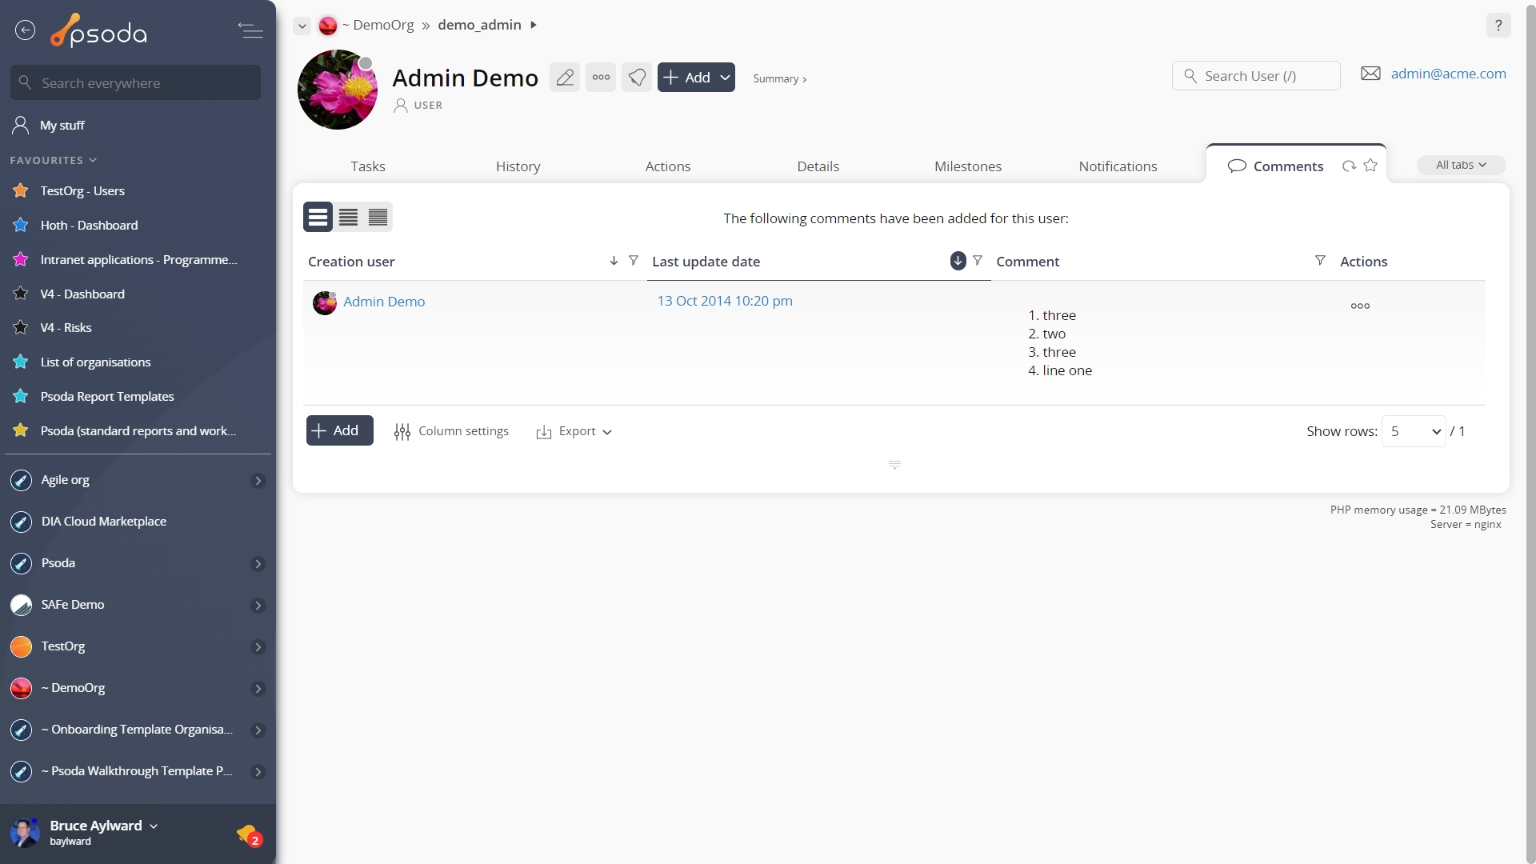
Figure 9 – User comments tab
Note that you can customise your table view by clicking the Dashboard
This tabbed view will display a collection of customisable dashlets, related to this user. In Figure 10 below, our “example user” has the Timesheets dashlet to show asset listings of the assets at this user level.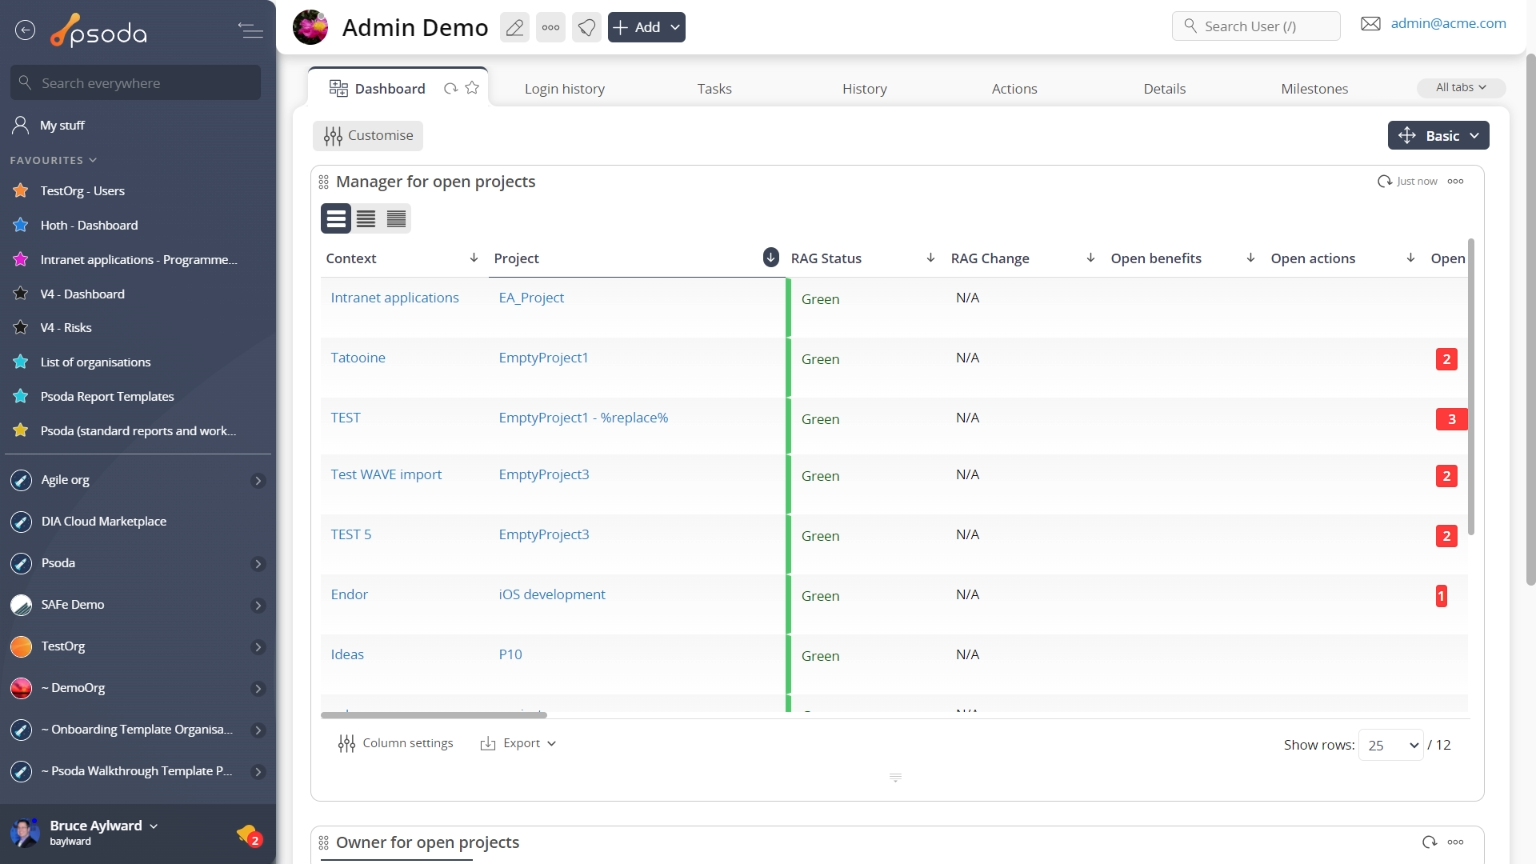
Figure 10 – User dashboard tab
You can rearrange the order of you dashboard dashlets by utilising the drag-n-drop function, selecting the title of the dashlet to be moved and dragging it to it’s new position.
You may show or hide any dashlets that you need at a given point in time by selecting the ![]() Customise dashboard link at the very bottom of this tabbed view.
Customise dashboard link at the very bottom of this tabbed view.
Defects
This tab shows an asset listing of all of the defects that have been allocated to or initiated by this user, as shown in Figure 11. By default, this table will present you with a number of details about the defects such as the defect’s number, type, title, severity, priority, current state, date raised, resolve by date and which user this defect is allocated to, to name a few details.
From the Actions column of this defects table, you can act on individual defects by 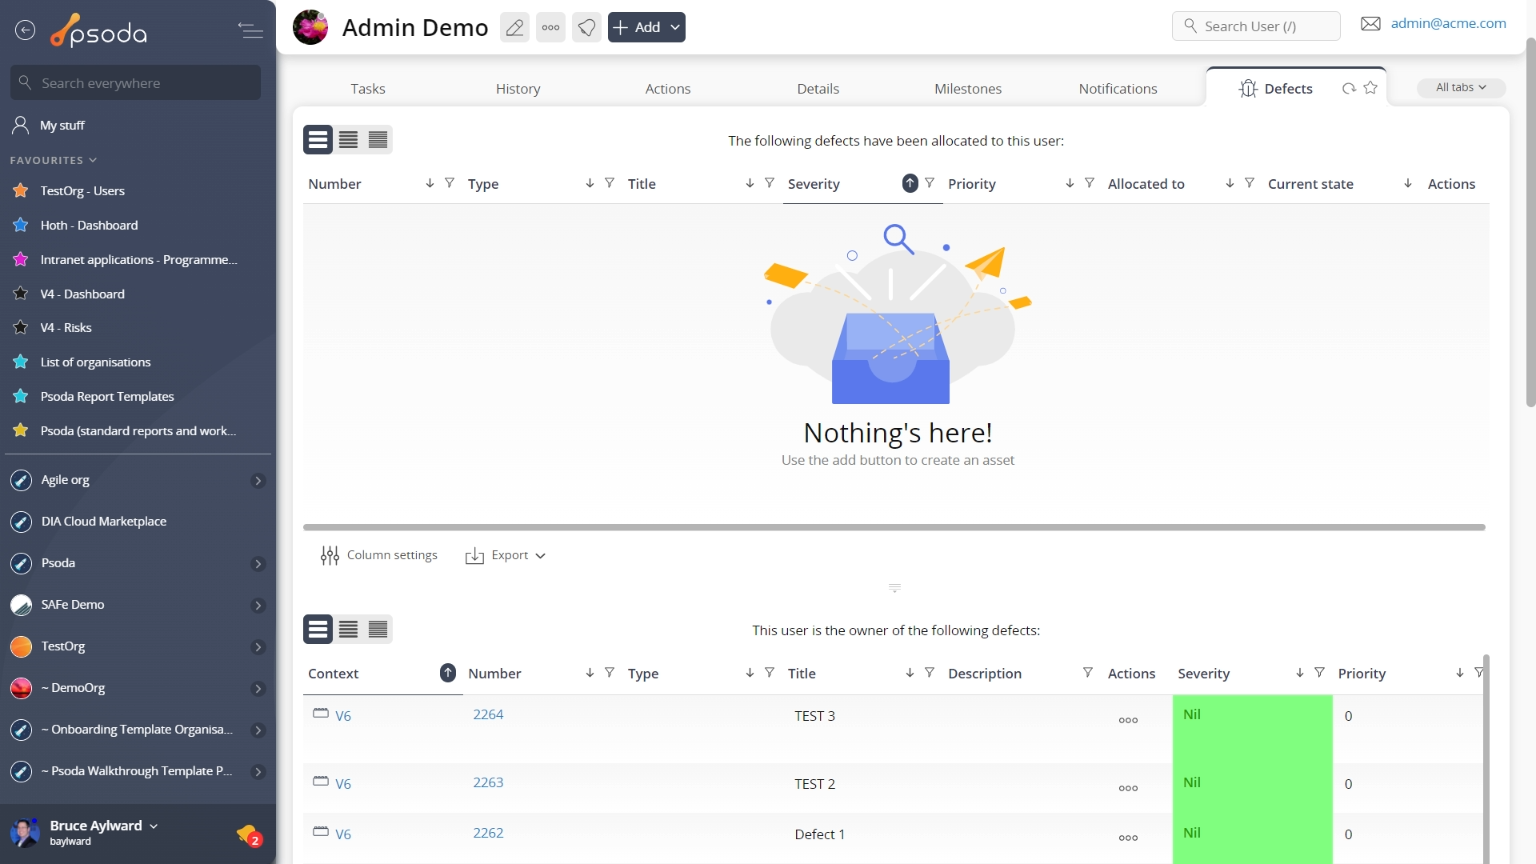
Figure 11 – User defects tab
Note that you can customise your table view by clicking the ![]() edit button at the bottom of the defect table. Here, you can also export this list to
edit button at the bottom of the defect table. Here, you can also export this list to ![]() Excel or
Excel or ![]() CSV files.
CSV files.
 Deleted assets
This tab shows an asset listing of all of the assets that have been moved or deleted from this user, as shown in Figure 12. By default, this table will present you with a number of details about the assets such as, the time it was deleted or moved, it’s parent asset (if applicable), what type of asset it was, it’s name and which user acted on it.
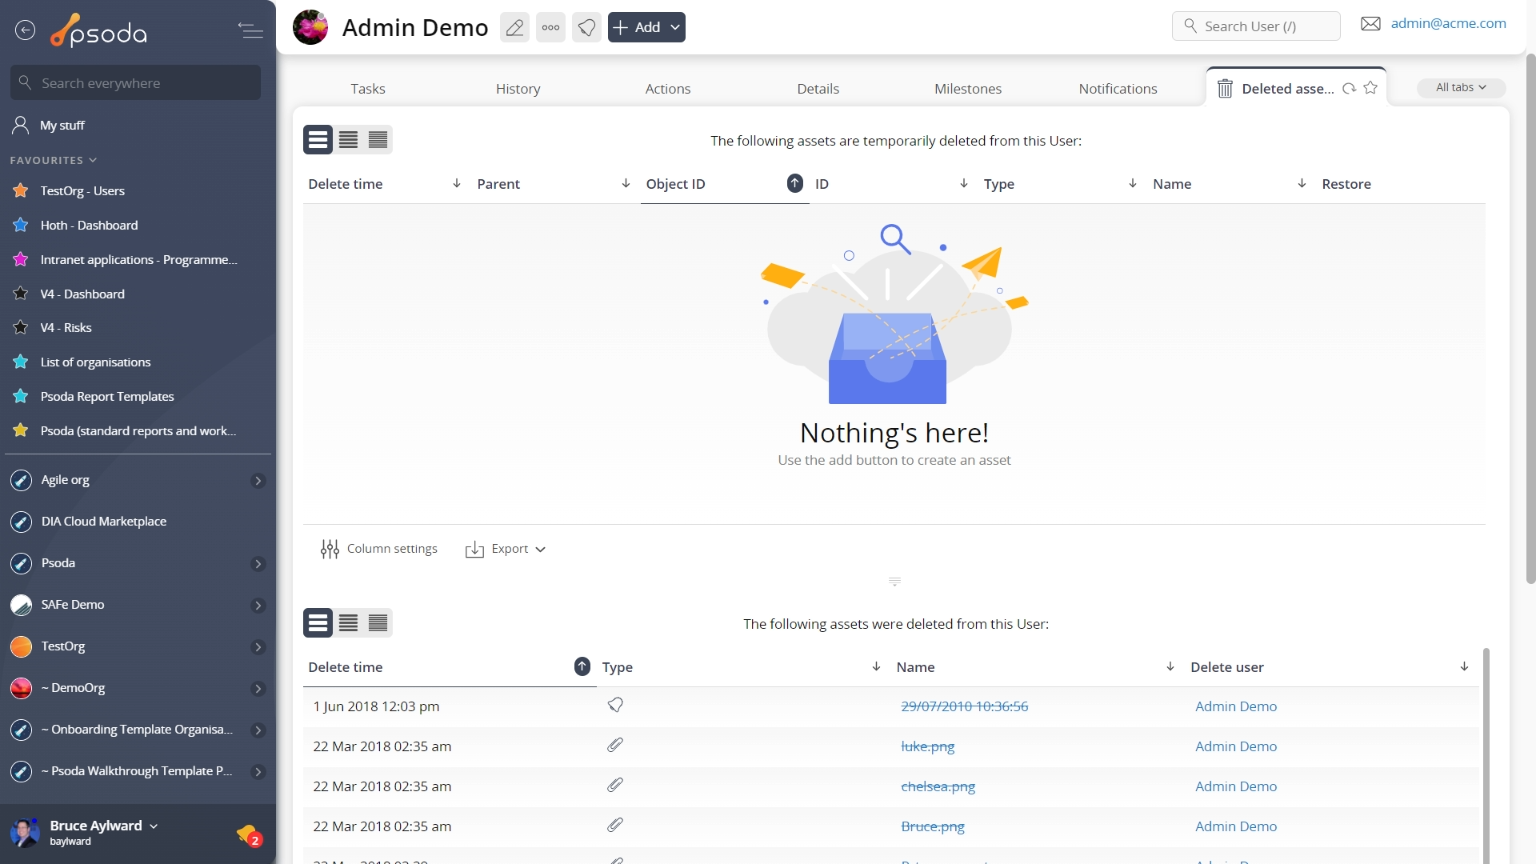
Figure 12 – User deleted assets tab
Note that you can customise your table view by clicking the ![]() edit button at the bottom of the tables. Here, you can also export the list to
edit button at the bottom of the tables. Here, you can also export the list to ![]() Excel or
Excel or ![]() CSV files.
CSV files.
 Details
This tab shows some additional details on the user, for example the user’s first name, last name, contact details, timezone and language preference, as shown in Figure 13. In addition, you will be presented with information as to which licenses this user has access to.
The vCard entry allows you to download a business card for this user directly into your contact database (if it supports the vCard format).
Figure 13 – User details tab
Some fields may allow for inline editing although these permissions may be linked to your access rights. If you feel that you should have access to some of these permissions, contact your System Administrator. Direct reports
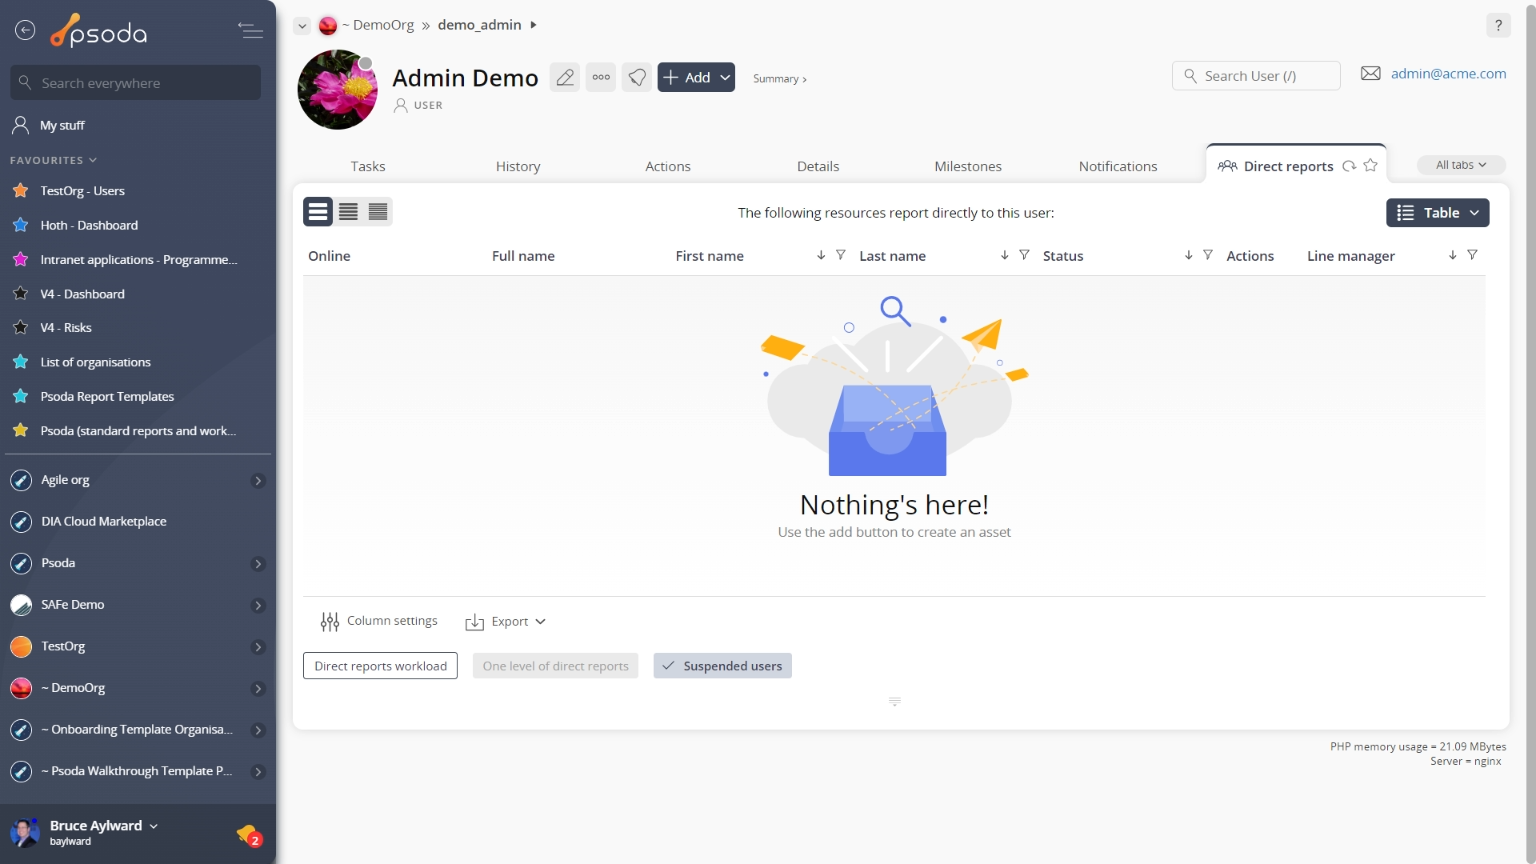
Figure 14 – User direct reports tab
 Direct reports workload
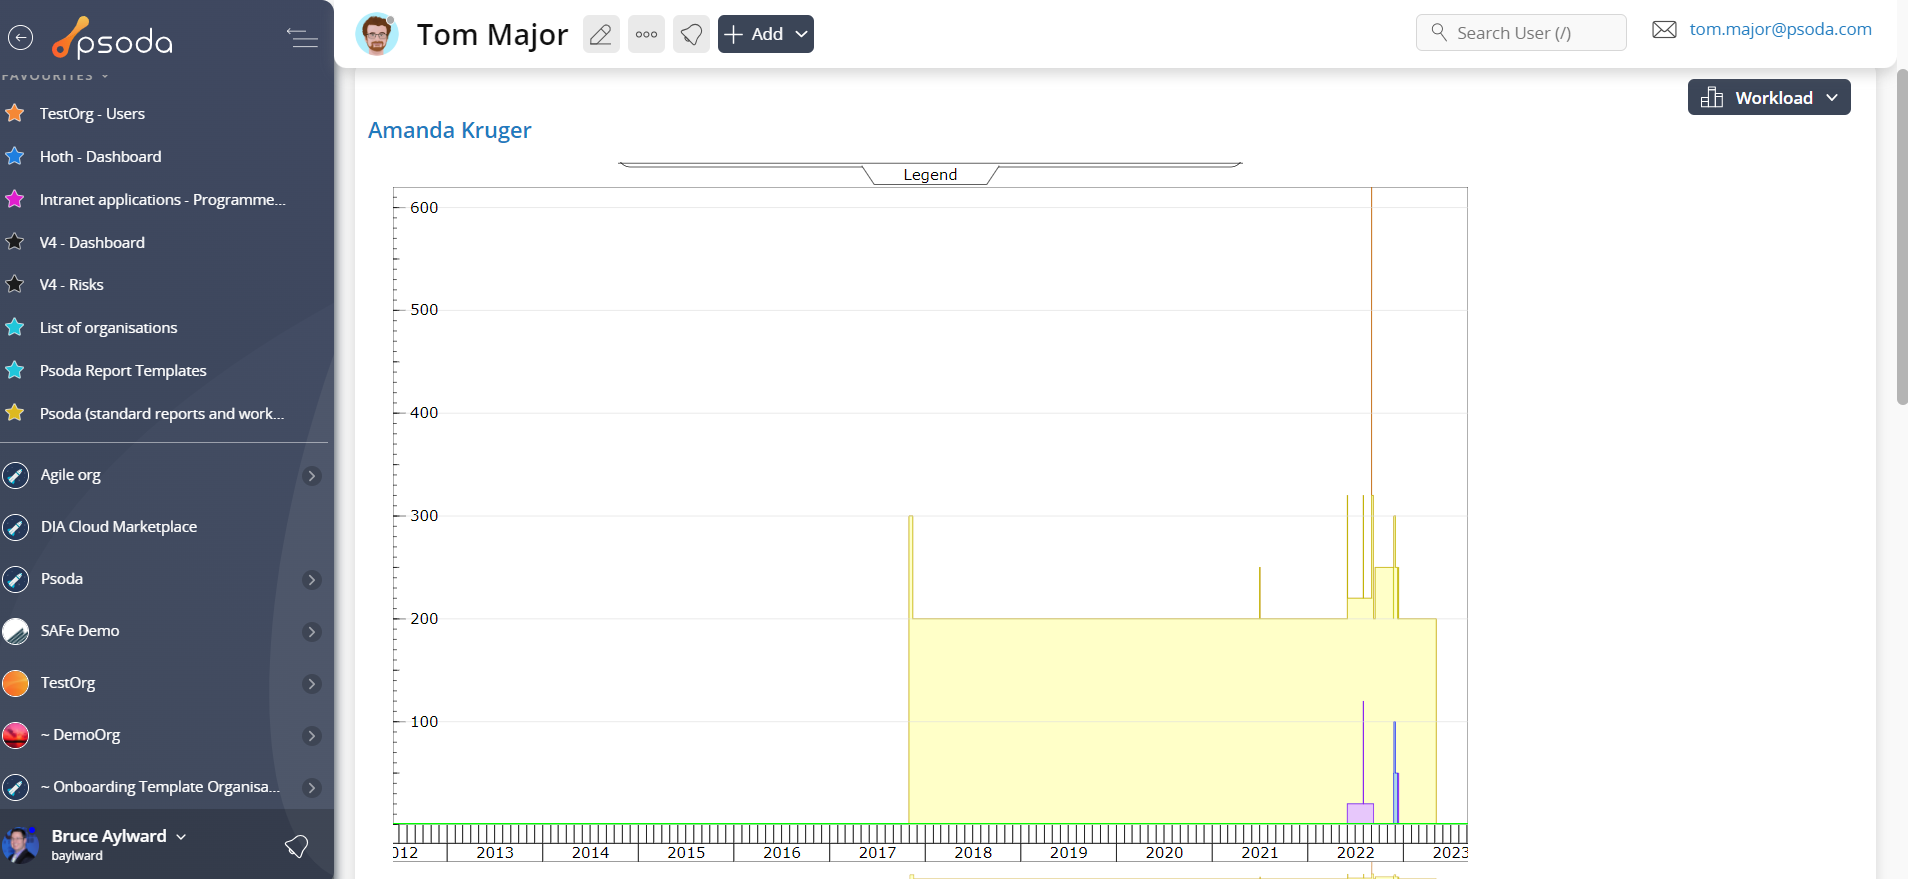
Figure 15 – User direct reports workload tab
 Favourites
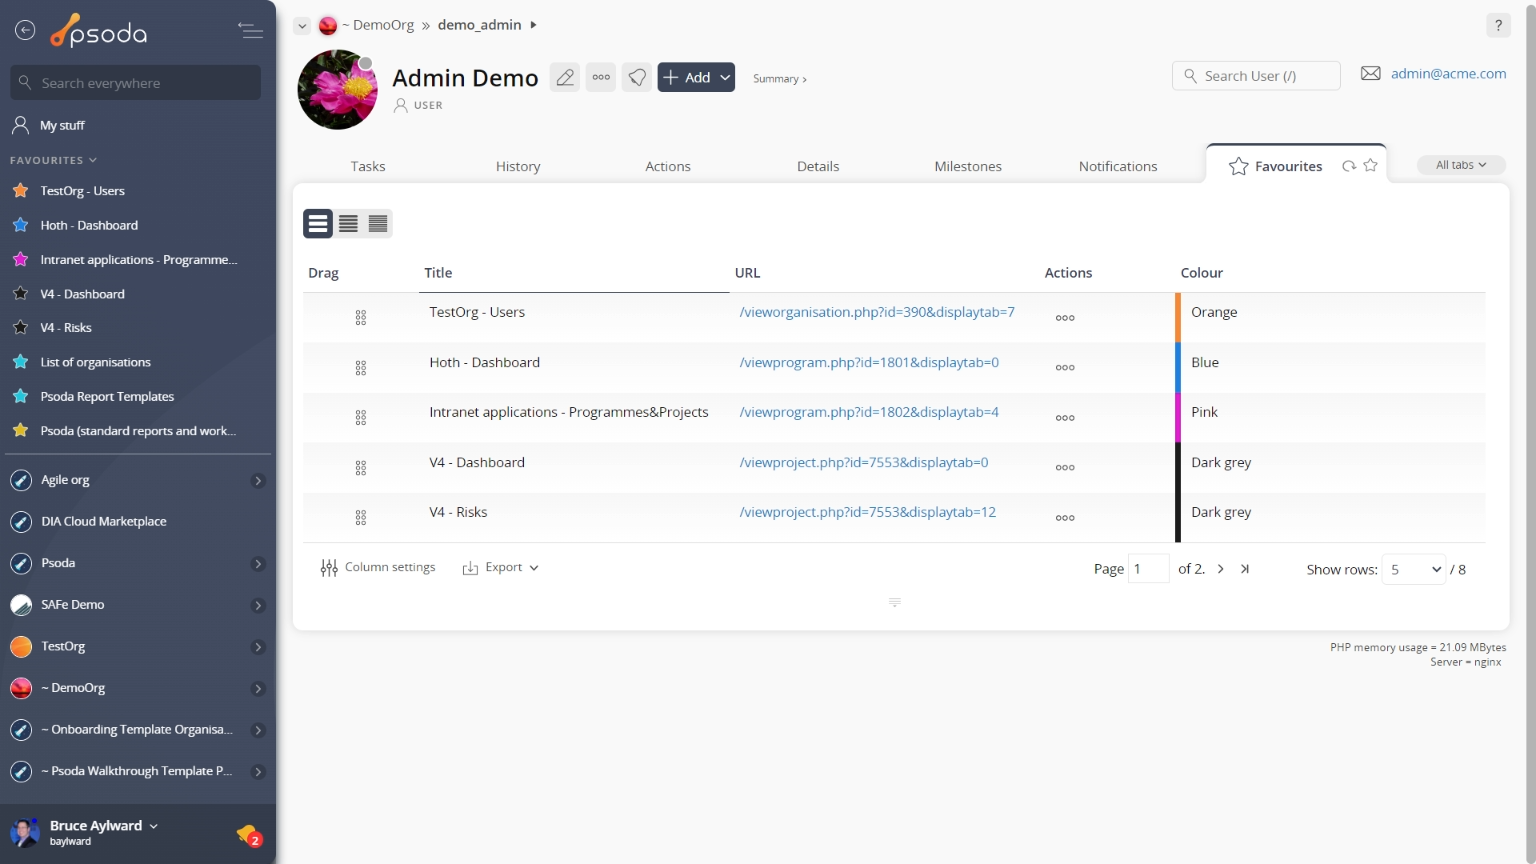
Figure 16 – User favourites tab
 GANTT
GANTT
This tabbed view shows the GANTT chart shown in Figure 17, showing a forecast schedule built up by information from assets in Psoda that are allocated to this user. By default, this table shows the name of the asset and it’s start and end dates.
On the right-most side of the chart there is a breakdown of tasks in a visual format than will span across a monthly, weekly or daily scale (this is setting dependent). The users who are allocated to each asset will have their names written next to this asset’s timeline.
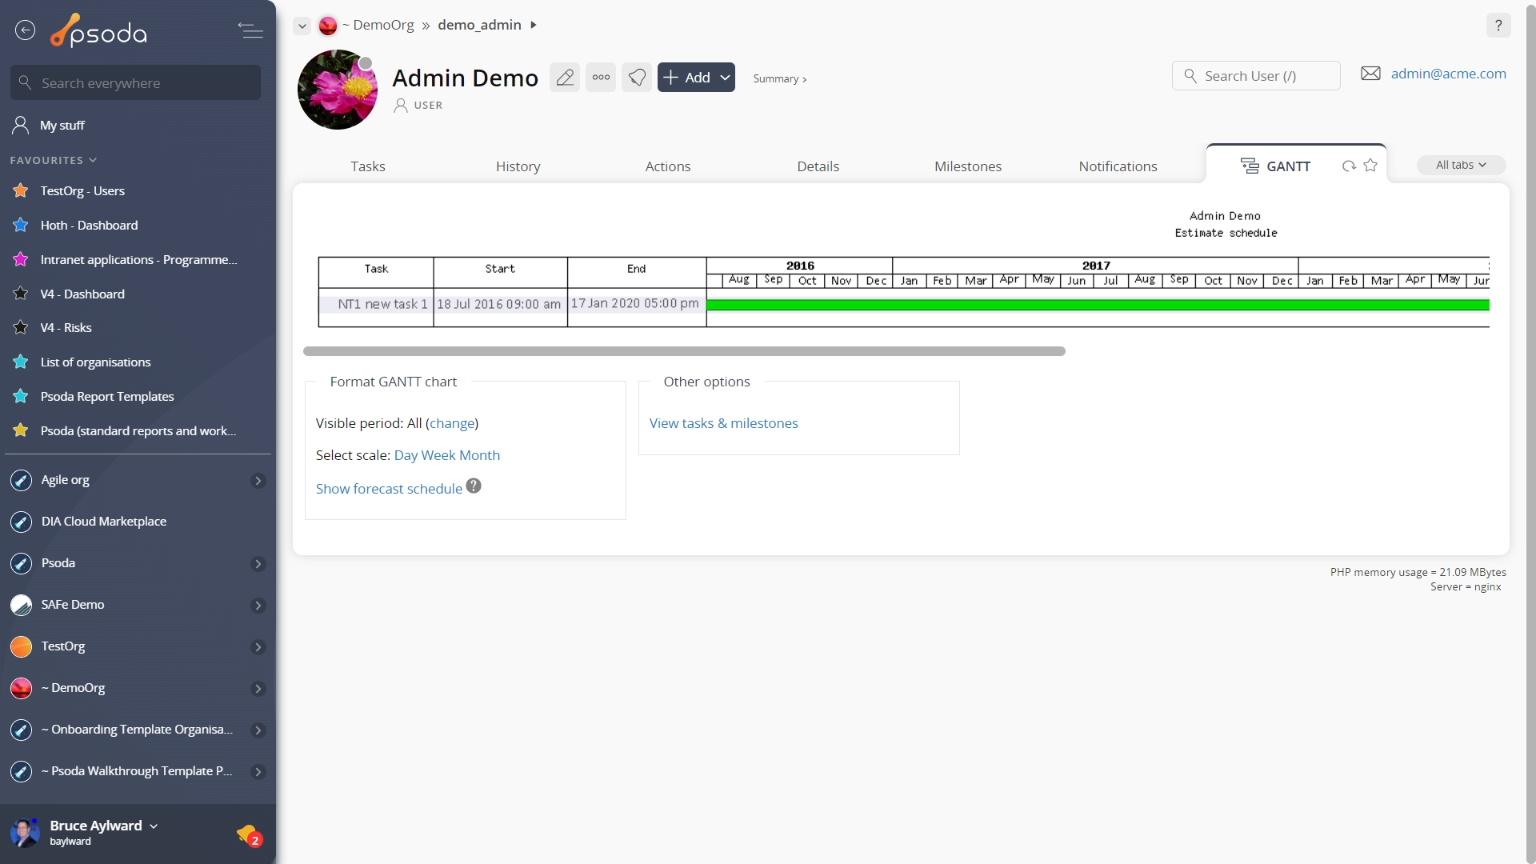
Figure 17 – User GANTT chart
At the very bottom of this tabbed view you are presented with a number of table information formatting options which will adjust the GANTT’s visible period, or scale, or whether it displays more than just task dates.
 History
This tab shows shows some basic history of the user, as shown in Figure 18. By default, this tab will present you with a number of details about the user’s history such as the creation date, creation user, last update date and last update user. If the user has been changed then this section will also show a table of all the changes that has been made, including the date of each change, the field changed, the value before the change and the user who made the change.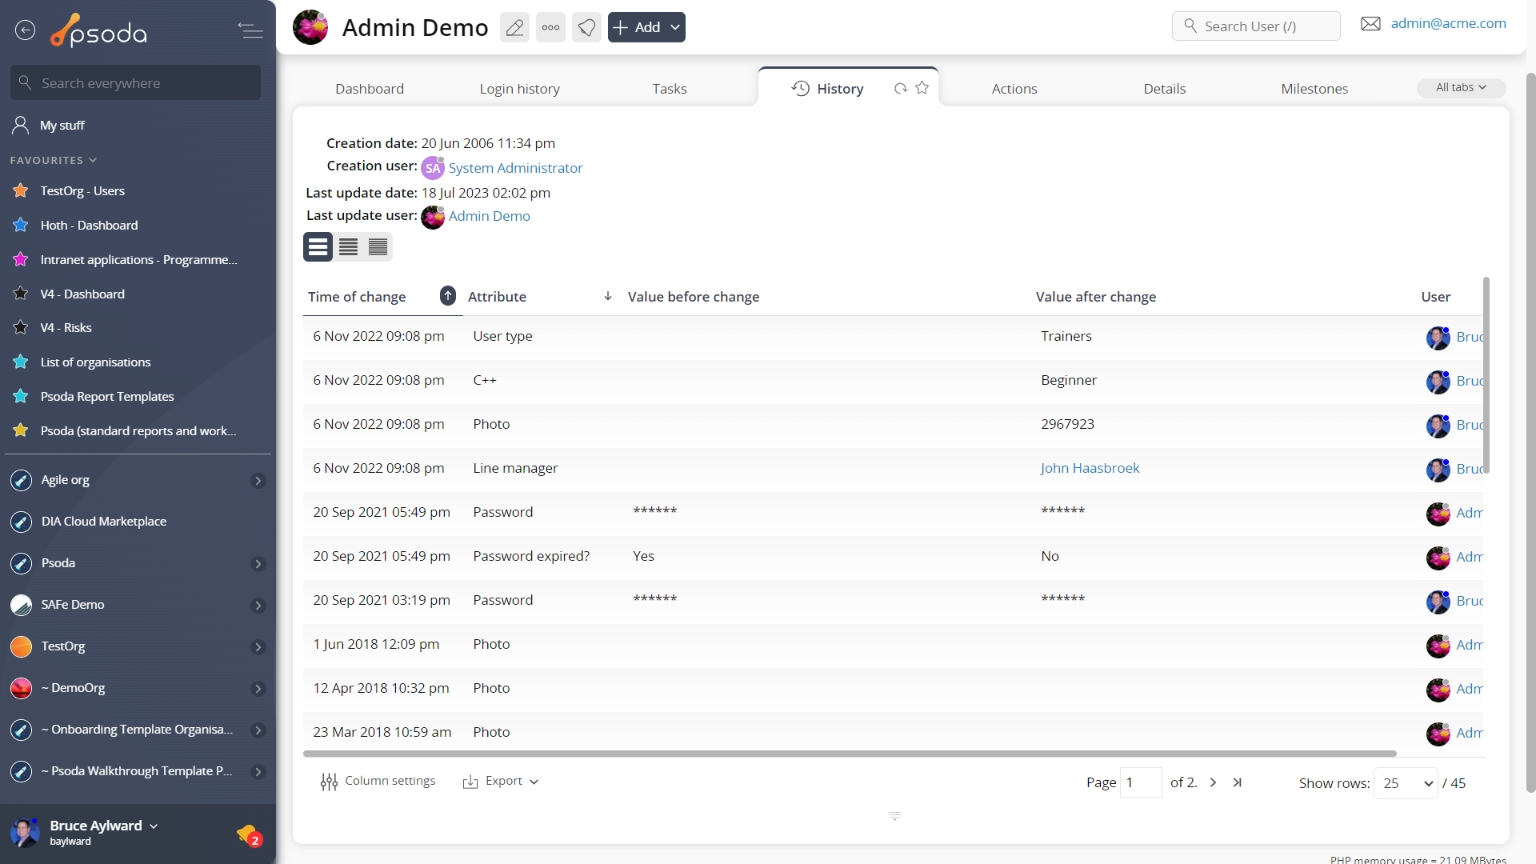
Figure 18 – User history tab
Note that you can customise your change table view by clicking the ![]() edit button at the bottom of the change table. Here, you can also export this list of changes to
edit button at the bottom of the change table. Here, you can also export this list of changes to ![]() Excel or
Excel or ![]() CSV files.
CSV files.
 Issues
This tabbed view shows the issues table as seen in Figure 19, listing any issues that have been allocated to or initiated by this user. By default, this table provides impact and priority information, plan progress and resolution dates for the issues listed, as well as any actions that can be taken. The workflow column also provides information as to the next workflow transitions available.
The Actions column of the issues table provides accessible functions to act on a chosen issue. These functions include 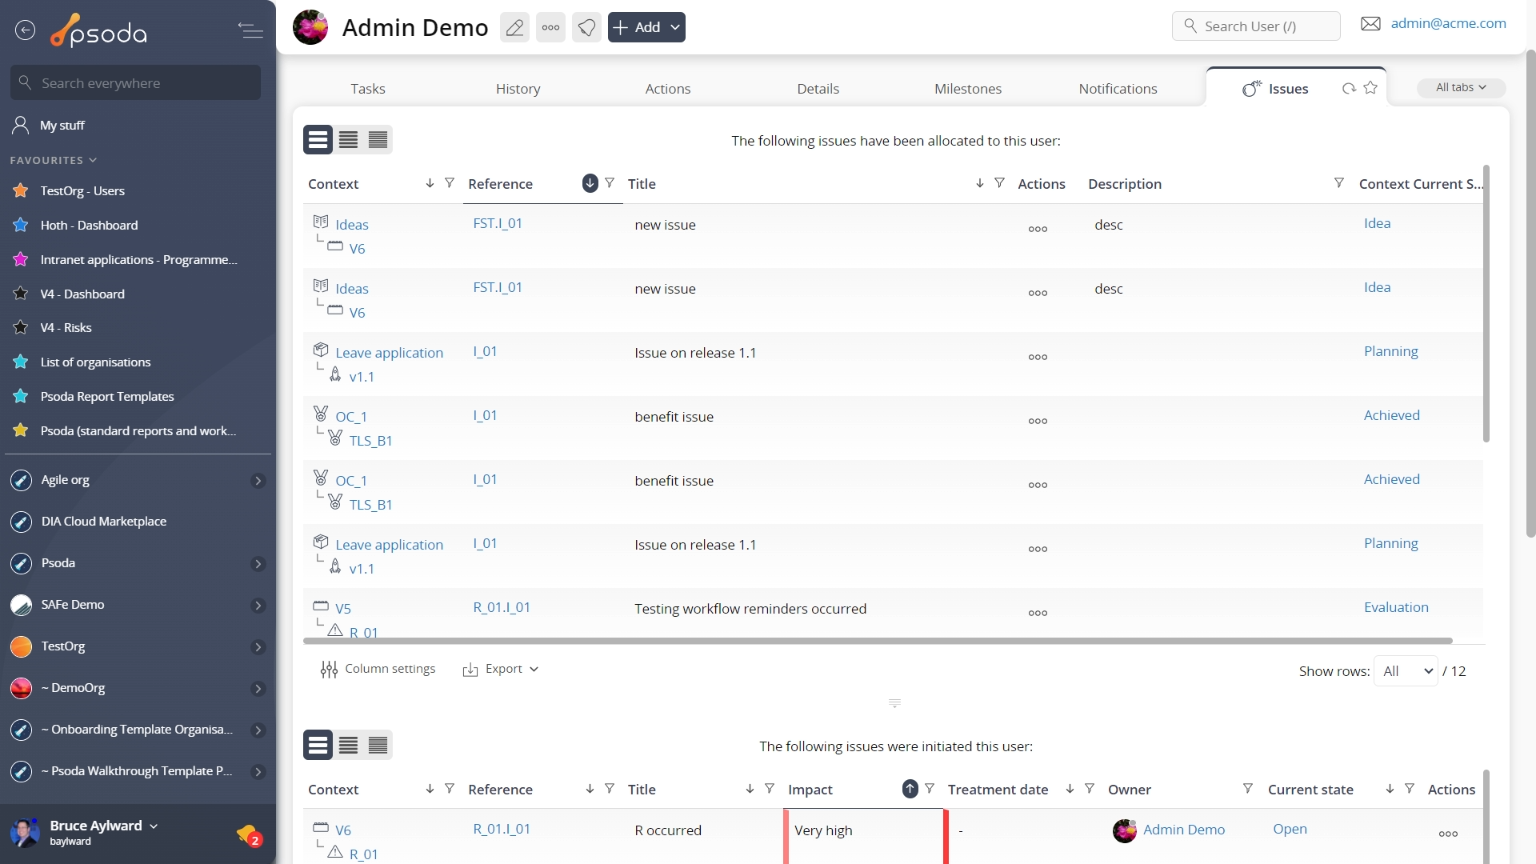
Figure 19 – User issues tab
Note that at the bottom of the table you can Leave applications
This tab shows an asset listing of all of the leave applications that have been logged for this user, as shown in Figure 20. By default this leave applications table will list some details for the leave such as the start and end dates, number of leave days, leave type, current state and whether it has been approved or not. If you click on the link beneath the start date column, you will navigate into the selected leave application’s view page.
From the Actions column of this leave applications table, you can act on individual applications by 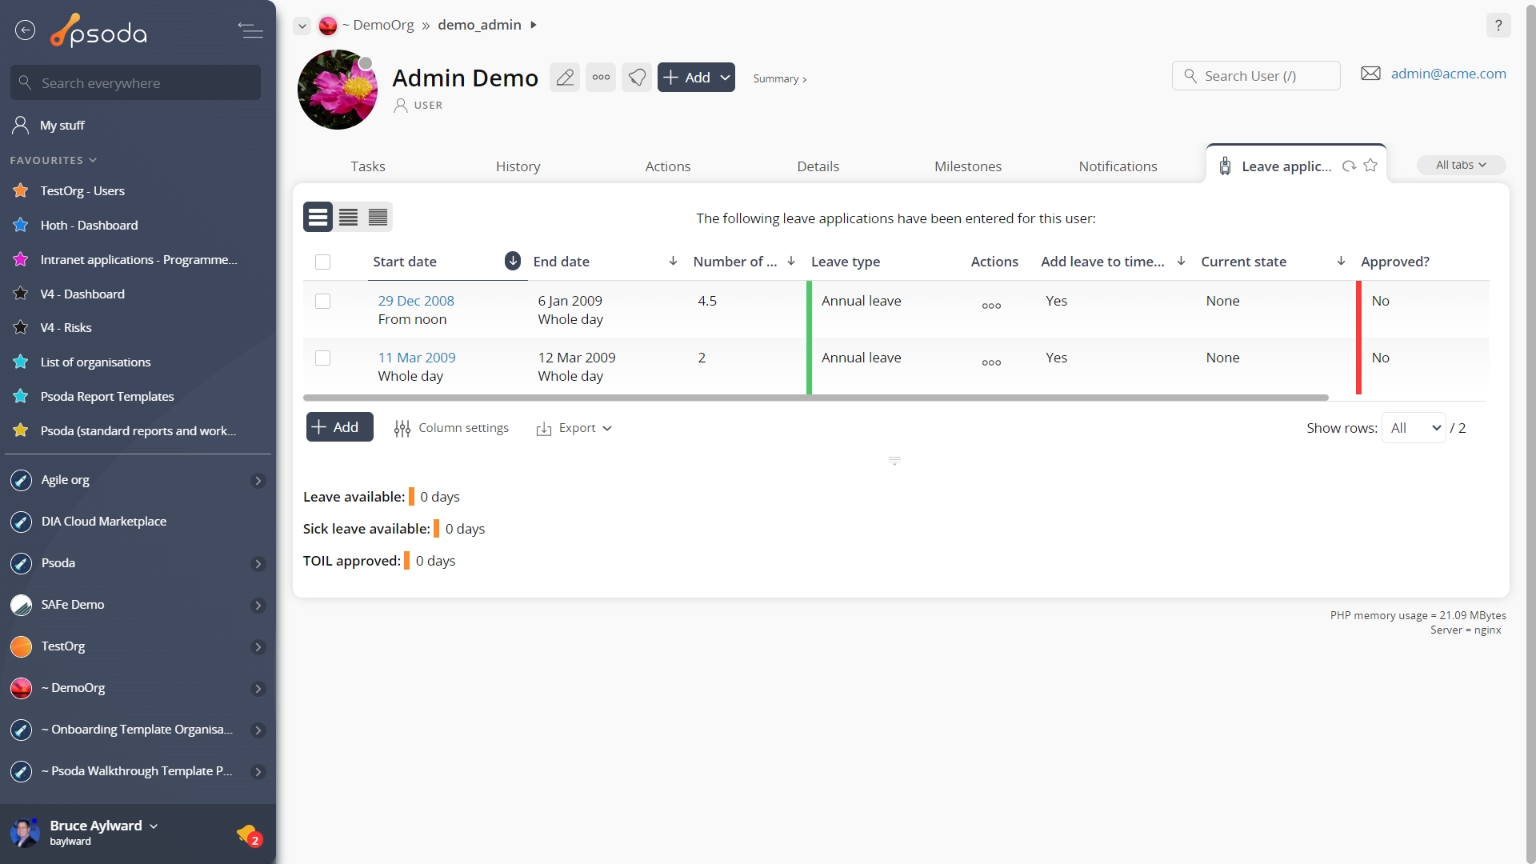
Figure 20 – User leave applications tab
Note that you can customise your table view by clicking the Login history
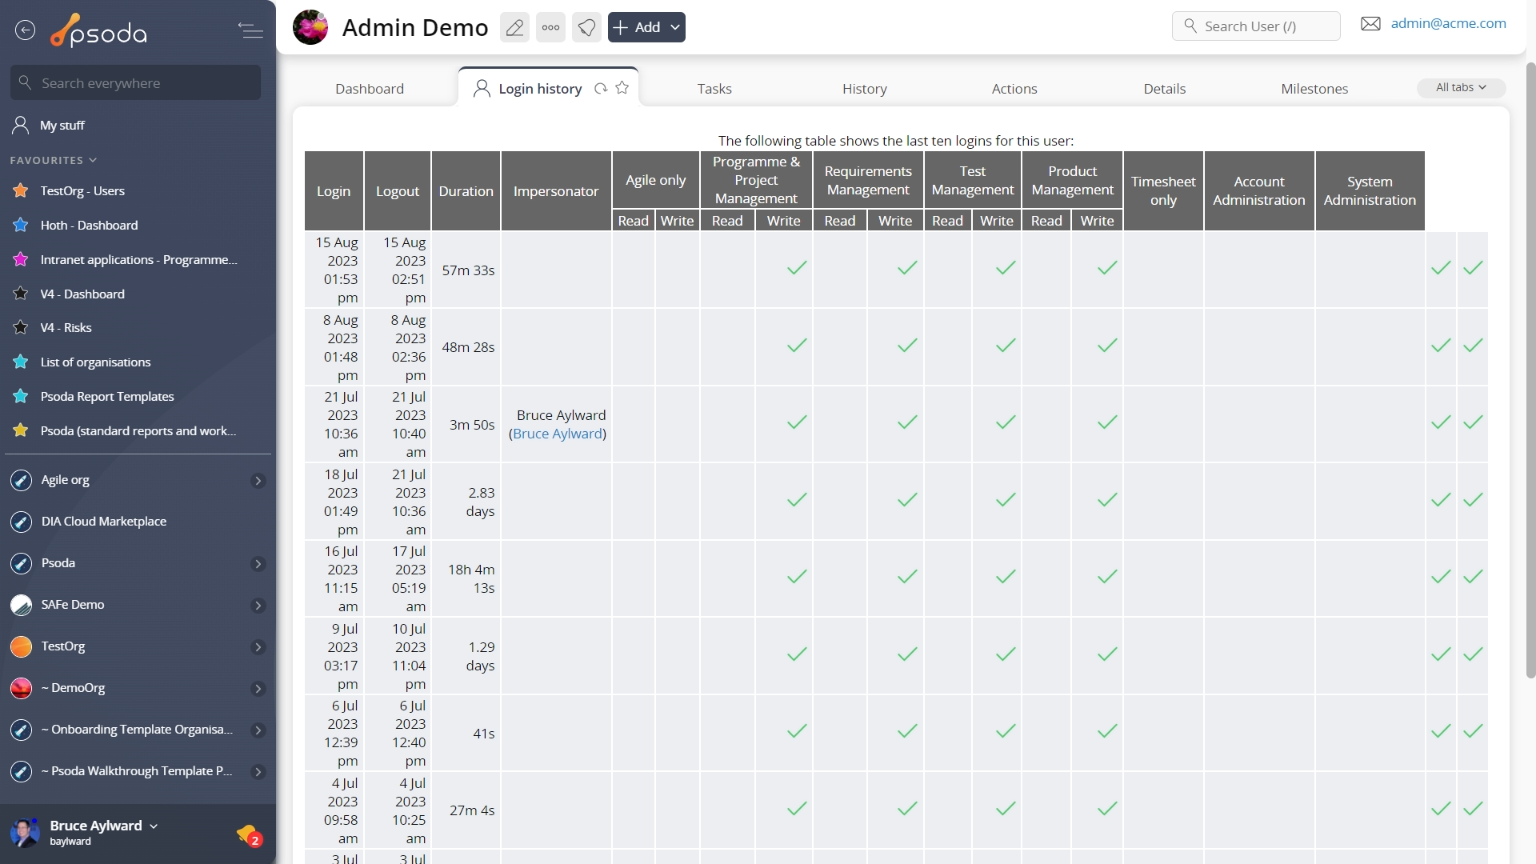
Figure 21 – User login history tab
This tab/section shows a table listing the login and logout times for this user. Follows
This tab shows an asset listing of all of the follows that this user has been registered for, as shown in Figure 20. By default this follows table will list some details for the follow such as the last update date, source and if it was owner or allocated only. If you click on the link beneath the last update date column, you will navigate into the selected follow’s view page.
From the Actions column of this follows table, you can act on individual follows by 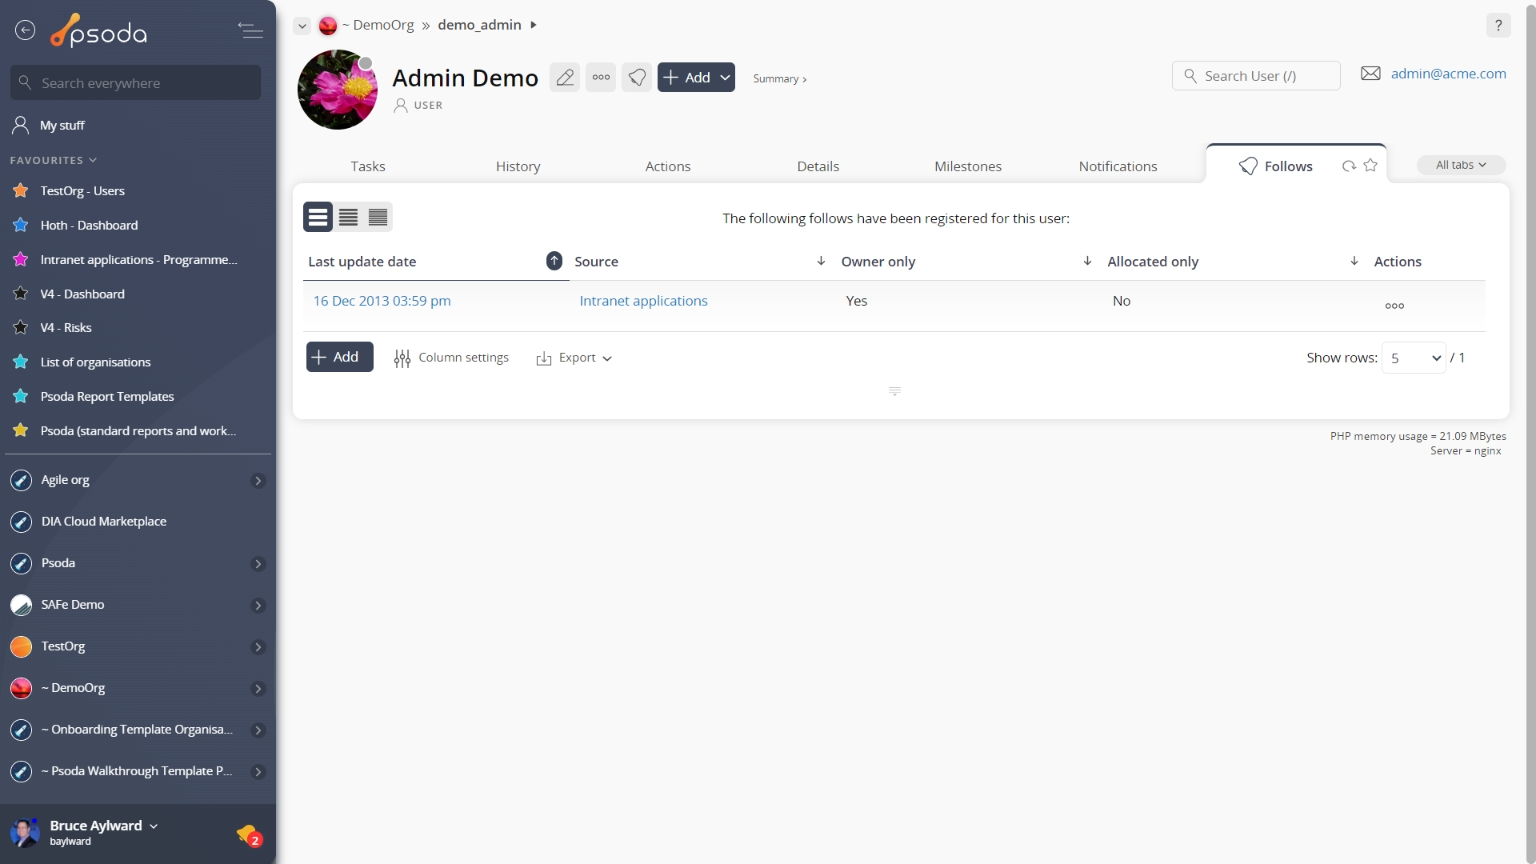
Figure 22 – User follows tab
Note that you can customise your table view by clicking the ![]() edit button at the bottom of the table, where you may also be presented with the option to add more
edit button at the bottom of the table, where you may also be presented with the option to add more ![]() follows for this user. Here, you can also export this list to
follows for this user. Here, you can also export this list to ![]() Excel or
Excel or ![]() CSV files.
CSV files.
 Productivity
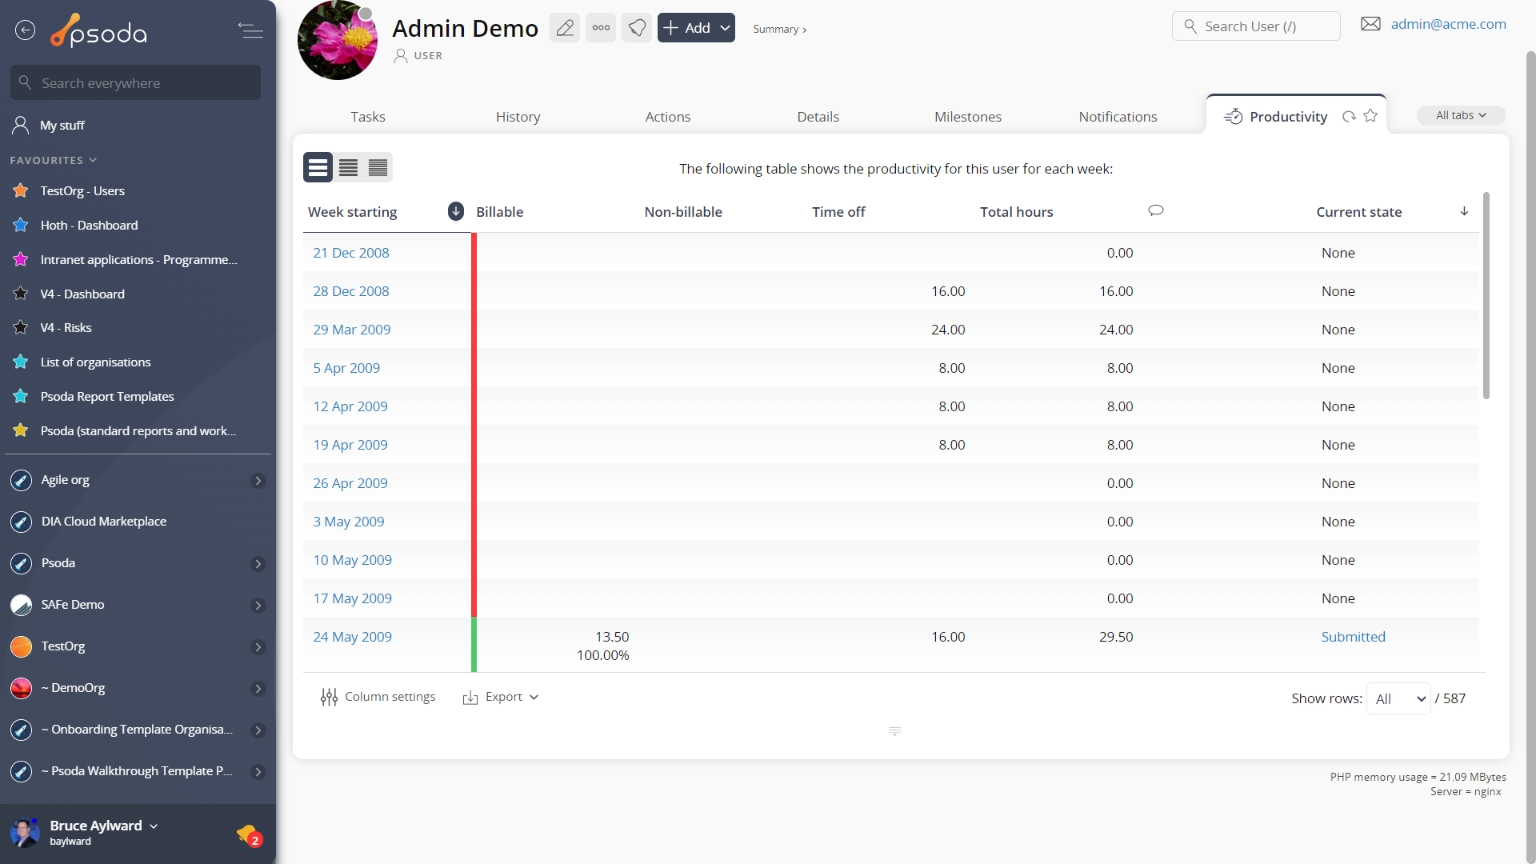
Figure 23 – User productivity tab
 Projects
This tabbed view shows the projects table as seen in Figure 24, providing a high level overview of the status of each listed project that this user is a manager, owner or sponsor for. By default, this table view will also show you the project’s context, Red/Amber/Green (RAG) status, RAG change, counters of open items such as actions and risks, estimated effort and cost information, the current state of the asset, any workflow transitions that may become applicable if a workflow has been applied to this asset, and the project type. If you select the link beneath the project column, you will navigate into the selected project’s view page.
From the Actions column of this projects table, you can act on individual projects by 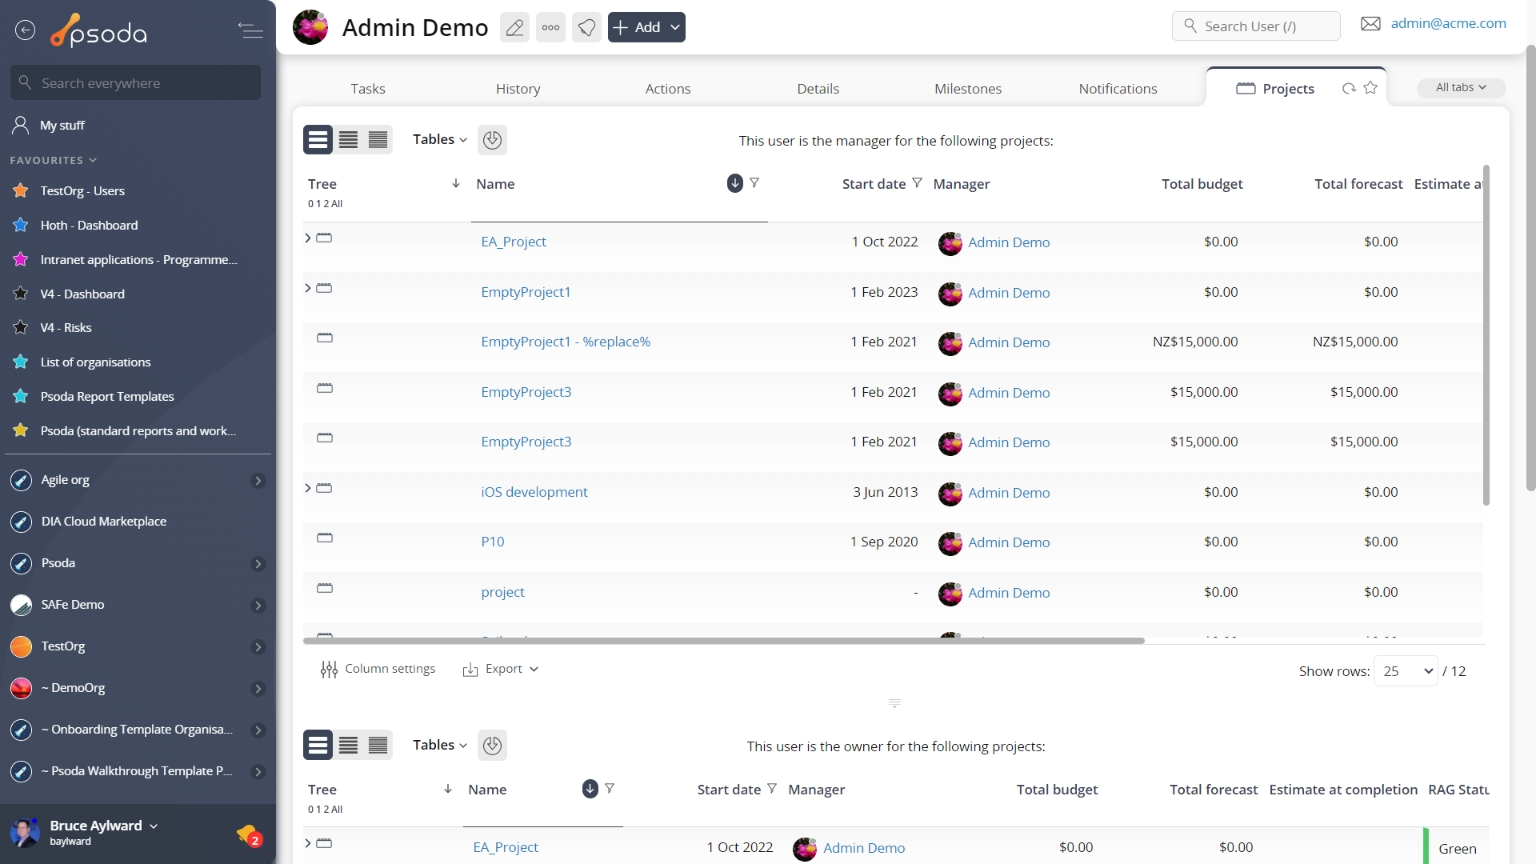
Figure 24 – User project tab
Note that you can customise your change table view by clicking the Reports
This tabbed view shows a listing of the reports as seen in Figure 25, listing any reports available for this user.
Figure 25 shows a portion of this alphabetical listing, and your specific list may vary slightly depending on if your System Administrator has created any new report templates that have been customised to be available to your organisation only.
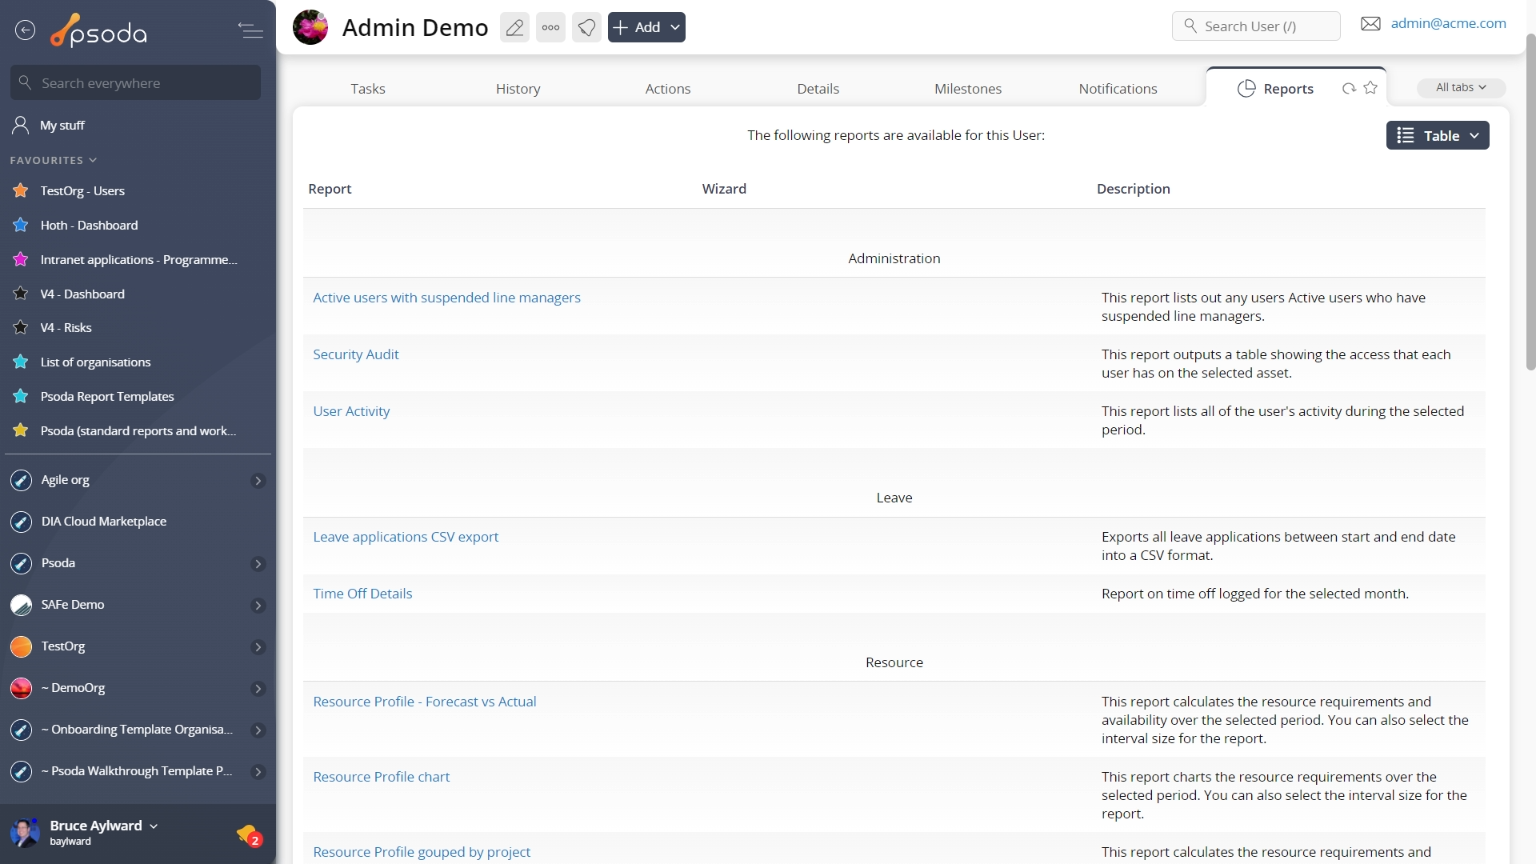
Figure 25 – Project report tab
This listing is unable to be customised, but provides the name of the report and a more detailed description of what information this report is built for and how the report is grouped.
Once you click on a report’s name, the run report form will popup. These popup forms vary depending on the report being run. Requirements
This tab shows an asset listing of all of the requirements allocated to this user, as shown in Figure 26. By default this requirements table will list some details for the requirements such as the reference, category, description, priority, weighting and current state. If you click on the link in the reference column, you will navigate into the selected requirement’s view page.
From the Actions column of this requirements table, you can act on individual requirements by 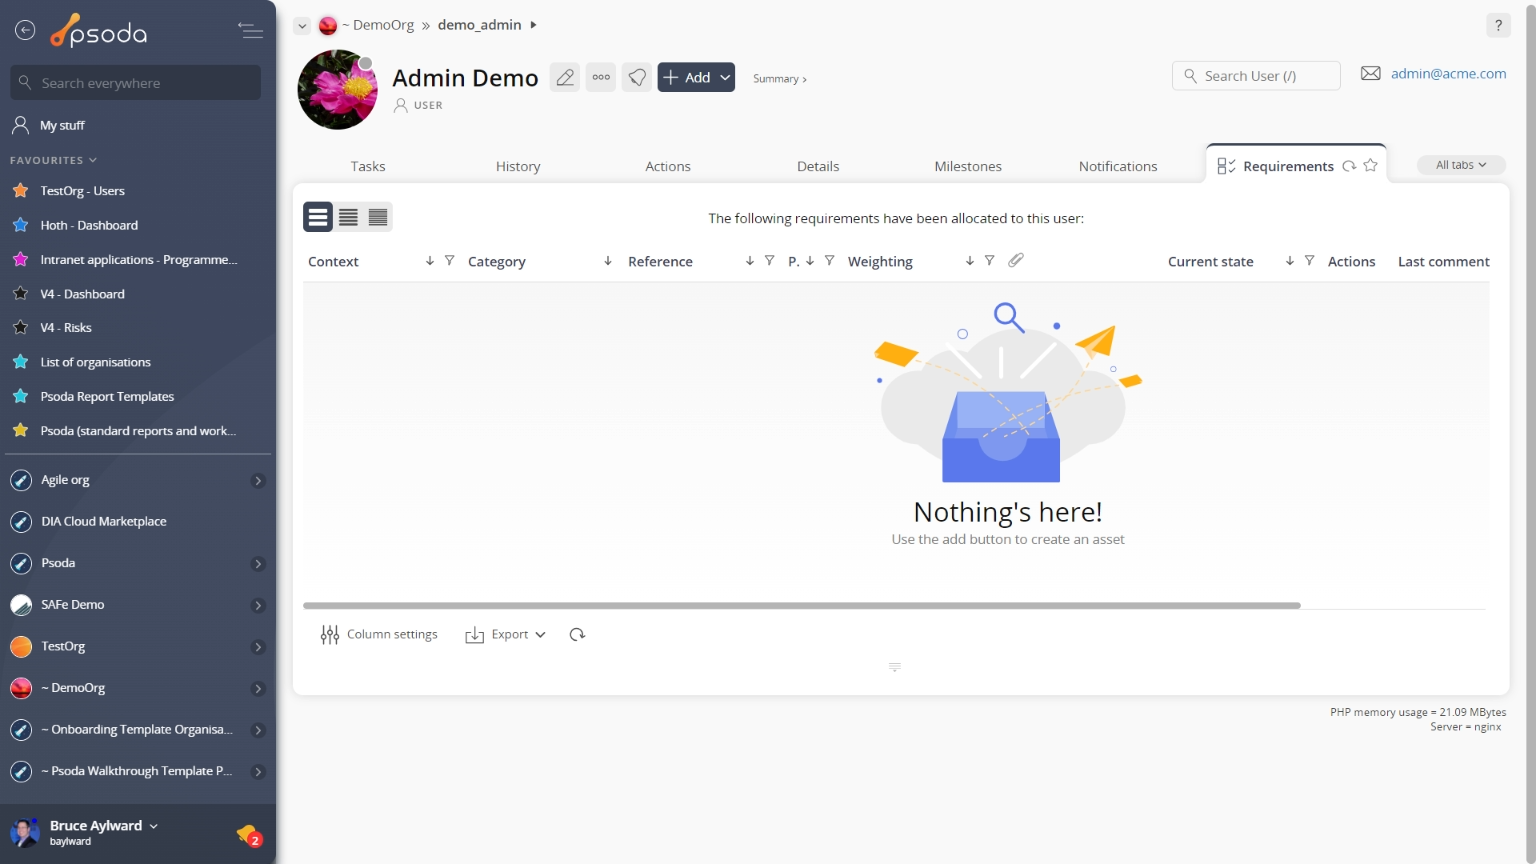
Figure 26 – User requirements tab
Note that you can customise your table view by clicking the Risks
Risks
This tabbed view shows the risks table as seen in Figure 27, listing any risks that have been allocated to or created by this user. By default, you will be shown the risk’s context, reference, title, description, proximity, any workflow transitions that may be available and other details also captured in the screenshot below.
The Actions column of this table provides accessible functions to act on a chosen role. These functions include 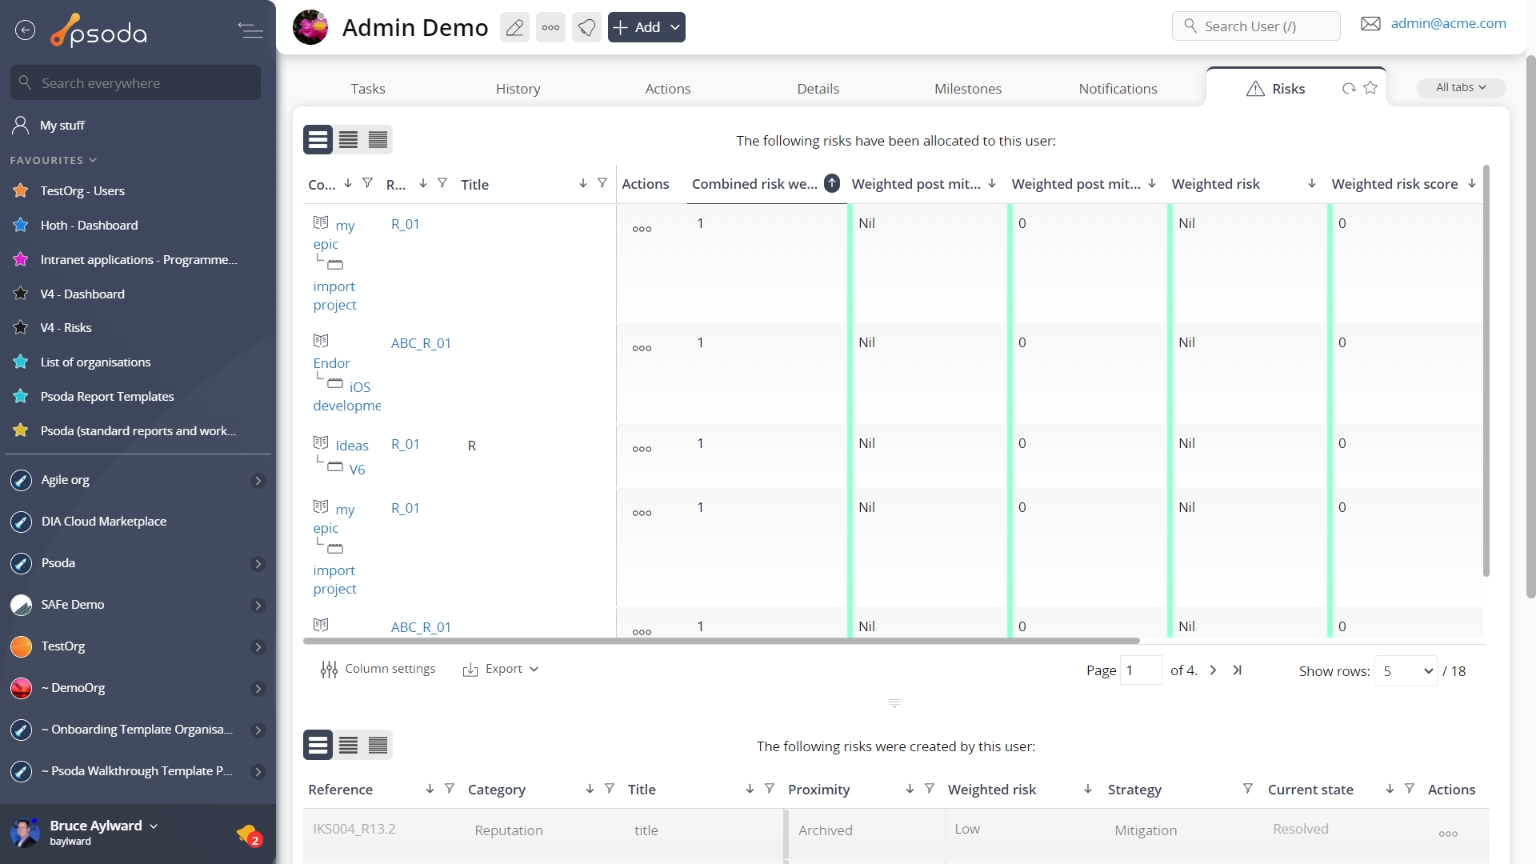
Figure 27 – User risk table
Note that at the bottom of this table you can customise your table view by clicking the Roles
Roles
This tabbed view shows the roles table as seen in Figure 28, listing any roles that this user is a member of. By default, you will be shown the role’s name, description and editable daily and hourly rates for members of this role, along with a list of users who are members of this role.
The Actions column of this table provides accessible functions to act on a chosen role. These functions include 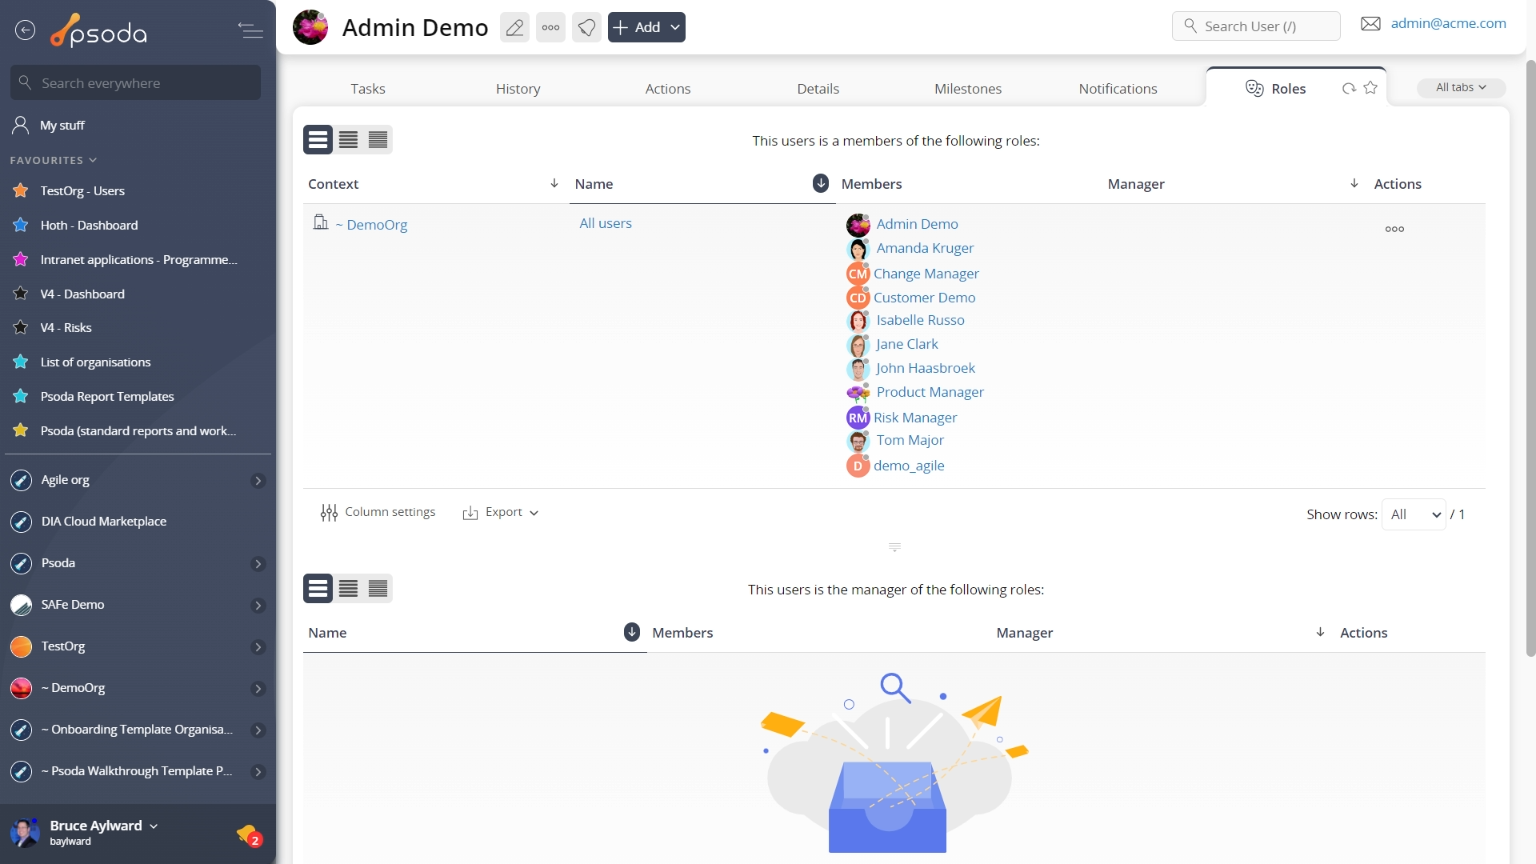
Figure 28 – Project roles table
Note that at the bottom of this table you can ![]() add another role to this project,
add another role to this project, ![]() edit the table columns to show or hide role information, or export this role list to
edit the table columns to show or hide role information, or export this role list to ![]() Excel or
Excel or ![]() CSV files.
CSV files.
Tasks
This tabbed view shows the tasks table as seen in Figure 29, listing any 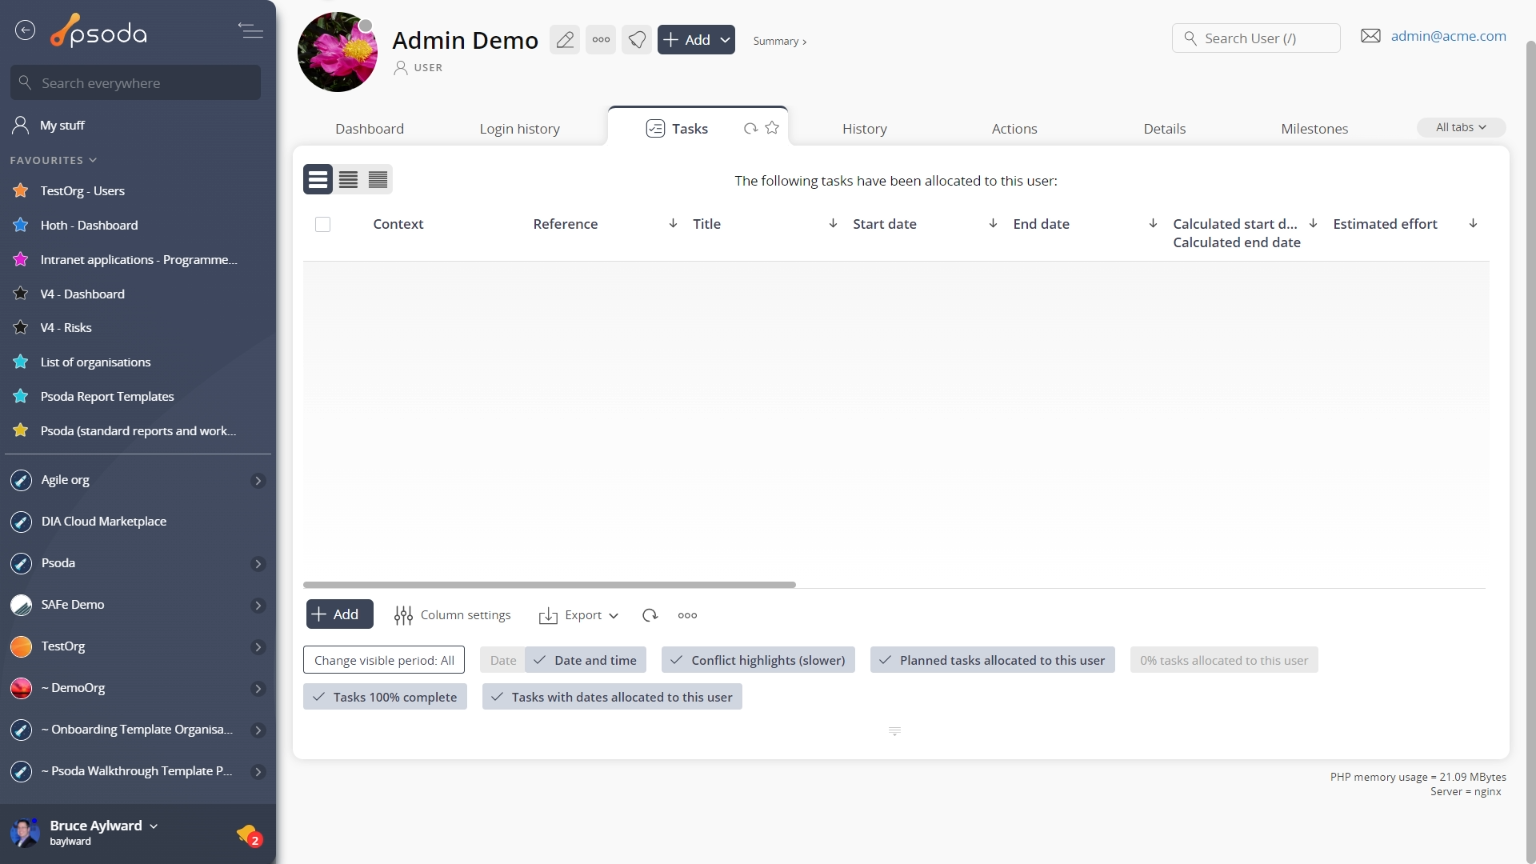
Figure 29 – User tasks and milestones table
Note that at the bottom of this table you can ![]() add another task,
add another task,![]() edit the table columns to show or hide asset information, or export this information to
edit the table columns to show or hide asset information, or export this information to ![]() Excel or
Excel or ![]() CSV files.
CSV files.
At the very bottom of this tabbed view you are presented with a number of table information formatting options which will increase/decrease the information you’re presented with, as well as other options to import task group/WBS information, view the information in a GANTT format or run a recalculation.
From this other options subsection at the bottom of this tabbed view, you may also have access to ![]() mass approve,
mass approve, ![]() mass complete or mass archive tasks.
mass complete or mass archive tasks.
Timesheets
This tab shows an asset listing of all of the timesheets added to this user, as shown in Figure 30. By default this timesheets table will list some details for the timesheets such as the starting date, a weekly breakdown, weekly total, attendance, expenses and it’s current state. If you click on the link in the week starting column, you will navigate into the selected timesheet’s view page.
From the Actions column of this requirements table, you can act on individual requirements by 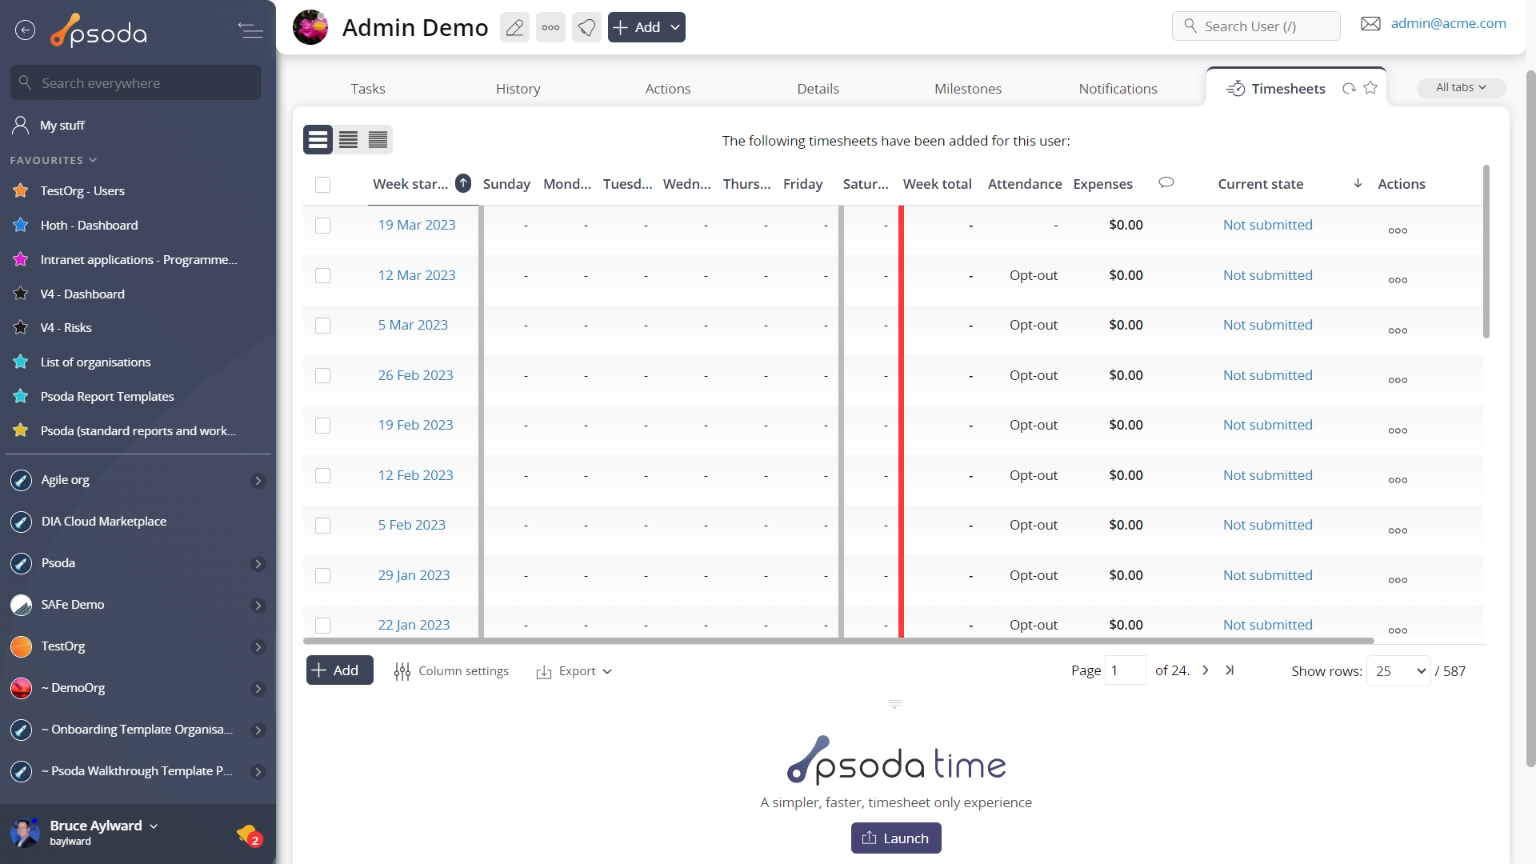
Figure 30 – User timesheets tab
Cells with a grey background are either weekends or public holidays. Some fields presented in this table may accomodate for inline editing. Votes
Votes
This tab shows shows the voting history for this user, as shown in Figure 31. By default, this tab will present you with a number of details about the user’s voting history such as the vote’s title, transition, when the vote was taken, the vote’s result and any notes associated with this vote to name a few details.
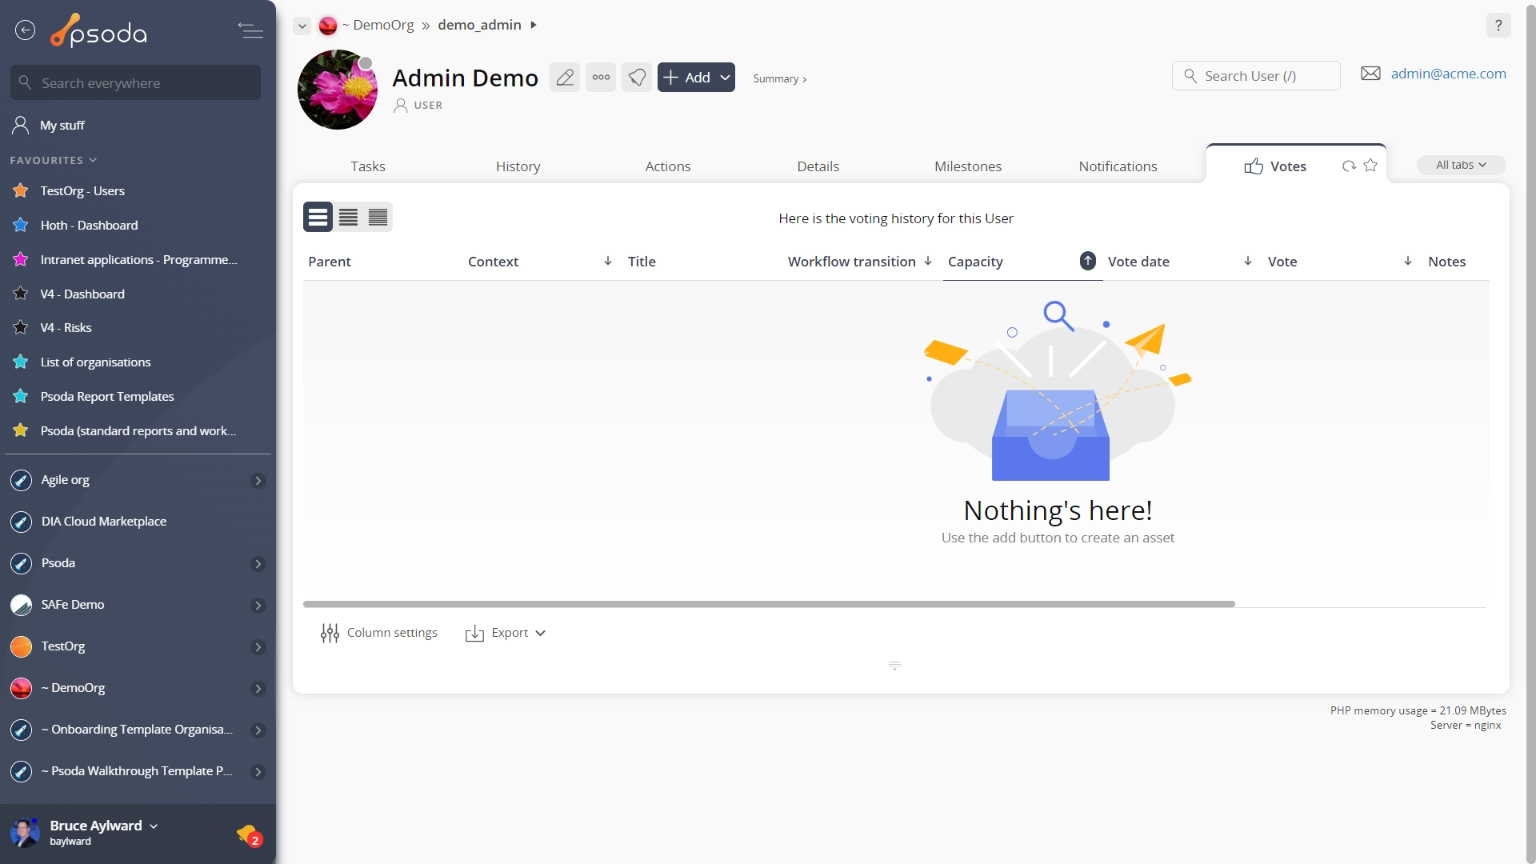
Figure 31 – User votes tab
Note that you can customise your table view by clicking the ![]() edit button at the bottom of the table. Here, you can also export this list to
edit button at the bottom of the table. Here, you can also export this list to ![]() Excel or
Excel or ![]() CSV files.
CSV files.
Workload
This tab shows a chart of the overall workload of allocated tasks for this user, including resource availability, as shown in Figure 32.
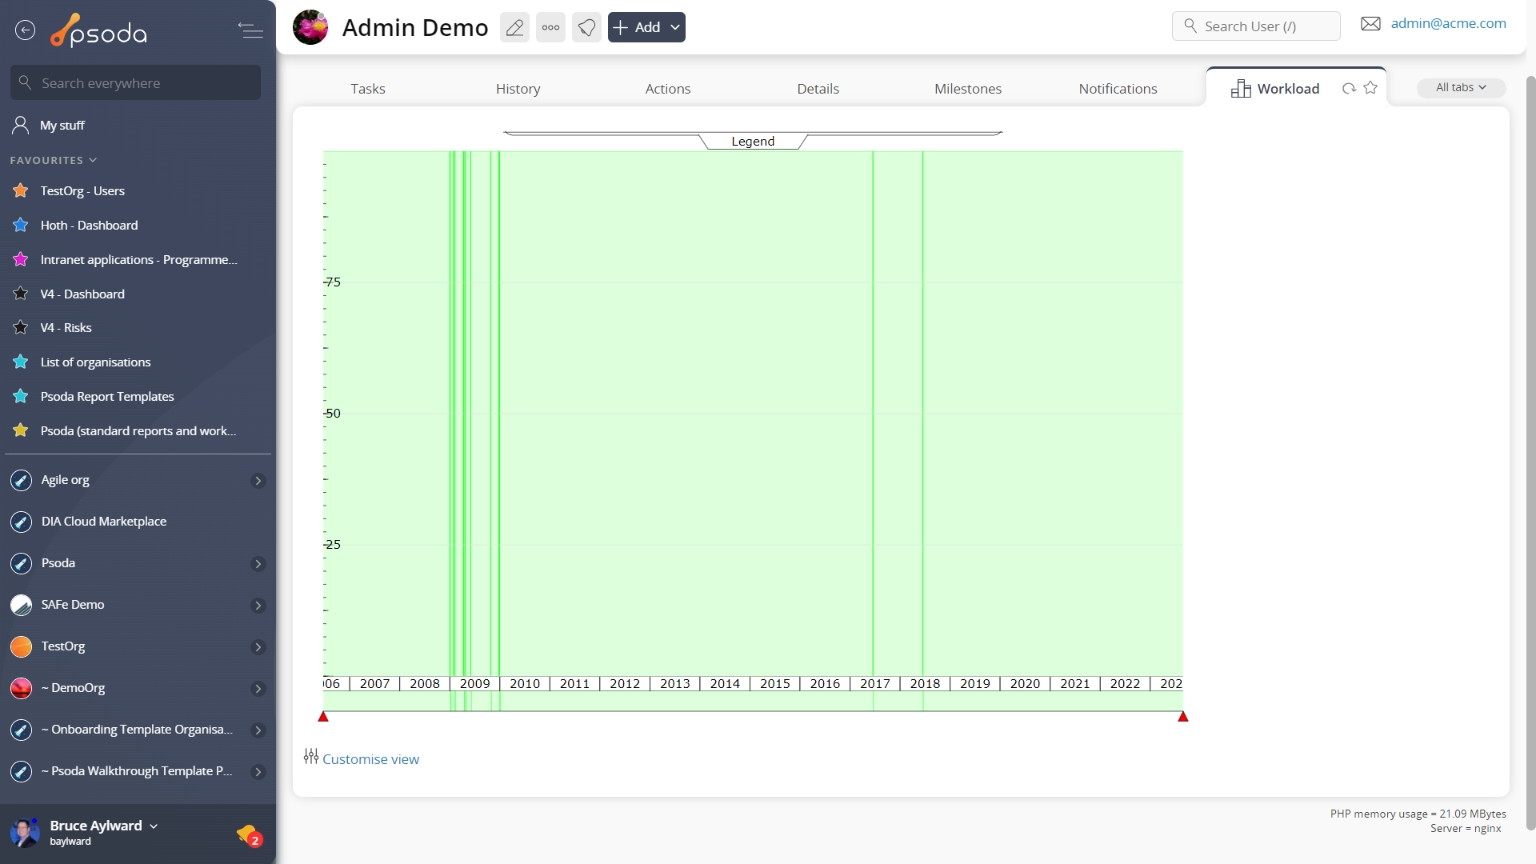
Figure 32 – User workload tab