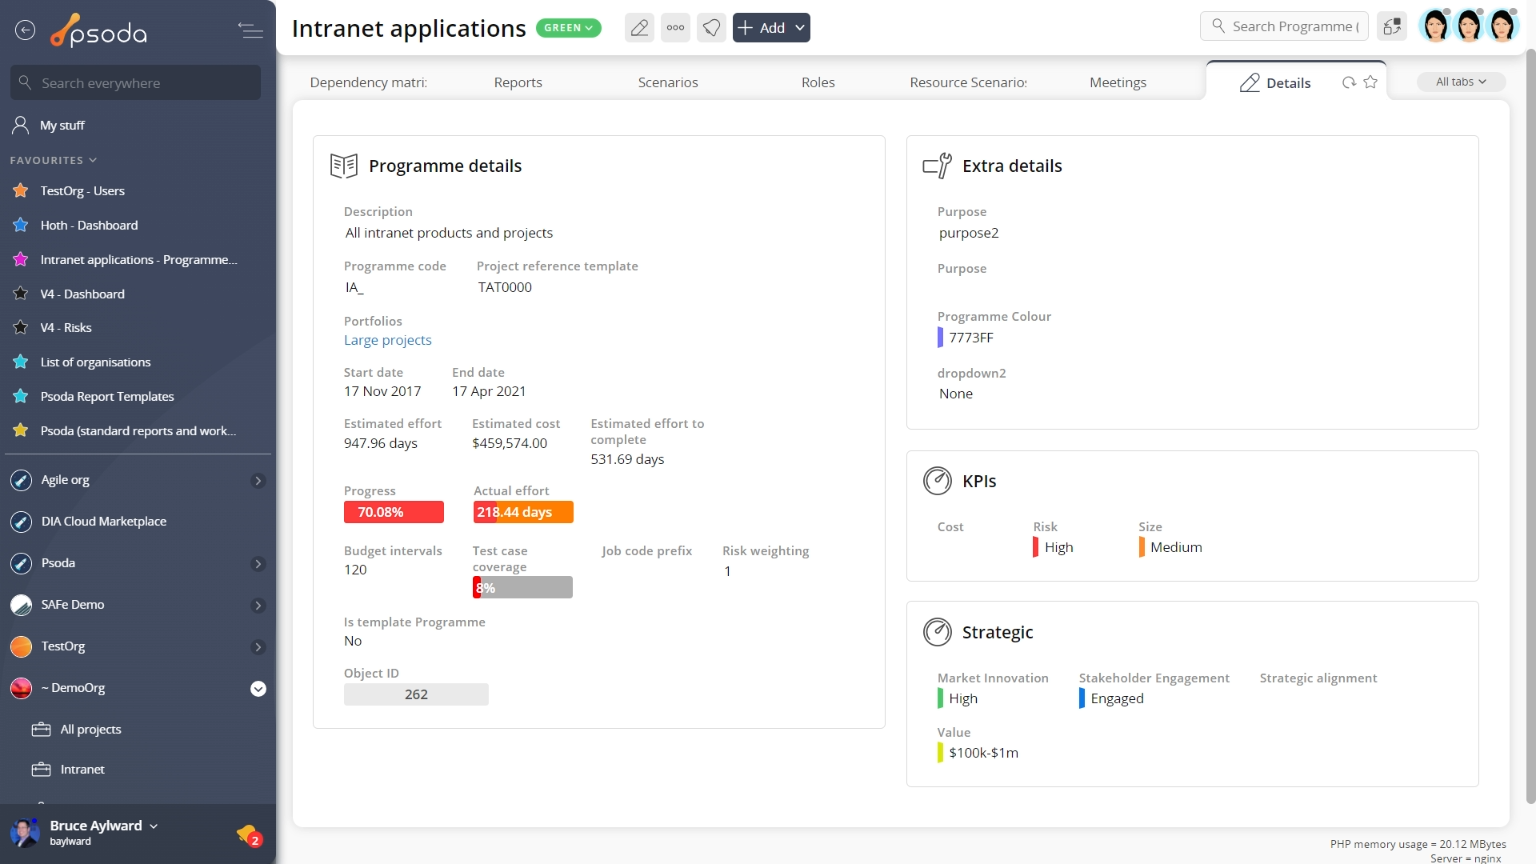
Figure 1 – Programme view page
The top header area allows you to Access Control Lists (ACLs)
This tab shows an asset listing of all of the access control lists this programme appears in, as shown in Figure 2. By default, this table will present you with a number of details about the ACLs such as the group of users that have access to this ACL and the a link to the list itself. If you click the link in the group column, you will navigate into the selected group’s view page. Equally, if you click the link in the ACL column, you will navigate into the selected ACL’s view page
From the Actions column of this ACLs table, you can act on individual ACLs by 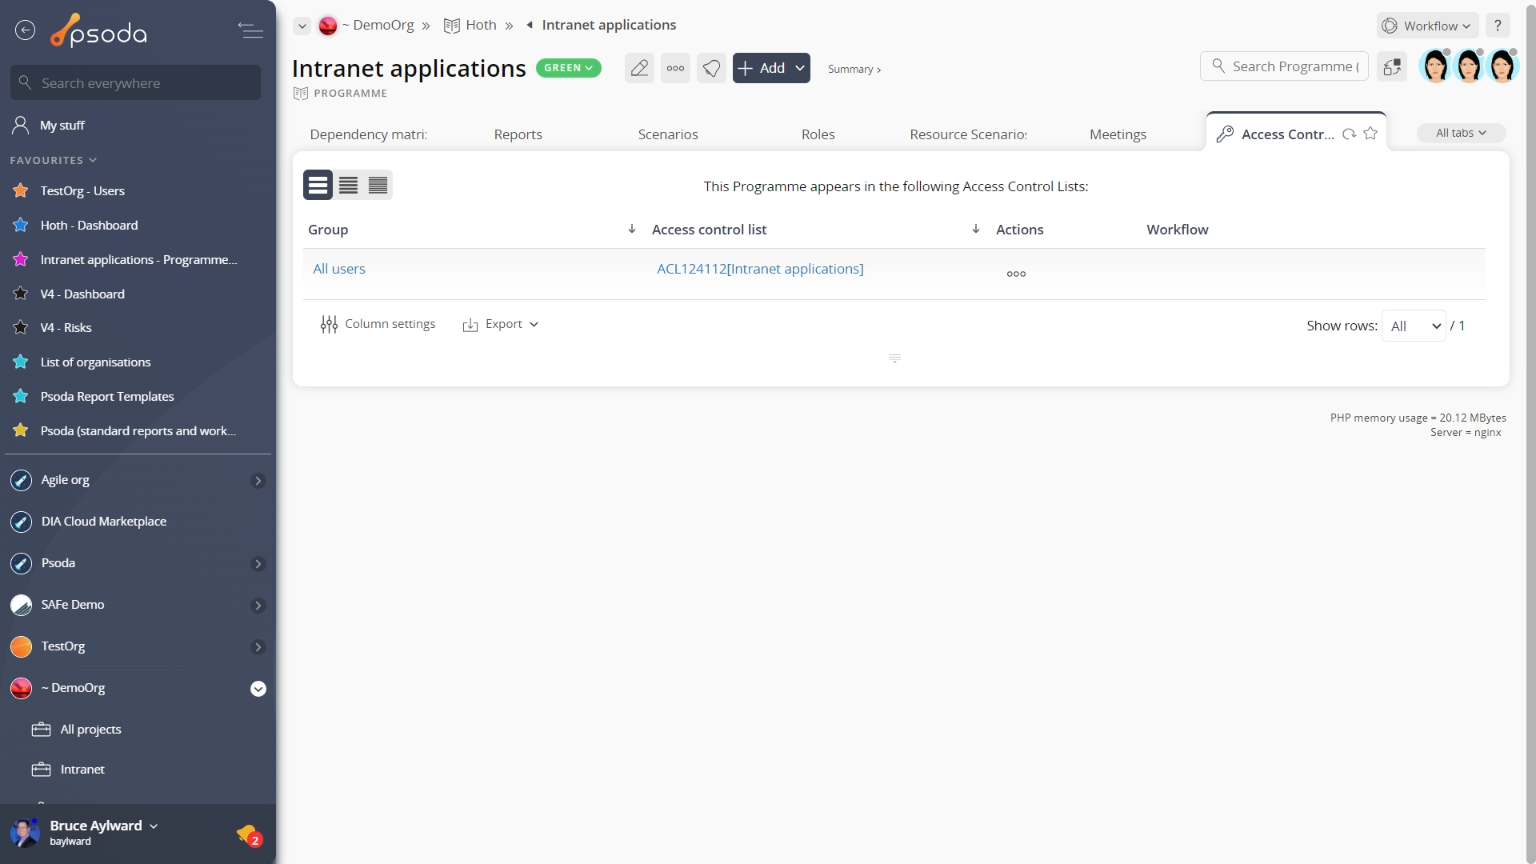
Figure 2 – Programme ACL tab
Note that you can customise your table view by clicking the Actions
This tab shows an asset listing of all of the actions registered for this programme, as shown in Figure 3. By default, this table will present you with a number of details about the actions such as it’s context, reference, description, priority and due date to name a few. If you click on the reference link of the listed action, you will navigate to that action’s view page.
From the Actions column of this actions table, you can act on individual actions by 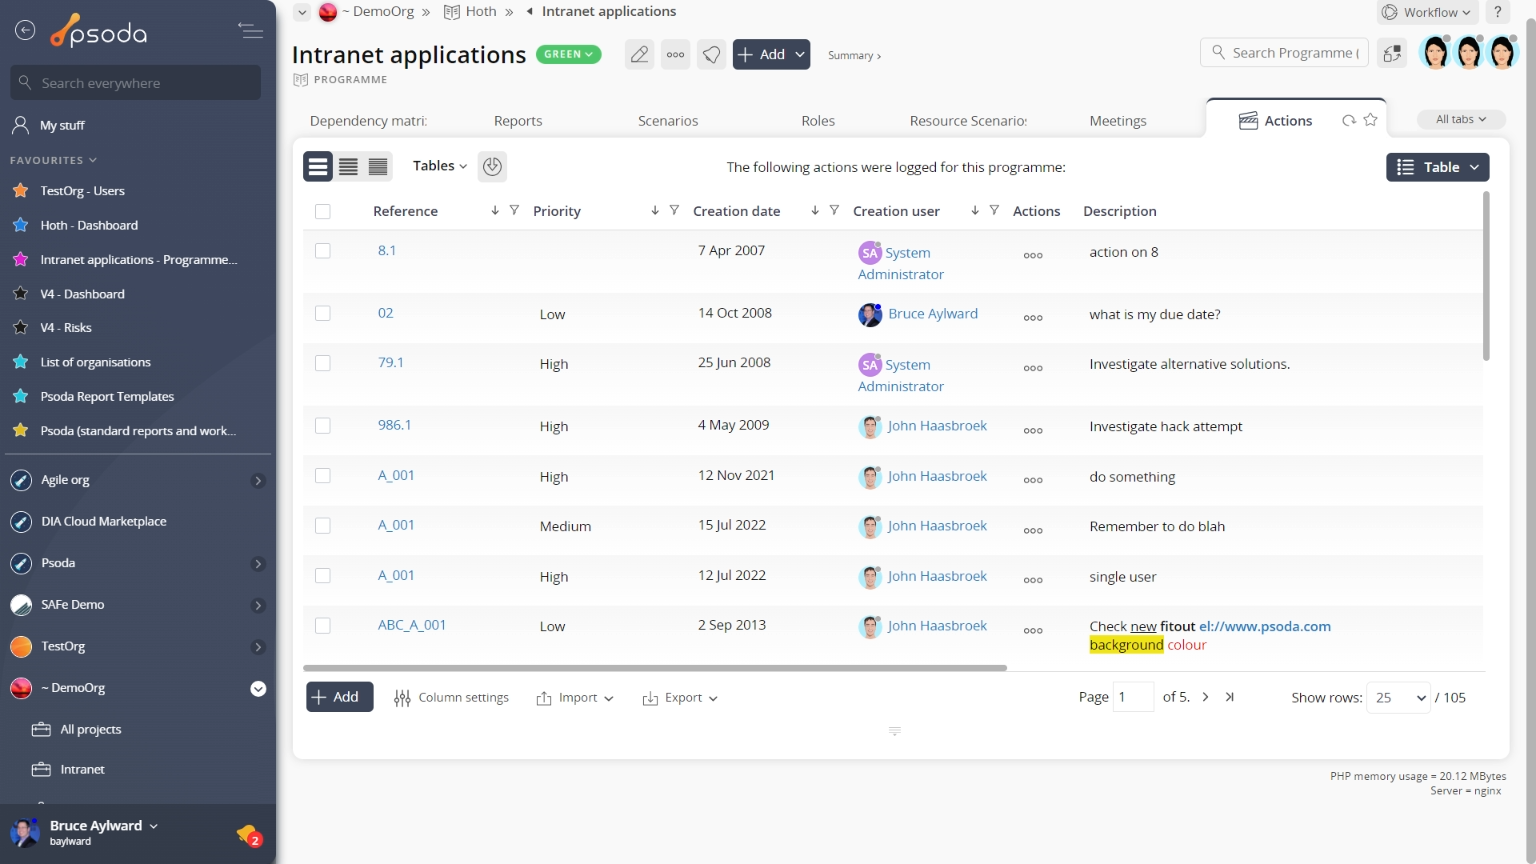
Figure 3 – Programme actions tab
Note that you can customise your table view by clicking the Advanced Estimates
This tab shows an asset listing of all of the tasks that have been added to this programme or projects below this programme that are scheduled according to advanced estimates, as shown in Figure 4. By default, this table will present you with a number of details about the advanced estimates such as it’s context, reference, start and end dates, the users listed as resources for that estimate, resource total and a breakdown of actual and variance comparisons for time breakdowns.
From the Actions column of this advanced estimates table, you can act on individual estimate by 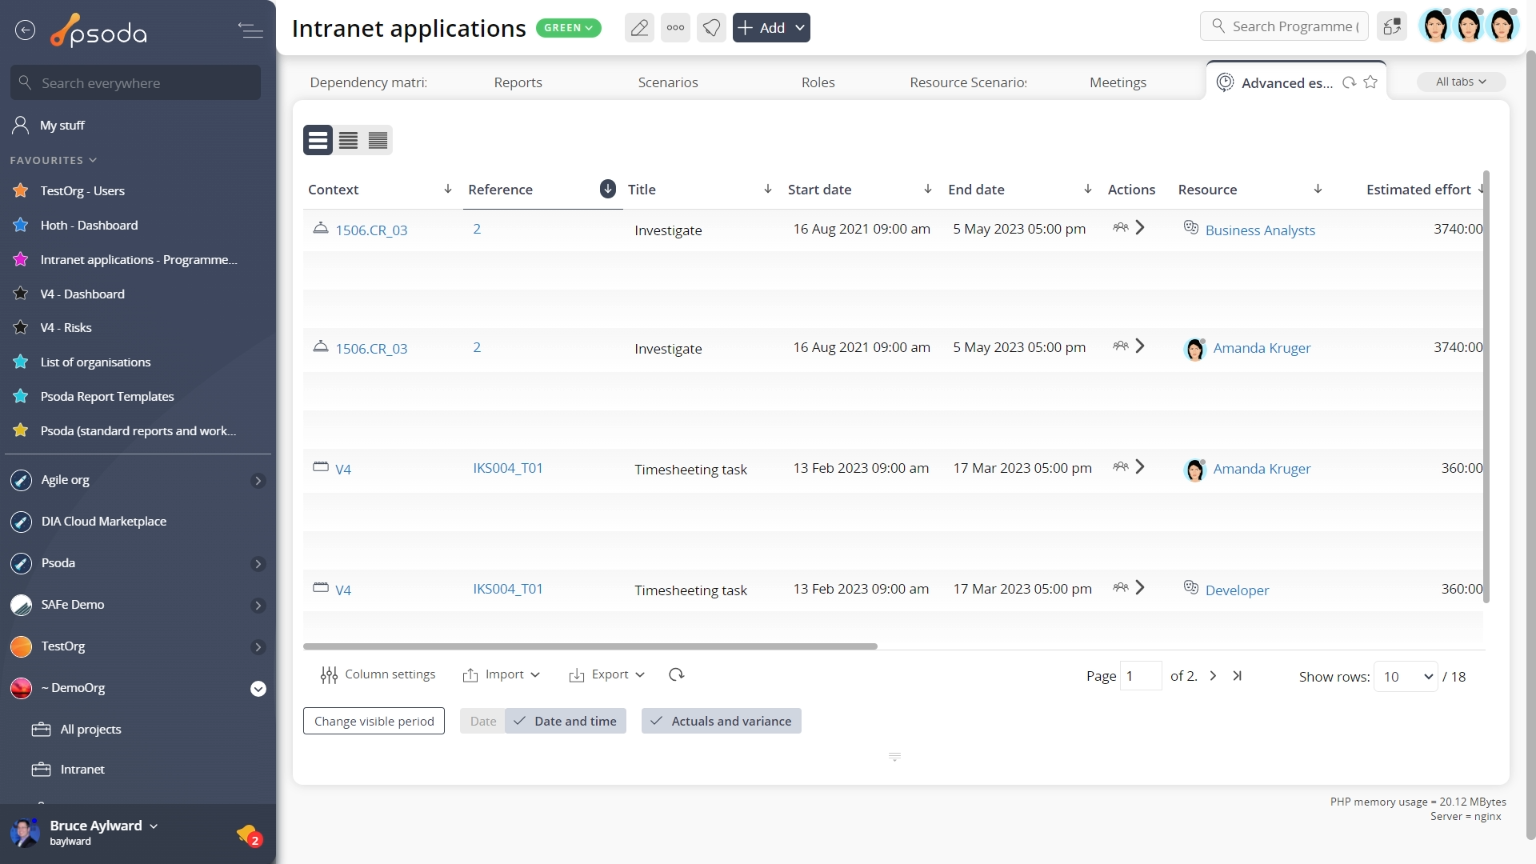
Figure 4 – Programme advanced estimates tab
Note that you can customise your table view by clicking the ![]() edit button at the bottom of the advanced estimates table. Here, you can also export this list to
edit button at the bottom of the advanced estimates table. Here, you can also export this list to ![]() Excel or
Excel or ![]() CSV files.
CSV files.
 Assumptions
This tab shows an asset listing of all of the assumptions that have been added to this programme, as shown in Figure 5. By default, this table will present you with a number of details about the assumptions such as it’s reference, title, description, the user who created this assumption and it’s current state. If you click on the reference link of the listed assumption, you will navigate to that assumption’s view page.
From the Actions column of this assumptions table, you can act on individual assumption by 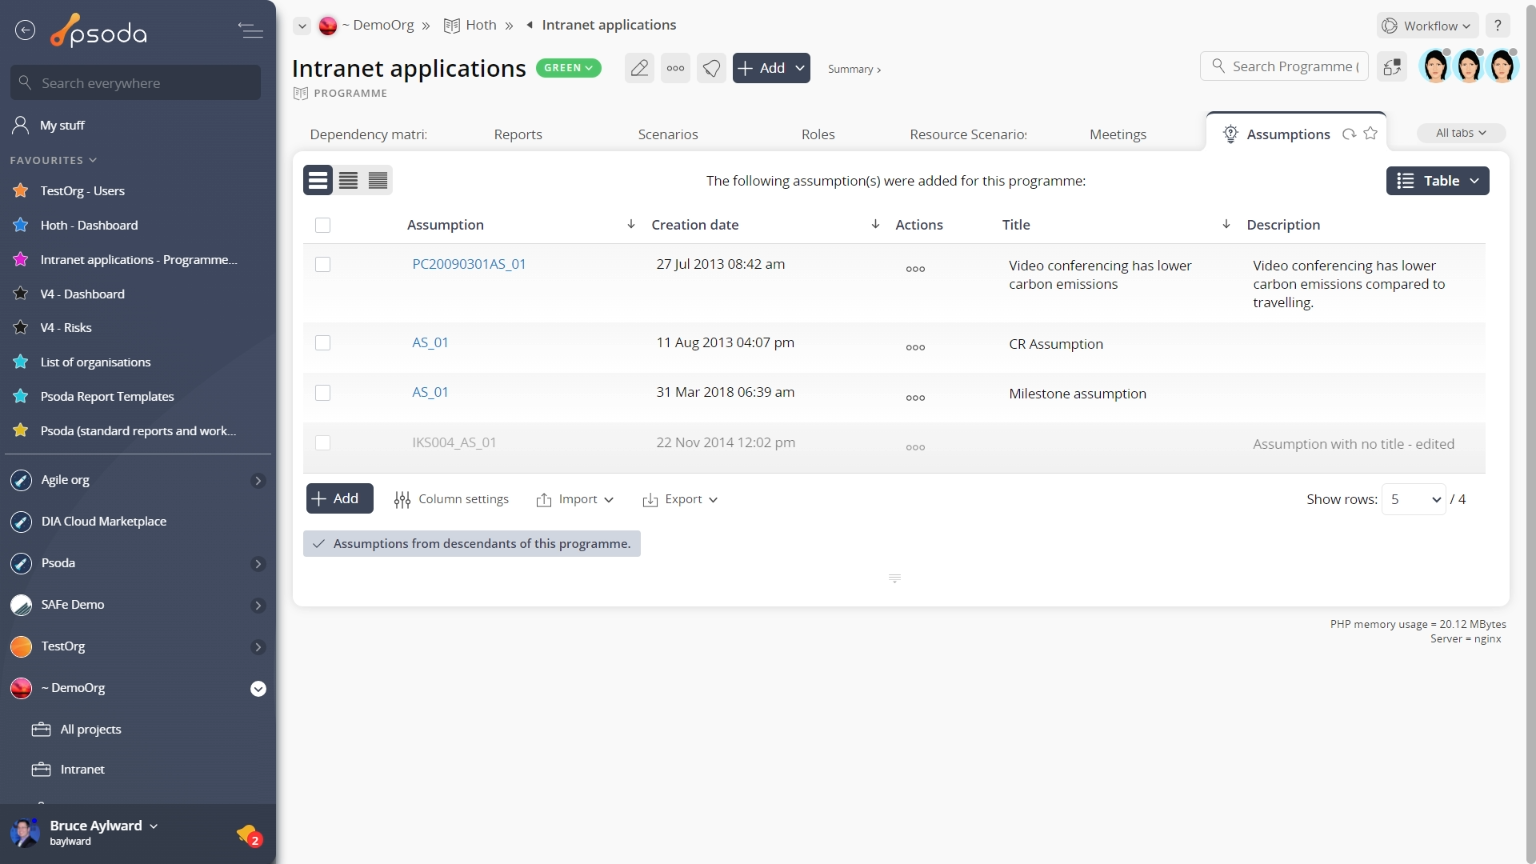
Figure 5 – Programme assumptions tab
Note that you can customise your table view by clicking the Attachments
This tab shows an asset listing of all of the attachments that have been added to this programme, as shown in Figure 6. By default, this table will present you with a number of details about the attachments such as the file’s name, attachment type, view the version and access a download link.
From the Actions column of this attachments table, you can act on individual attachments by 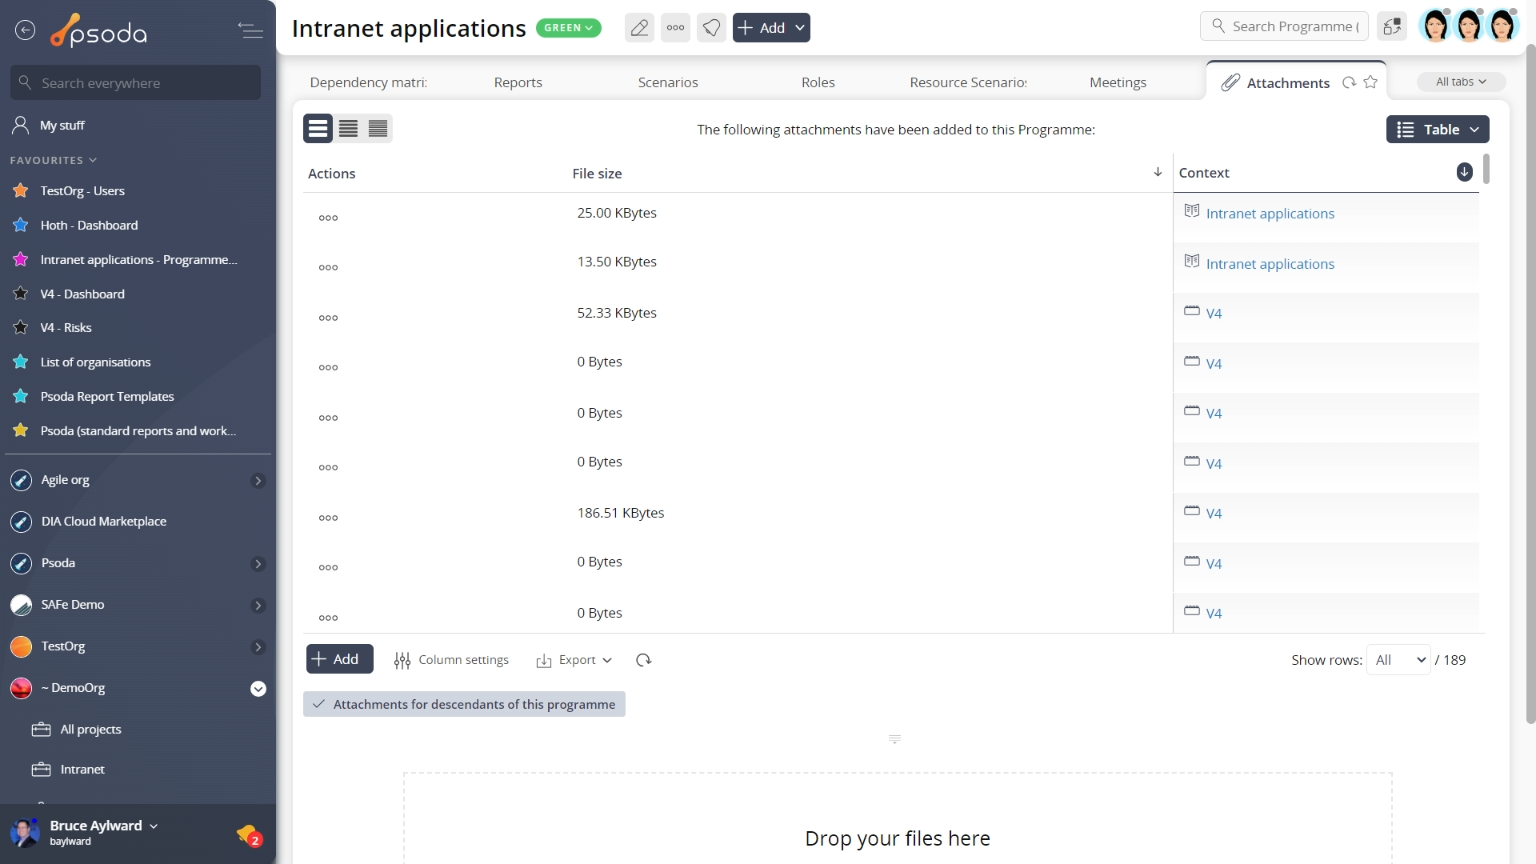
Figure 6 – Programme attachments tab
Note that you can customise your table view by clicking the Benefits
This tab shows an asset listing of all of the benefits defined for this programme, as shown in Figure 7. By default, this table provides measurement information about the benefits listed, it’s title and a progress indicator. From here you may also view the workflow 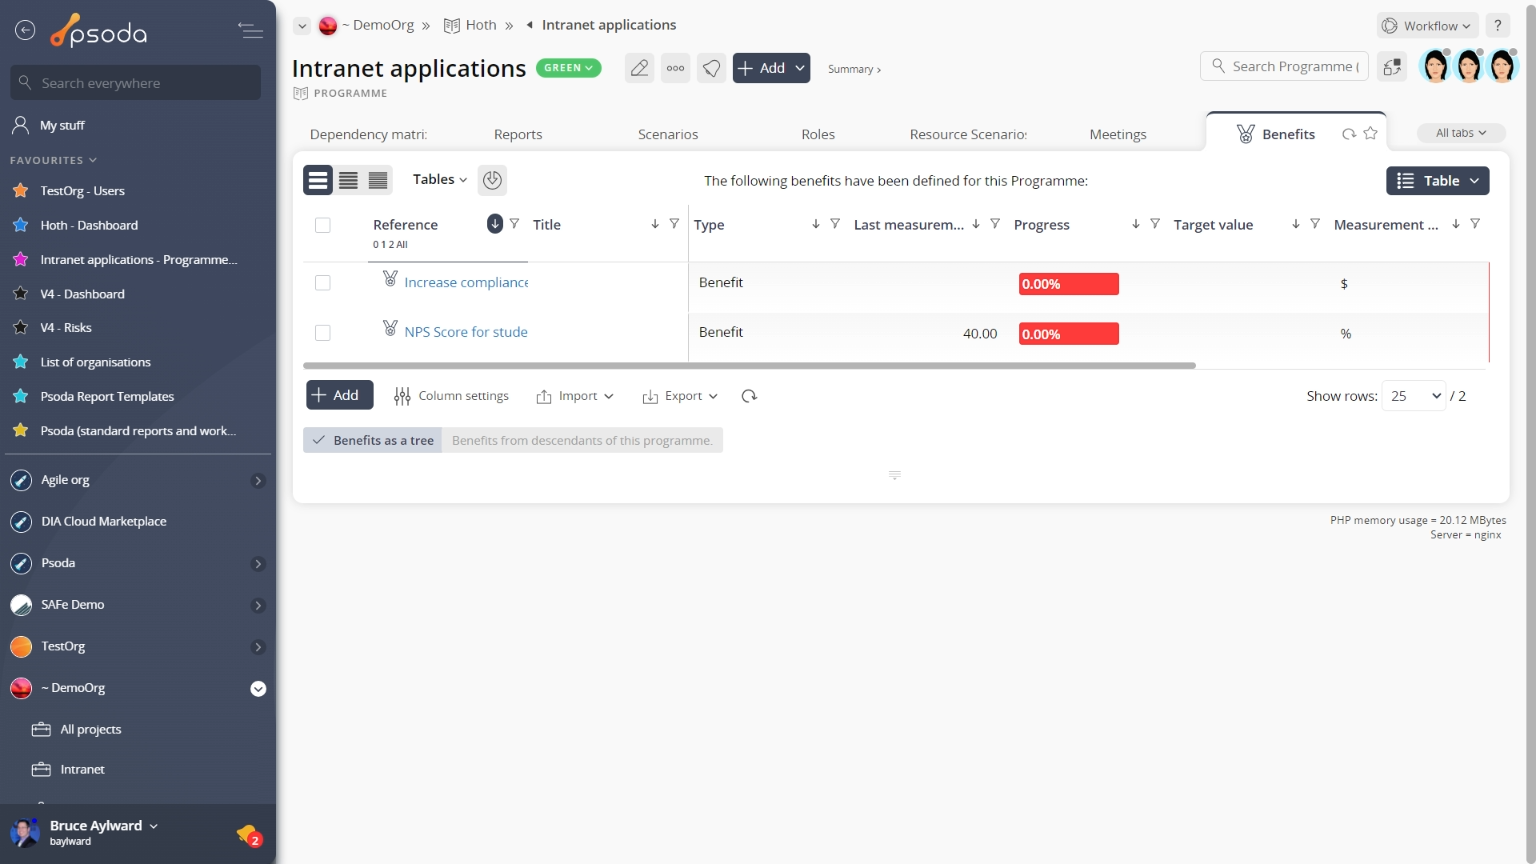
Figure 7 – Programme benefits tab
Note that at the bottom of the table you can ![]() add more benefits, or customise your table view by clicking the
add more benefits, or customise your table view by clicking the ![]() edit button to show or hide certain benefit information, or export this benefit list to
edit button to show or hide certain benefit information, or export this benefit list to ![]() Excel or
Excel or ![]() CSV files.
CSV files.
 Benefit Map
Instead of a table view, this tab provides a graphical view of your benefits. The benefits map is generated from the information you put in the benefits table. Figure 8 below shows an example benefits map:
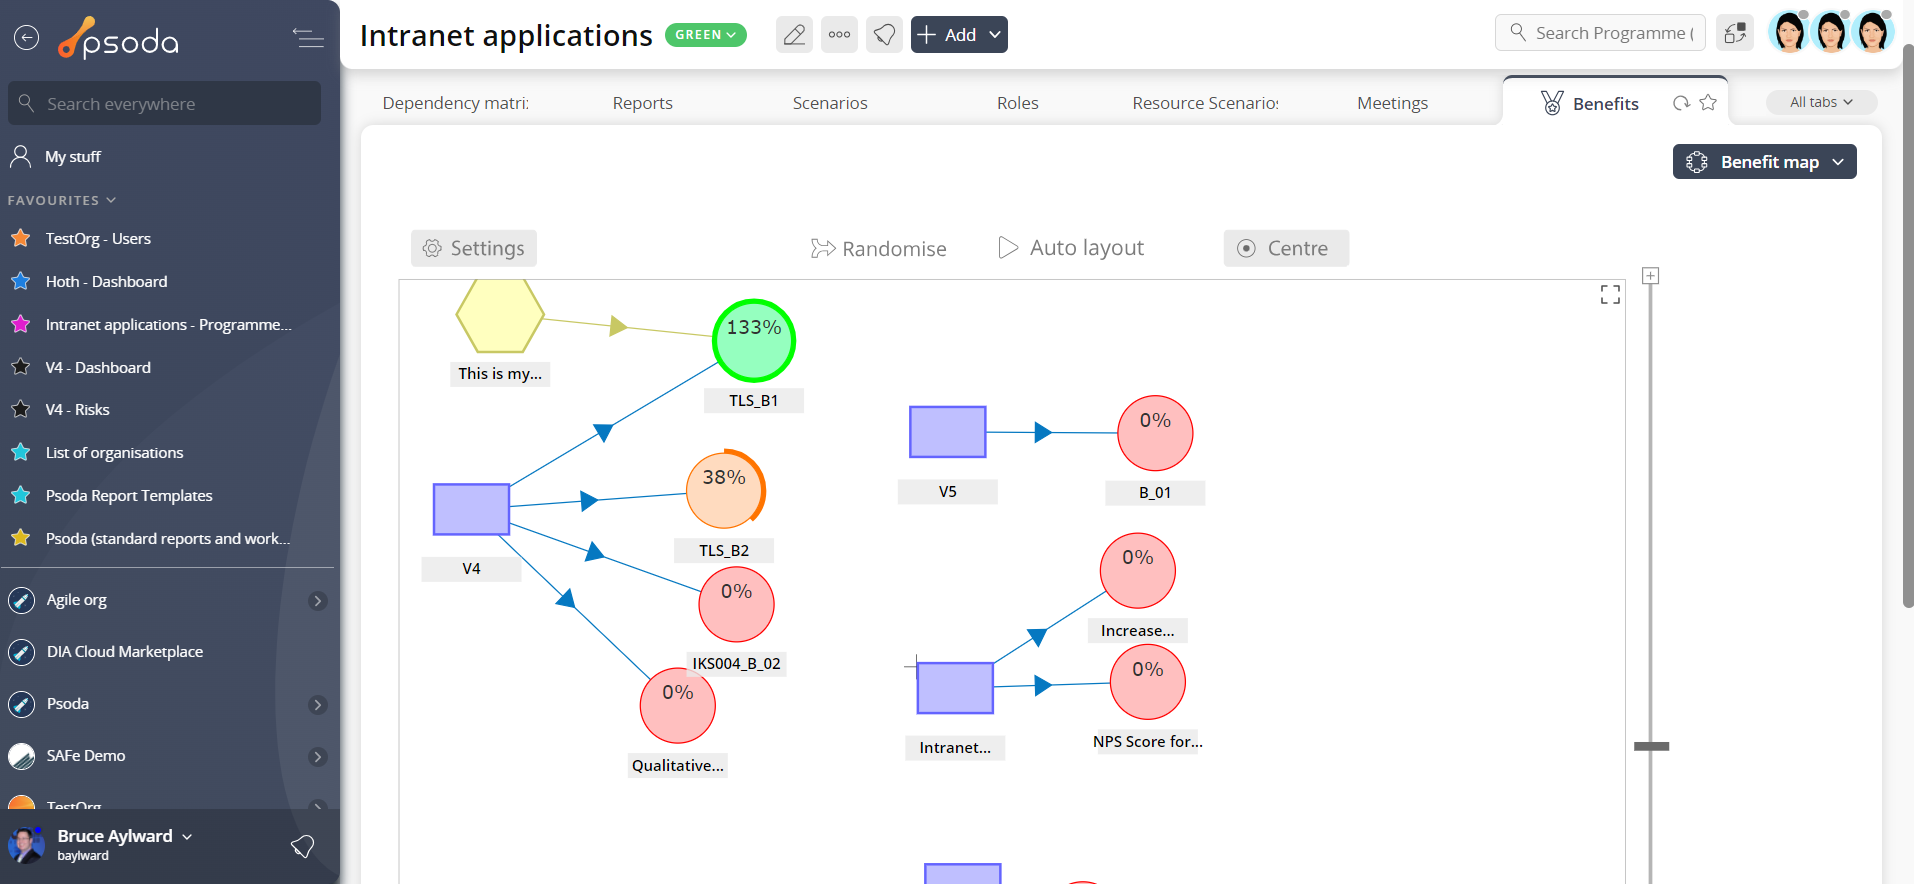 Figure 8 – Programme benefit map
 Budgets
This tab shows an asset listing of all of the budget groups or budget items that have been added to this programme, as shown in Figure 9. By default, this table shows the baseline and actual cost details for this budget or group, together with all of the budget items and sub-groups it contains.
From the Actions column of this attachments table, you can act on individual budget groups by 
Figure 9 – Programme budgets tab
Note that you can customise your table view by clicking the ![]() edit button at the bottom of the budget table or navigate to this same spot to
edit button at the bottom of the budget table or navigate to this same spot to ![]() add more budgets to this programme, or
add more budgets to this programme, or ![]() import a number of budgets from a CSV file. Here, you can also export this list to
import a number of budgets from a CSV file. Here, you can also export this list to ![]() Excel or
Excel or ![]() CSV files.
CSV files.
 Budget Charts
Instead of a table view, this tab provides a graphical view of your accumulated baseline vs. actual over time for the budget groups contained in lower level assets beneath this programme, as shown in Figure 10. The charts are generated from the information in put in the budgets tables at each asset level.
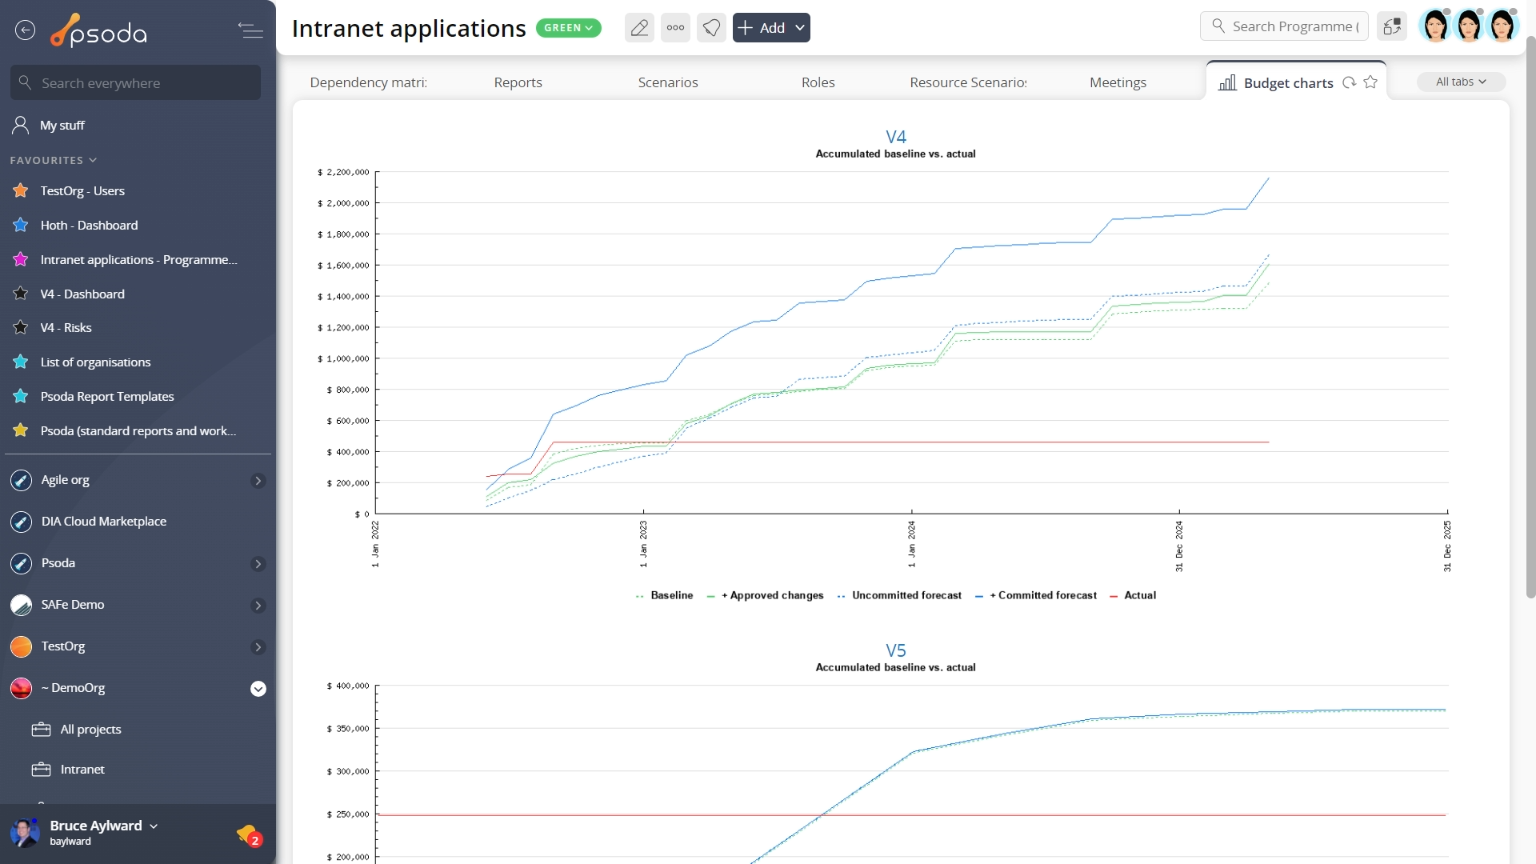
Figure 10 – Programme budget charts tab
If an asset under the programme level, doesn’t have the right information to generate this kind of chart, it’s name will be greyed out and no chart will be displayed.
 Calendar
This tab shows a calendar view, as shown in Figure 11, of the 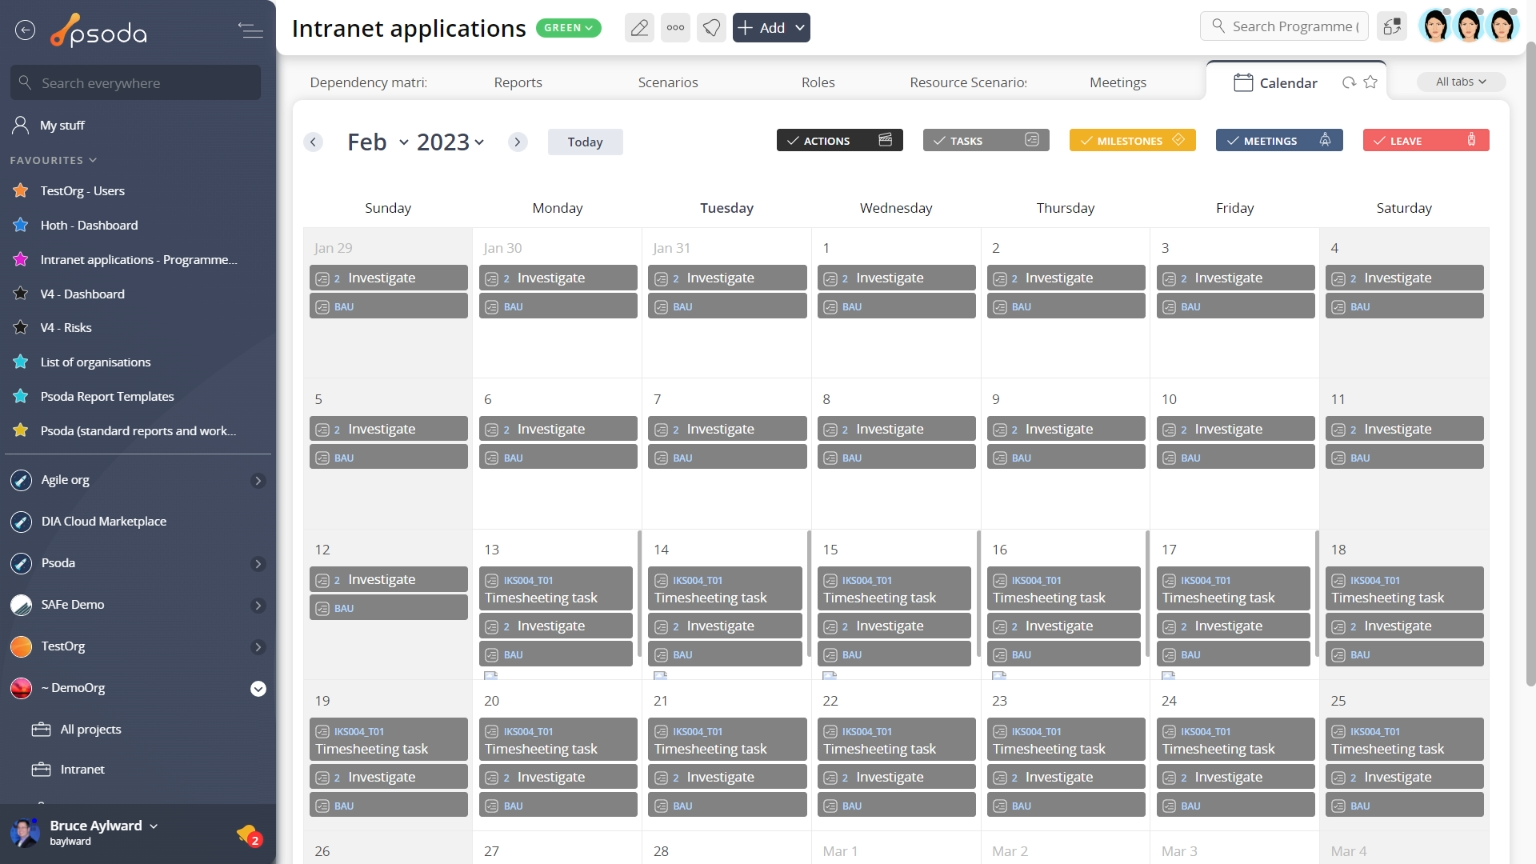
Figure 11 – Programme calendar tab
You can adjust whether you which calendar week you want to view by selecting it in the calendar month on the left-hand side of the tab. You can also customise the layers that are views by selecting or de-selecting the listed layers options in this same location.
 Change requests
This tabbed view provides the change requests table, as shown in Figure 12, listing any change requests that have been added to this programme.
By default you will be presented with the link to view the change request itself, title, category, description, scheduling information, the user who initiated this request, the owner of the request, it’s current state and any actions or workflow transitions that are available.
From this change request listing, you can utilise any of the functions in the Actions column to act on a specific request. These functions may include 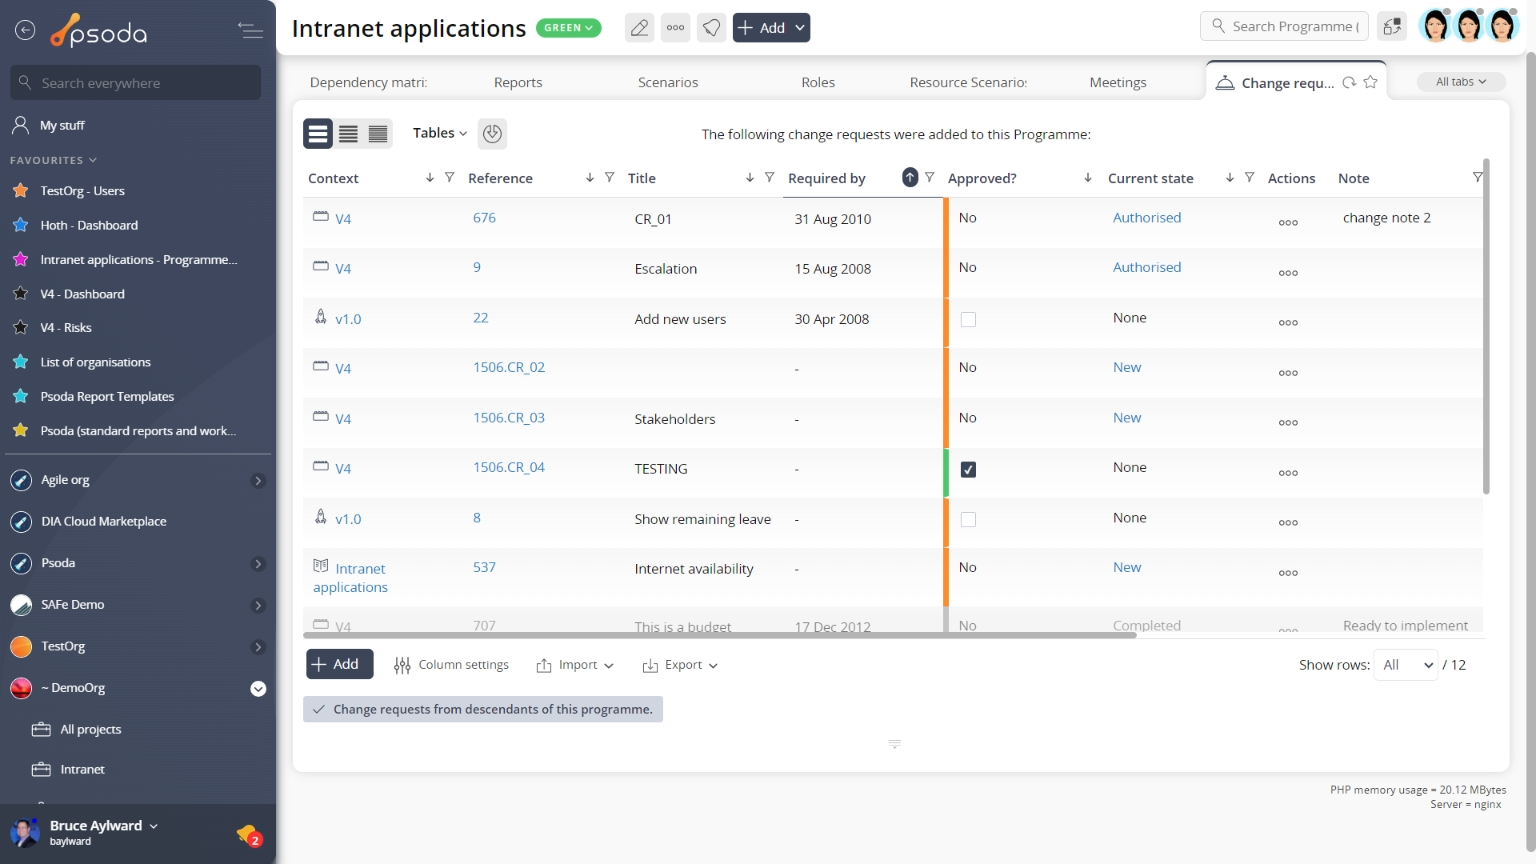 Figure 12 – Programme change requests table
Note that at the bottom of the table you can ![]() add more change requests,
add more change requests, ![]() edit the table columns to show or hide request information, or export this list to
edit the table columns to show or hide request information, or export this list to ![]() Excel or
Excel or ![]() CSV files.
CSV files.
At the very bottom of this tabbed view you may decrease/increase the number of contracts listed by selecting the hide/include change requests for projects and sub-projects link.
Comments
This tab shows an asset listing of all of the comments that 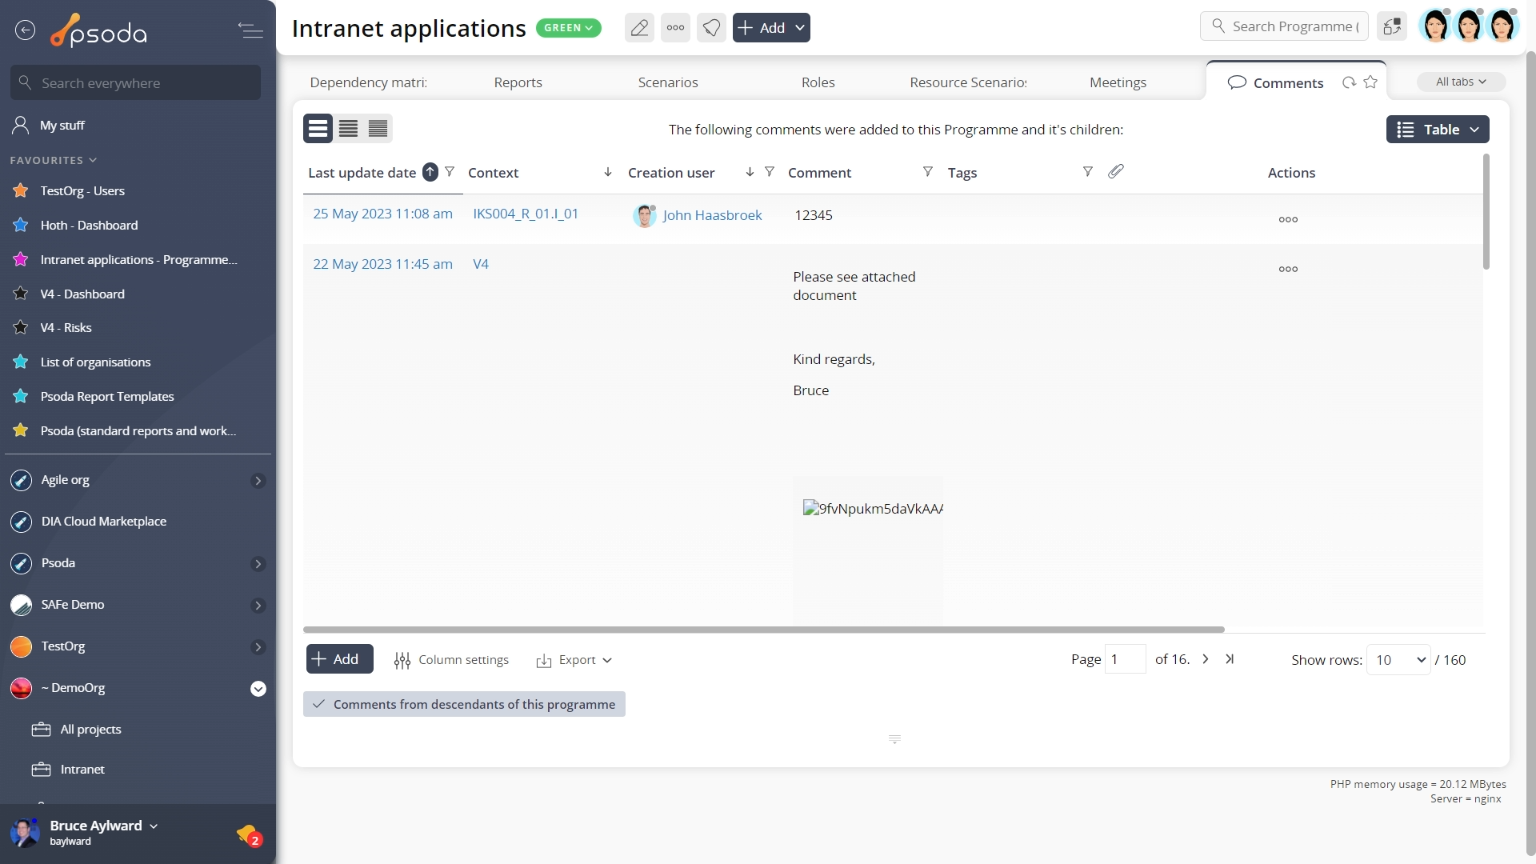
Figure 13 – Programme comments tab
Note that you can customise your table view by clicking the Contracts
This tab shows an asset listing of all of the contracts that have been added to this programme, as shown in Figure 14. By default, this table will present you with a number of details about the contracts such as it’s category, title, description, vendor, start, review and end dates, manager, any attachments or comments and the contract’s current state. If you select the link in the contract column, you will navigate into that contract’s view page.
From the Actions column of this contracts table, you can act on individual contracts by ![]() editing,
editing, ![]() deleting,
deleting, ![]() moving the contract or adding
moving the contract or adding ![]() comments or
comments or ![]() attachments to the chosen contract .
attachments to the chosen contract .
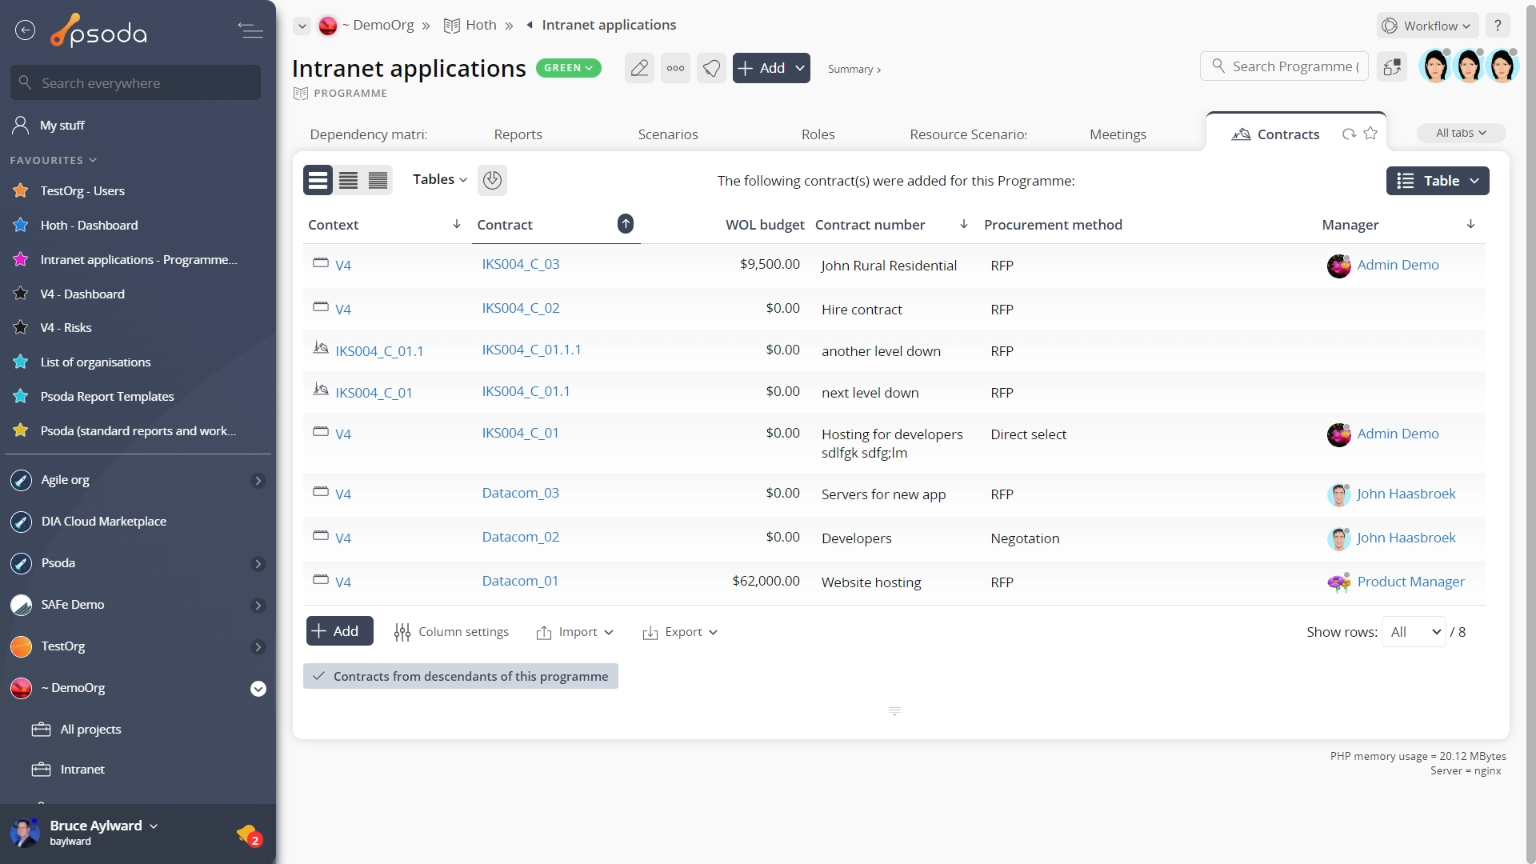
Figure 14 – Programme contracts tab
Note that at the bottom of the table you can  Custom fields
This tab shows an asset listing of all of the custom fields that have been added to this programme, as shown in Figure 15. By default, this table will present you with a number of details about the custom fields such as which section this custom field applies to, it’s title, description, codename and default value, to name a few. If you select the link in the title column, you will navigate into that custom field’s view page.
From the Actions column of this custom fields table, you can act on individual custom fields by 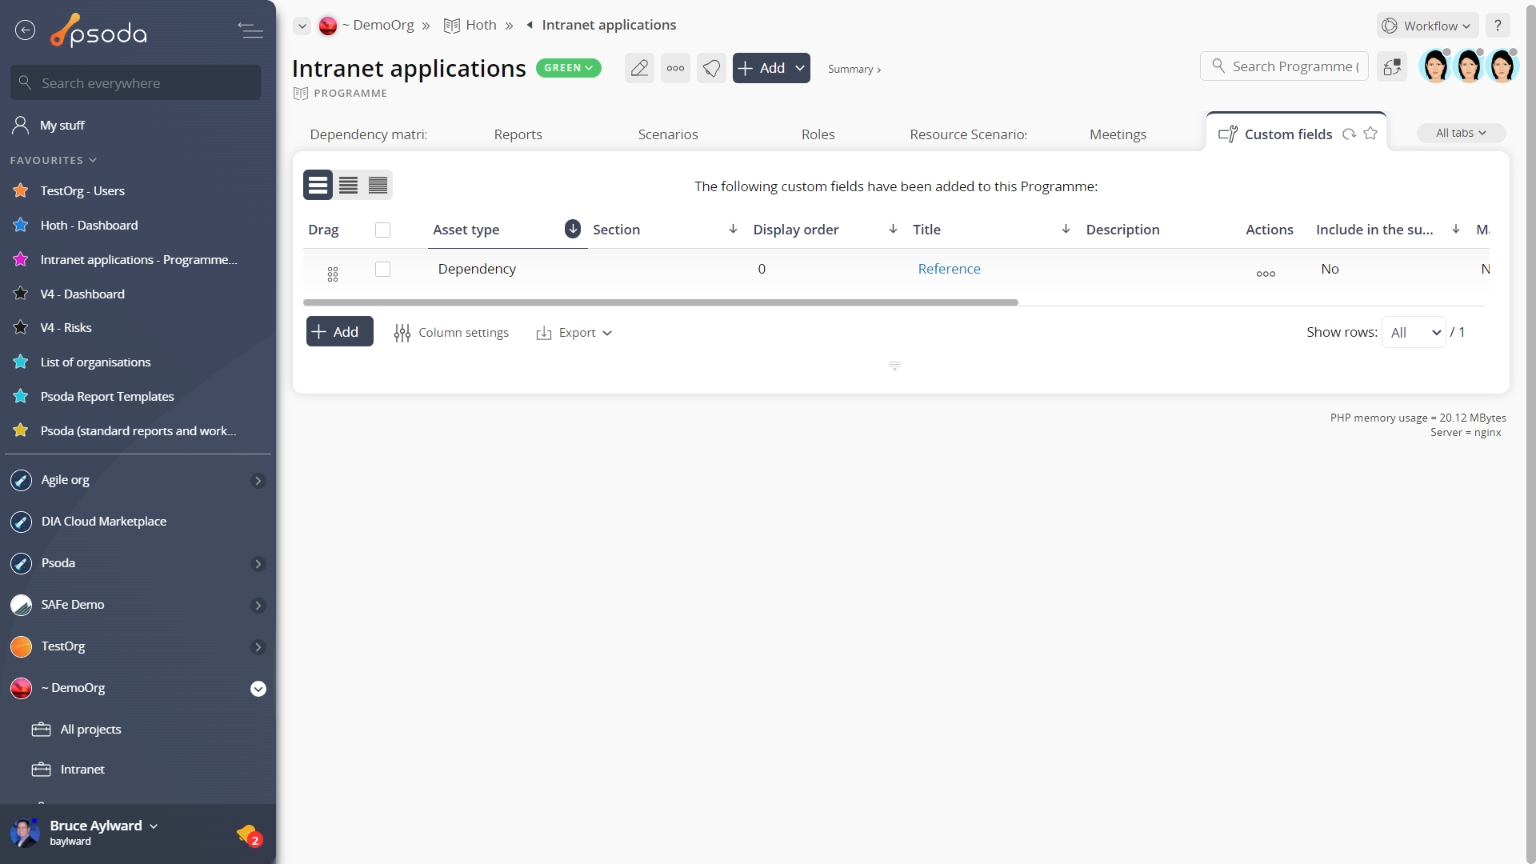
Figure 15 – Programme custom fields tab
Note that at the bottom of the table you can ![]() add more custom fields, or customise your table view by clicking the
add more custom fields, or customise your table view by clicking the ![]() edit button to show or hide certain custom field information, or export this list to
edit button to show or hide certain custom field information, or export this list to ![]() Excel or
Excel or ![]() CSV files.
CSV files.
 Dashboard
This tabbed view will display a collection of customisable dashlets, related to the programme you are currently viewing. In Figure 16 below, our “example programme” has the Financial performance dashlet, Risk progress dashlet and Risk distribution dashlets readily available, to show asset listings of financial performance for the whole programme and provide visual information about risk progress and distribution.
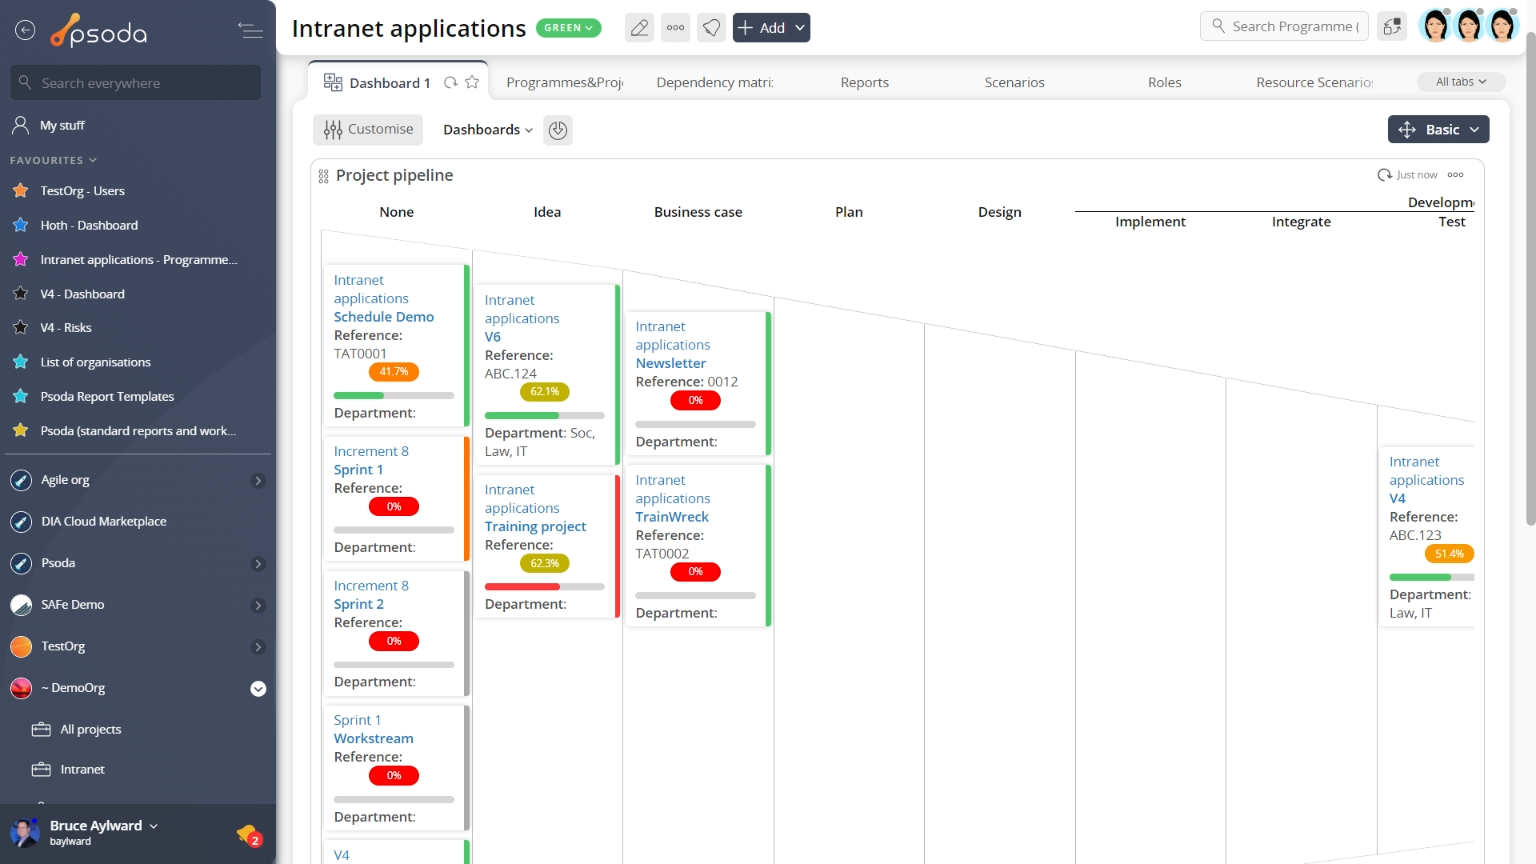
Figure 16 – Programme dashboard tab
You can rearrange the order of you dashboard dashlets by utilising the drag-n-drop function, selecting the title of the dashlet to be moved and dragging it to it’s new position.
You may show or hide any dashlets that you need at a given point in time by selecting the ![]() Customise dashboard link at the very bottom of this tabbed view.
Customise dashboard link at the very bottom of this tabbed view.
 Decisions
This tab shows an asset listing of all of the decisions that have been added to this programme, as shown in Figure 17. By default, this table will present you with a number of details about the decisions such as it’s context, title, description, user’s who agreed to it and it’s current state, to name a few. If you select the link in the decision column, you will navigate into that decision’s view page.
From the Actions column of this custom fields table, you can act on individual custom fields by 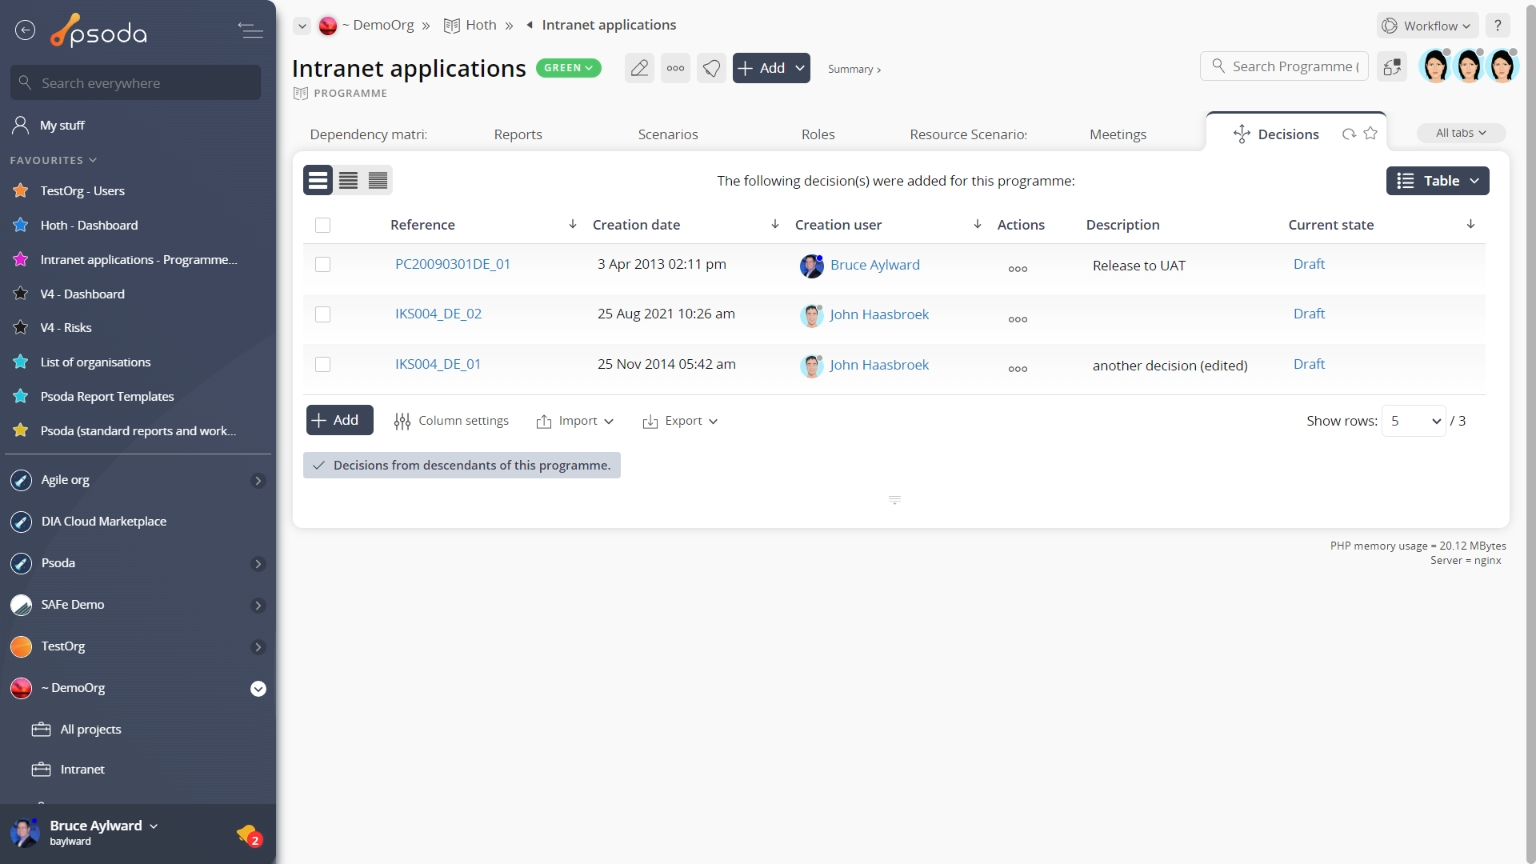
Figure 17 – Programme decisions tab
Note that at the bottom of the table you can ![]() add more decisions manually or
add more decisions manually or ![]() import multiple from a CSV file, or customise your table view by clicking the
import multiple from a CSV file, or customise your table view by clicking the ![]() edit button to show or hide certain information. From here you can also export this list to
edit button to show or hide certain information. From here you can also export this list to ![]() Excel or
Excel or ![]() CSV files.
CSV files.
Defects
This tab shows an asset listing of all of the defects that have been logged for this programme, as shown in Figure 18. By default, this table will present you with a number of details about the defects such as the defect’s number, type, title, severity, priority, current state, date raised, resolve by date and which user this defect is allocated to, to name a few details.
From the Actions column of this defects table, you can act on individual defects by 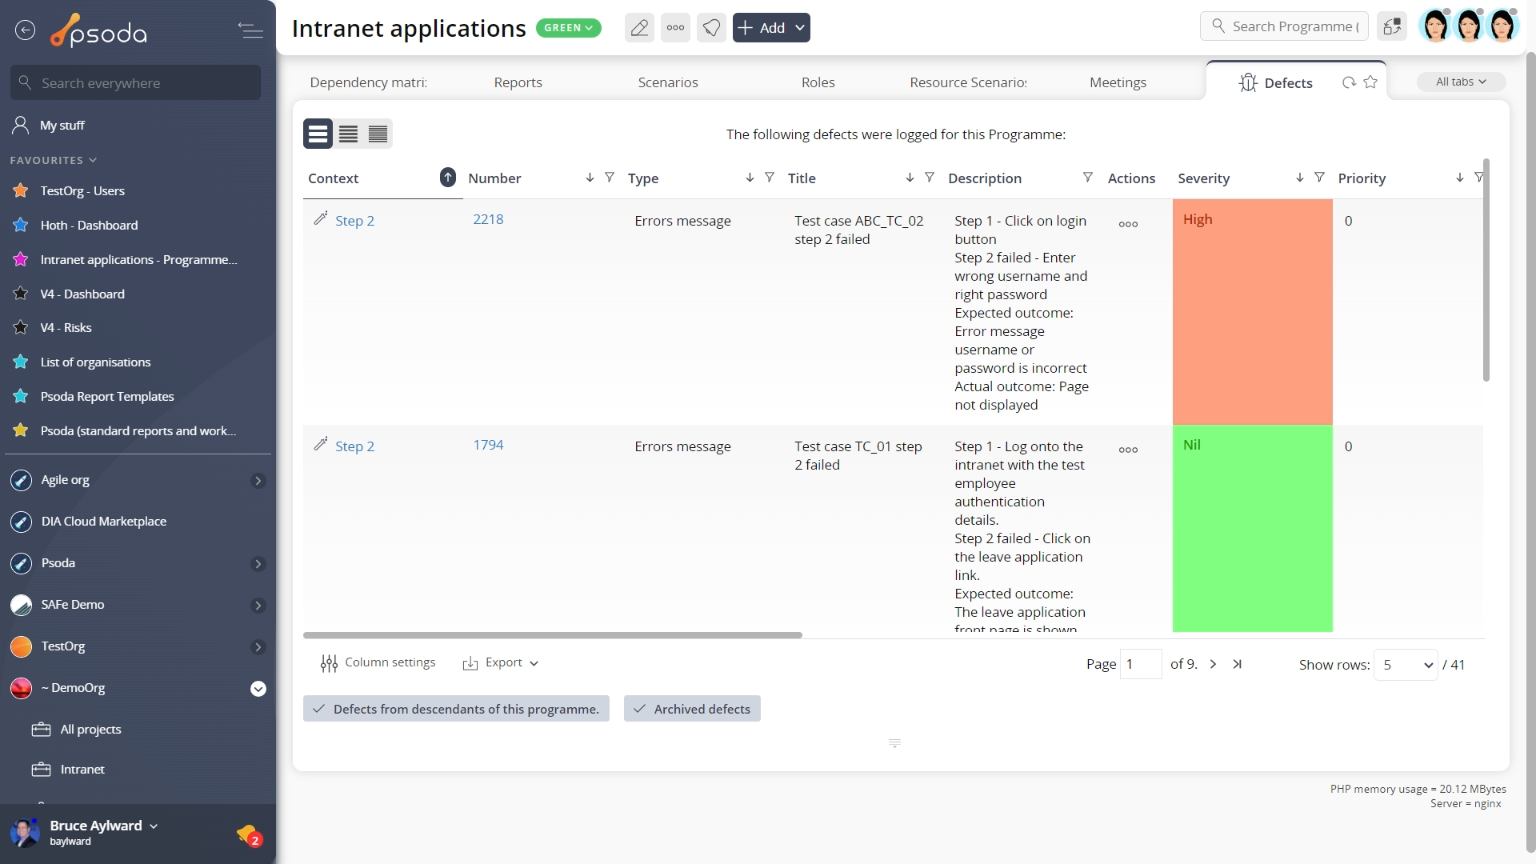
Figure 18 – Programme defects tab
Note that you can customise your table view by clicking the ![]() edit button at the bottom of the defect table. Here, you can also export this list to
edit button at the bottom of the defect table. Here, you can also export this list to ![]() Excel or
Excel or ![]() CSV files.
CSV files.
At the very bottom of this tab you may also be presented with the option to decrease/increase the number of defects listed by selecting the hide/include defects for children of this folder or hide/include archived defects links.
Defects overview
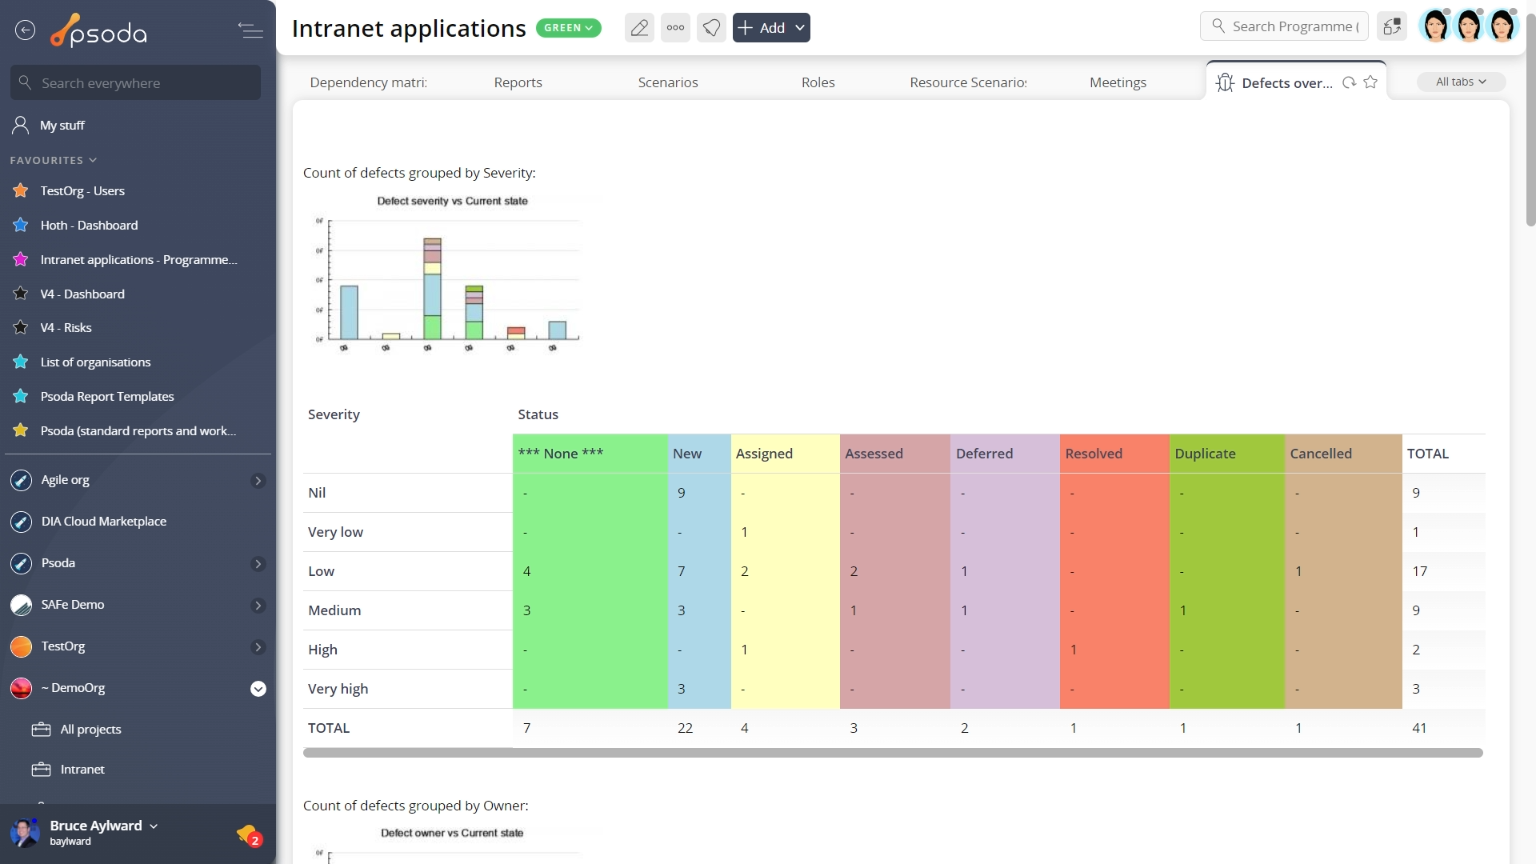
Figure 19 – Programme defects overview tab
Instead of a table view, this tab provides a graphical view of your defects by presenting a number of graphs grouping defects by certain categories, as shown in Figure 19. The defects overview charts are generated by information in the defects tab.
 Deleted assets
This tab shows an asset listing of all of the assets that 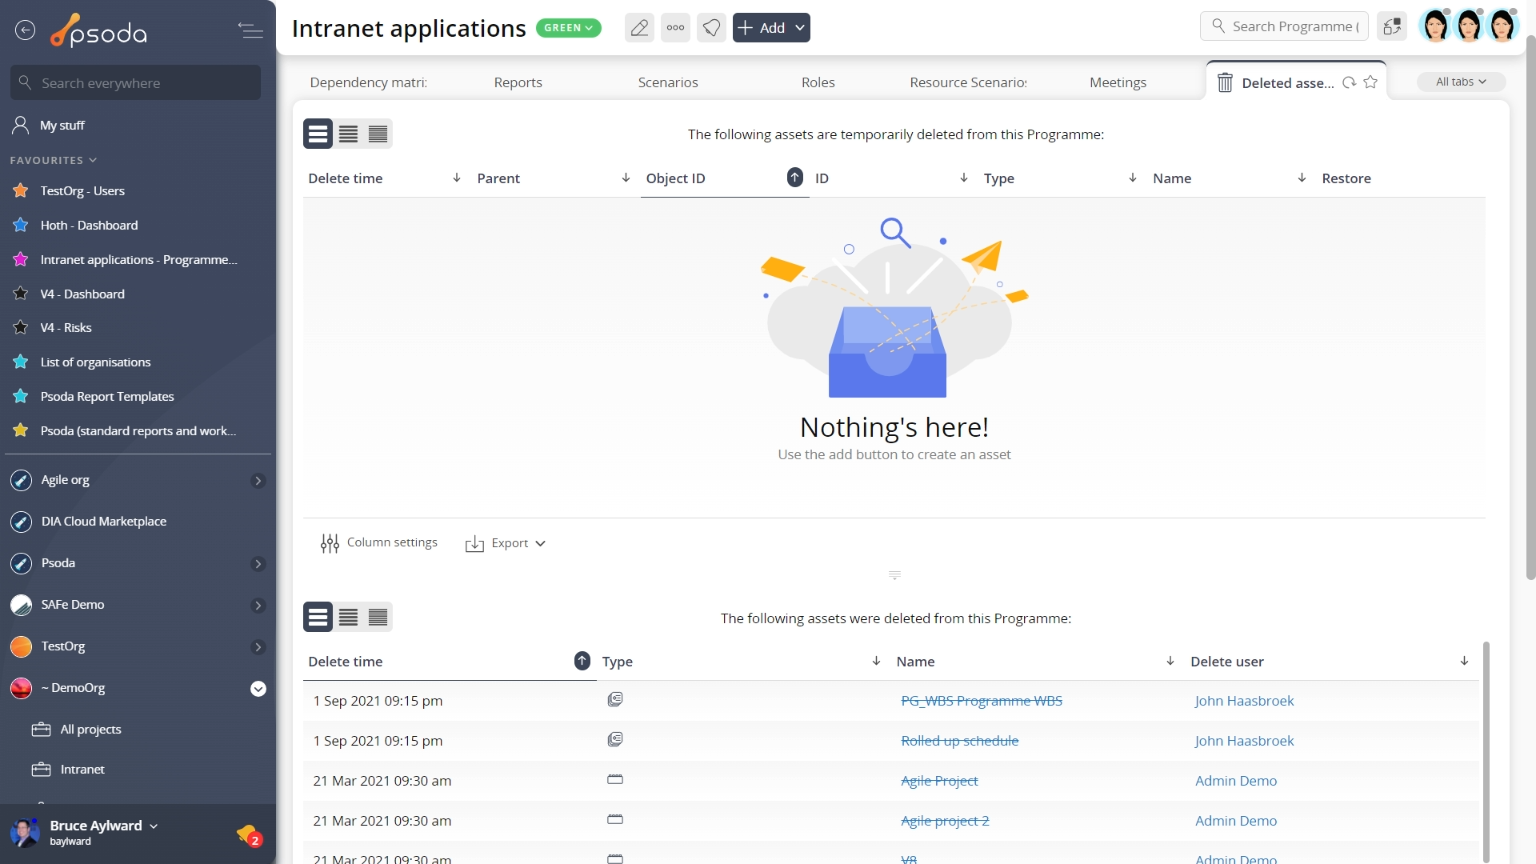
Figure 20 – Programme deleted assets tab
Note that you can customise your table view by clicking the ![]() edit button at the bottom of the tables. Here, you can also export the list to
edit button at the bottom of the tables. Here, you can also export the list to ![]() Excel or
Excel or ![]() CSV files.
CSV files.
Dependencies
This tab shows an asset listing of all of the dependencise that have been defined for this programme, as shown in Figure 21. By default, this table will present you with a number of details about the dependencies such as the it’s description, impact and change flags. If you click the link under the dependent column, you will navigate into the selected dependent’s view page.
From the Actions column of this defects table, you can act on individual defects by 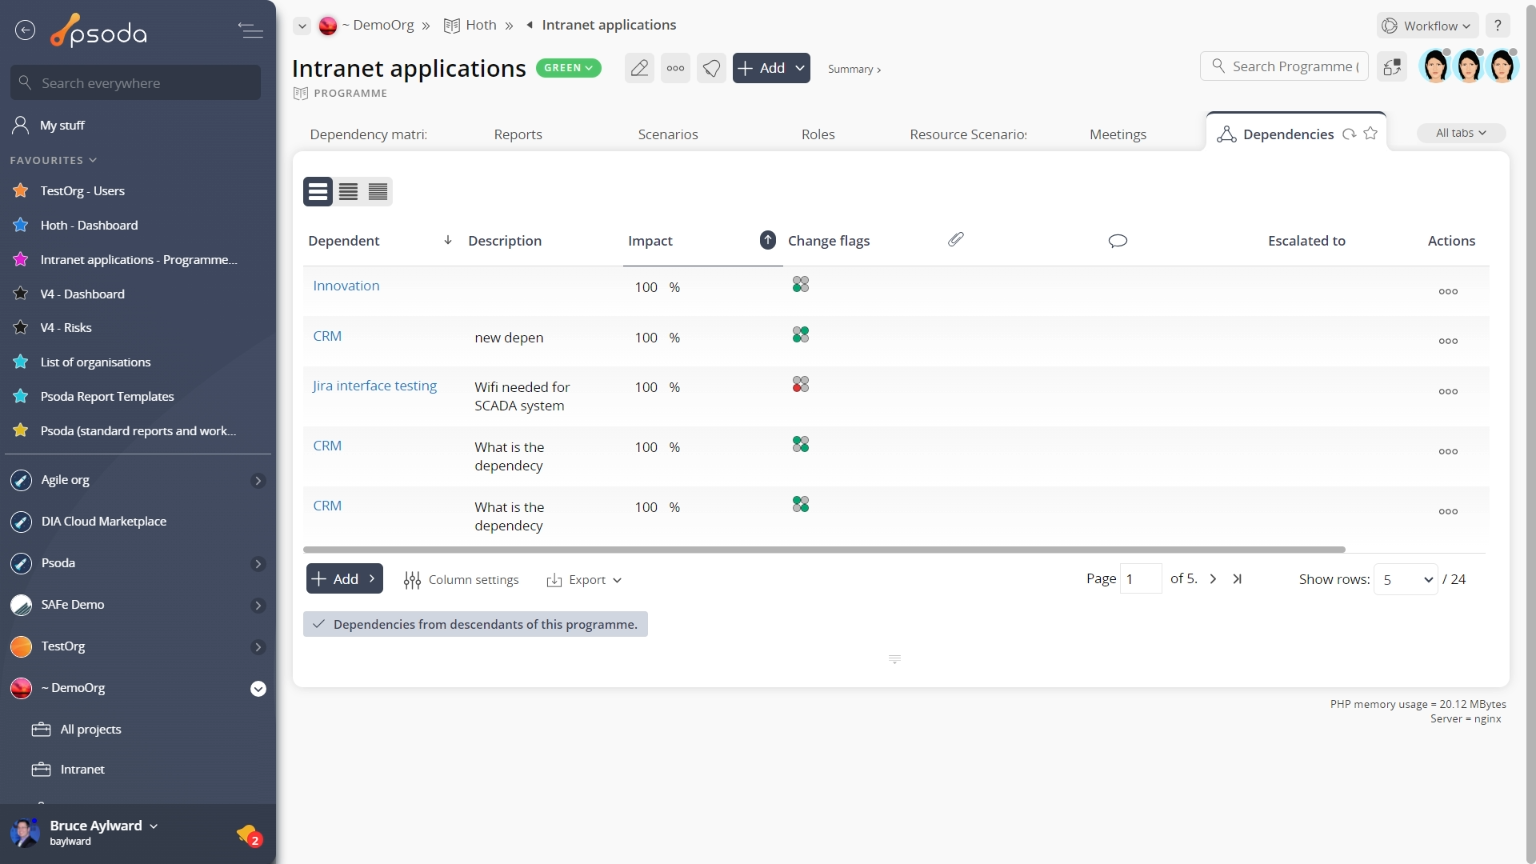
Figure 21 – Programme dependencies tab
Note that at the bottom of the table you can ![]() add more dependencies manually or
add more dependencies manually or ![]() import multiple from a CSV file, or customise your table view by clicking the
import multiple from a CSV file, or customise your table view by clicking the ![]() edit button to show or hide certain information. From here you can also export this list to
edit button to show or hide certain information. From here you can also export this list to ![]() Excel or
Excel or ![]() CSV files.
CSV files.
Dependency Matrix
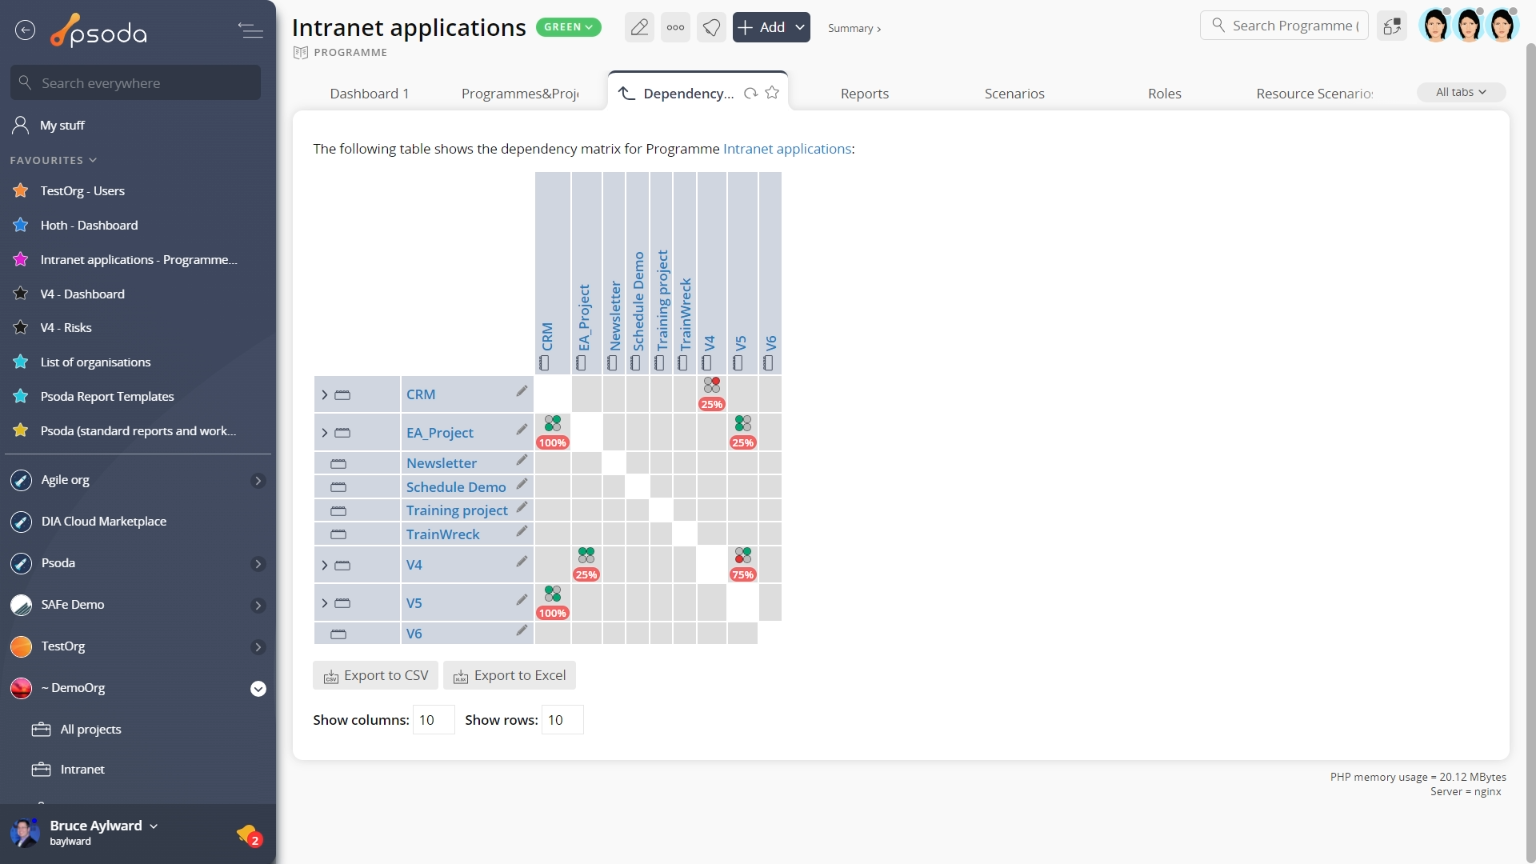
Figure 22 – Programme dependency matrix tab
This tab shows the dependency matrix for the selected programme, as shown in Figure 22. You can show more or less information by selecting the ![]() expand or
expand or ![]() collapse icons next to each asset that allows for this. This is a useful way of assessing
collapse icons next to each asset that allows for this. This is a useful way of assessing ![]() dependencies between a number of assets throughout the whole programme.
dependencies between a number of assets throughout the whole programme.
Details
This tab shows the details for the selected programme including visual presentations of number of risks, issues and defects, the programme’s description, code, and other scheduling information in radar charts, as seen in Figure 23.
Figure 23 – Programme details tab
The majority of the information displayed in this view is read-only, with the exception of the description, programme code and project reference template, which may allow for inline editing although these permissions may be linked to your access rights. If you feel that you should have access to some of these permissions, contact your System Administrator.
 Exceptions
This tab shows an asset listing of all of the exceptions that have been added to this programme, as shown in Figure 24. By default, this table shows the exception’s title, description and consequences, as well as any recommendations and who created the exception. If you click on the link in the reference column, you will navigate into the selected exception’s view page.
From the Actions column of this exceptions table, you can act on individual exceptions by 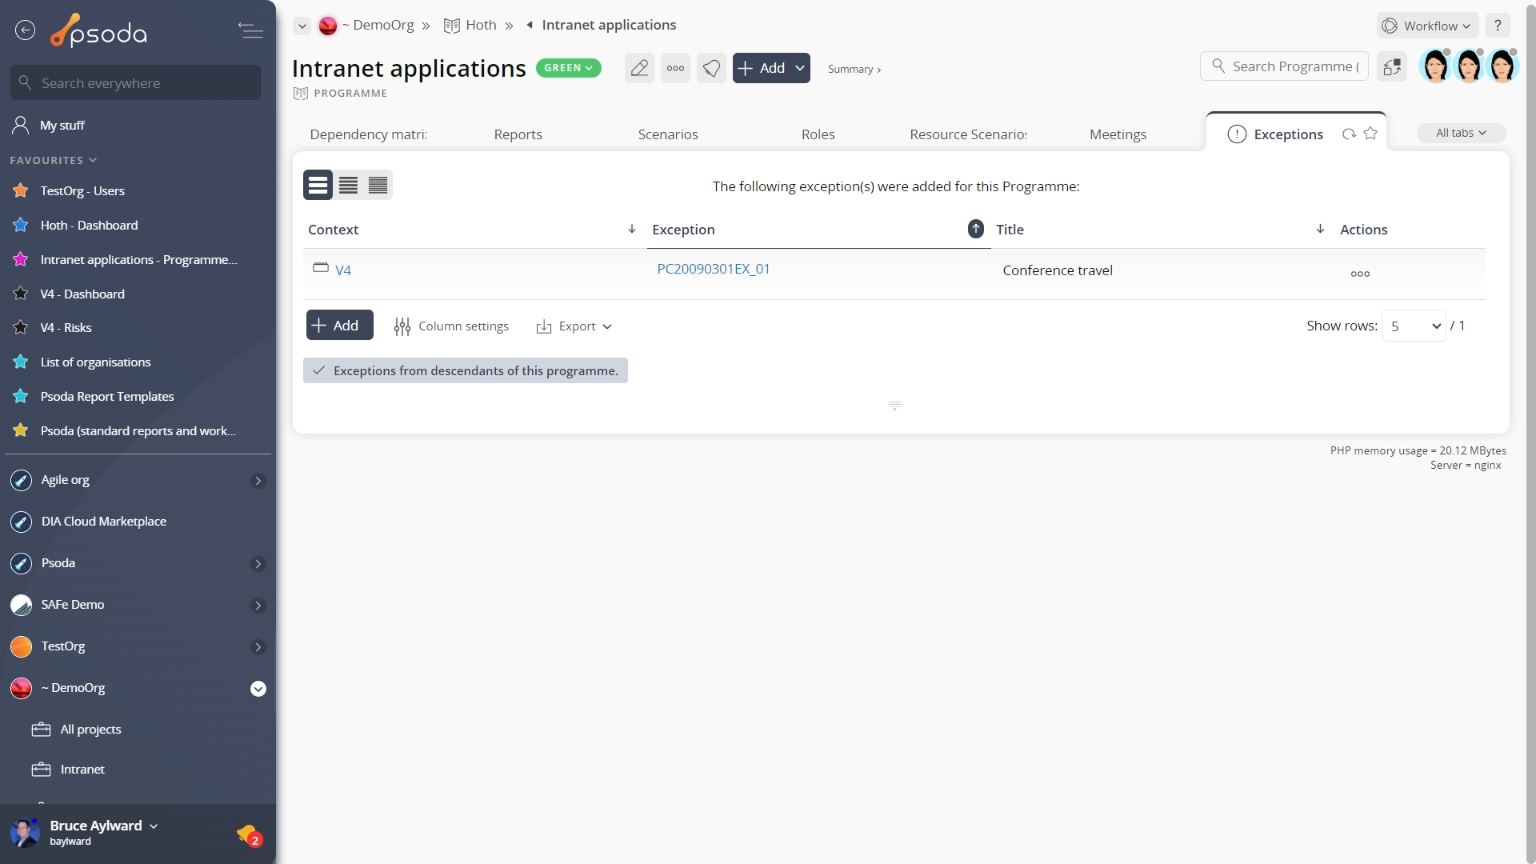
Figure 24 – Programme exceptions tab
Note that you can customise your table view by clicking the ![]() edit button at the bottom of the exceptions table or navigate to this same spot to
edit button at the bottom of the exceptions table or navigate to this same spot to ![]() add more exceptions to this programme. Here, you can also export this list to
add more exceptions to this programme. Here, you can also export this list to ![]() Excel or
Excel or ![]() CSV files.
CSV files.
Expenses
This tab an asset listing of all of the expenses logged for this programme, as shown in Figure 25. By default, this table shows the budget item that this expense item is associated with, the reference, description, date, date of payment as well amount including and excluding tax information. The number of comments and attachments added to an expense item is also indicated in this view.
The Actions column of the expenses table provides accessible functions to act on a chosen expense item. These functions include 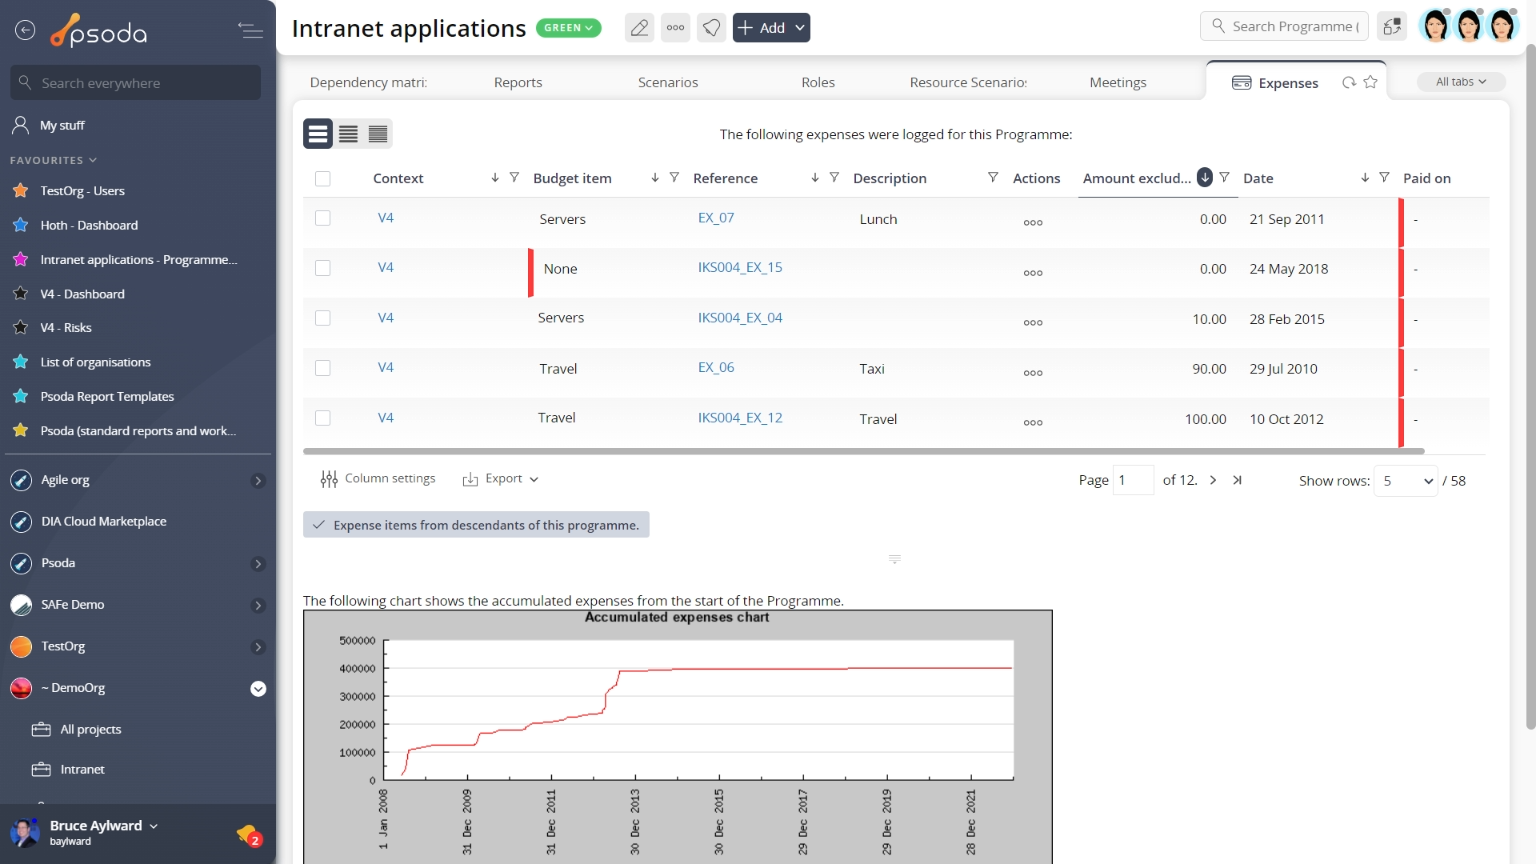 Figure 25 – Programme expenses tab
A chart at the bottom of this tabbed view will also visually show you the accumulated expenses from the start of this programme.
Note that you can customise your table view by clicking the ![]() edit button at the bottom of the expenses table or navigate to this same spot to
edit button at the bottom of the expenses table or navigate to this same spot to ![]() add more expense items to this programme manually, or you can
add more expense items to this programme manually, or you can ![]() import multiple expenses from a CSV file. Here, you can also export this list to
import multiple expenses from a CSV file. Here, you can also export this list to ![]() Excel or
Excel or ![]() CSV files.
CSV files.
 GANTT
GANTT
This tabbed view shows the GANTT chart shown in Figure 26, generated by the information in your Schedule tab. By default, this table shows the name of the task group, task or milestone and it’s start and end dates.
On the right-most side of the chart there is a breakdown of tasks in a visual format than will span across a monthly, weekly or daily scale (this is setting dependent). The users who are allocated to each asset will have their names written next to this asset’s timeline.
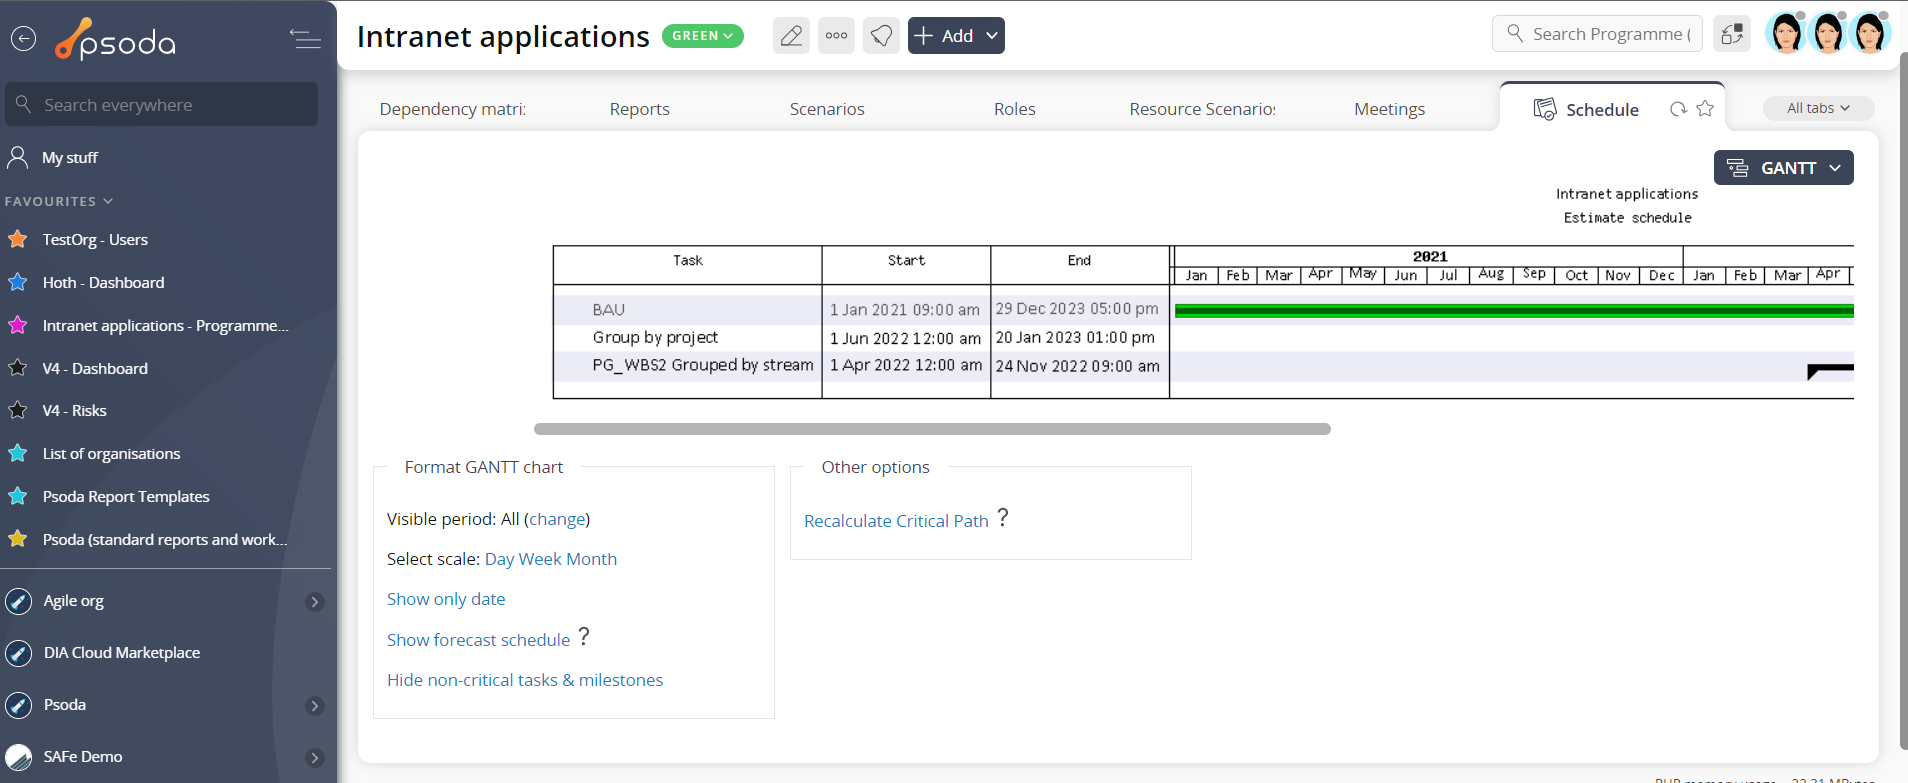
Figure 26 – Programme GANTT chart
At the very bottom of this tabbed view you are presented with a number of table information formatting options which will adjust the GANTT’s visible period, or scale, or whether it displays more than just task dates.In addition, the view tasks & milestones link will navigate to the Schedule tabbed view so that you can expand or contract the work breakdown structure viewed in the GANTT.
Interactive GANTT
This tab shows the interactive GANTT chart shown in Figure 27, generated by the information in your Schedule tab of the change request. By default, this table shows the name of the task group, task or milestone and it’s start and end dates.
On the right-most side of the chart we have a breakdown of tasks in a visual format than will span across a monthly, weekly or daily scale (this is setting dependant). The users who are allocated to each asset will have their names written next to this asset’s timeline.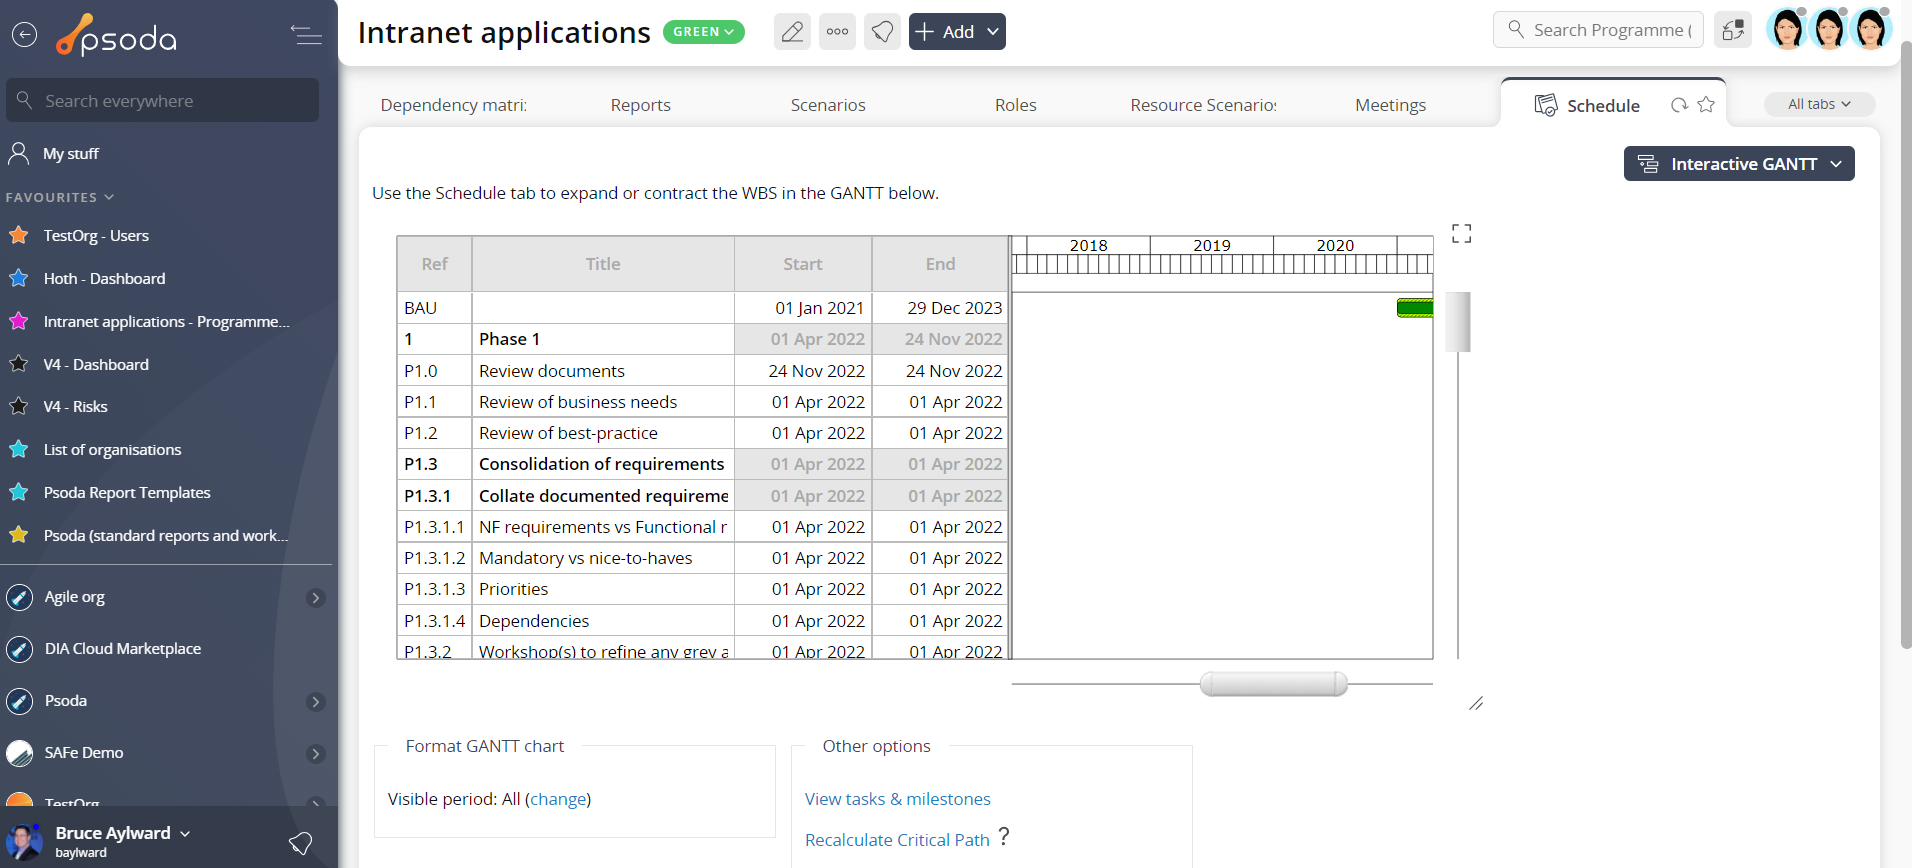
Figure 27 – Programme interactive GANTT tab
At the very bottom of this tabbed view you are presented with a number of table information formatting options which will adjust the GANTT’s visible period, or scale, or whether it displays more than just task dates.In addition, the view tasks & milestones link will navigate to the Schedule tab so that you can expand or contract the work breakdown structure viewed in the GANTT.
 Issues
This tabbed view shows the issues table as seen in Figure 28, listing any issues that have been logged for this programme. By default, this table provides impact and priority information, plan progress and resolution dates for the issues listed, as well as any actions that can be taken. The workflow column also provides information as to the next workflow transitions available.
The Actions column of the issues table provides accessible functions to act on a chosen issue. These functions include 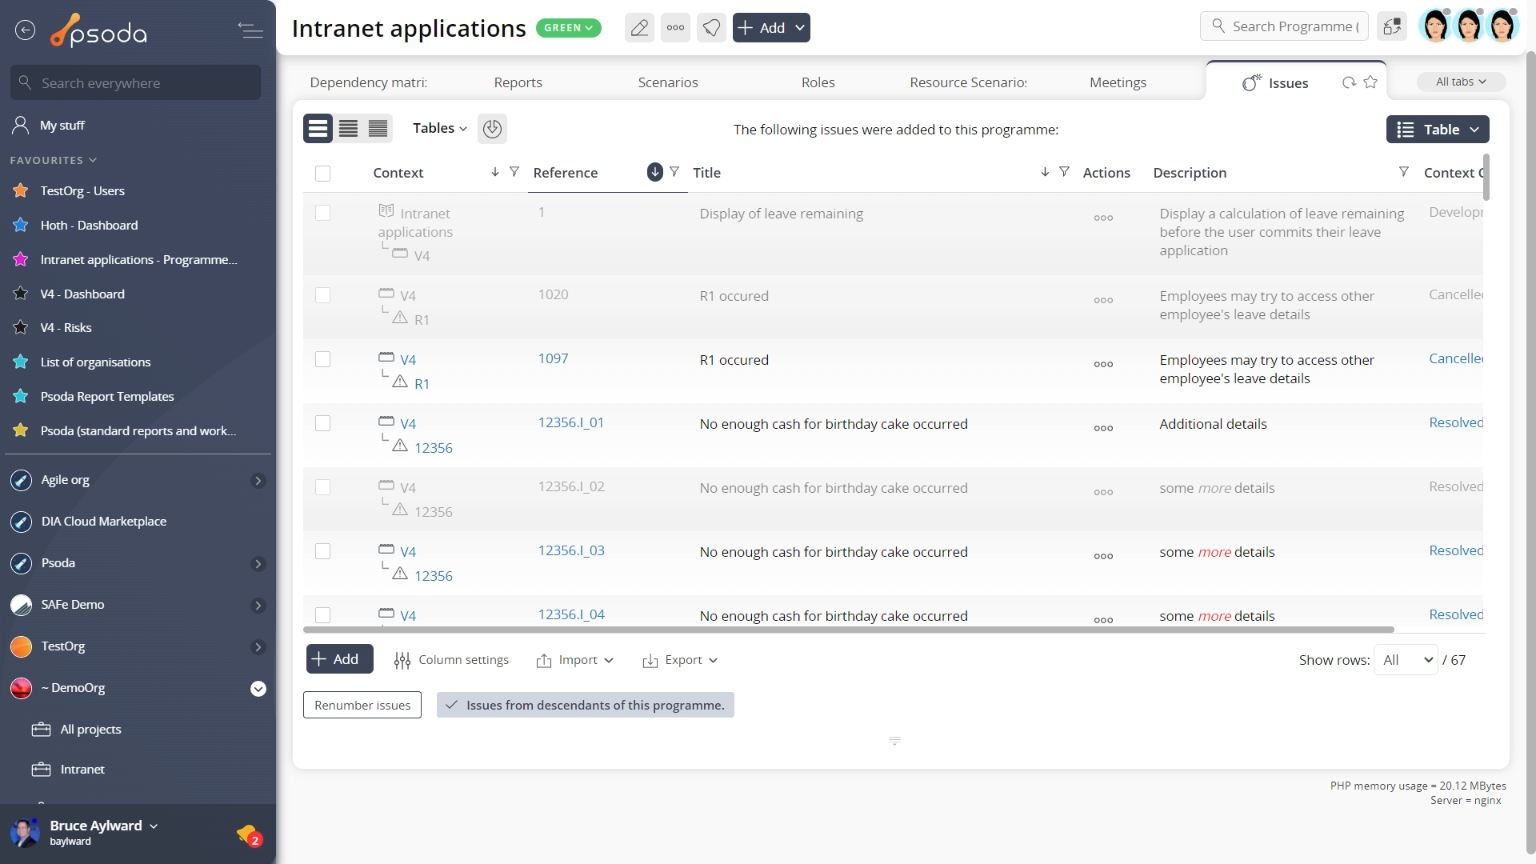
Figure 28 – Programme issues tab
Note that at the bottom of the table you can Lessons
This tabbed view shows the issues table as seen in Figure 29, listing any lessons that have been added for this programme. By default, this table provides a link into a selected lesson itself, as well as providing other information such as the lesson title, description and context. The workflow column also provides information as to the next workflow transitions available, if a workflow has been selected upon lesson creation.
The Actions column of the lessons table provides accessible functions to act on a chosen issue. These functions include 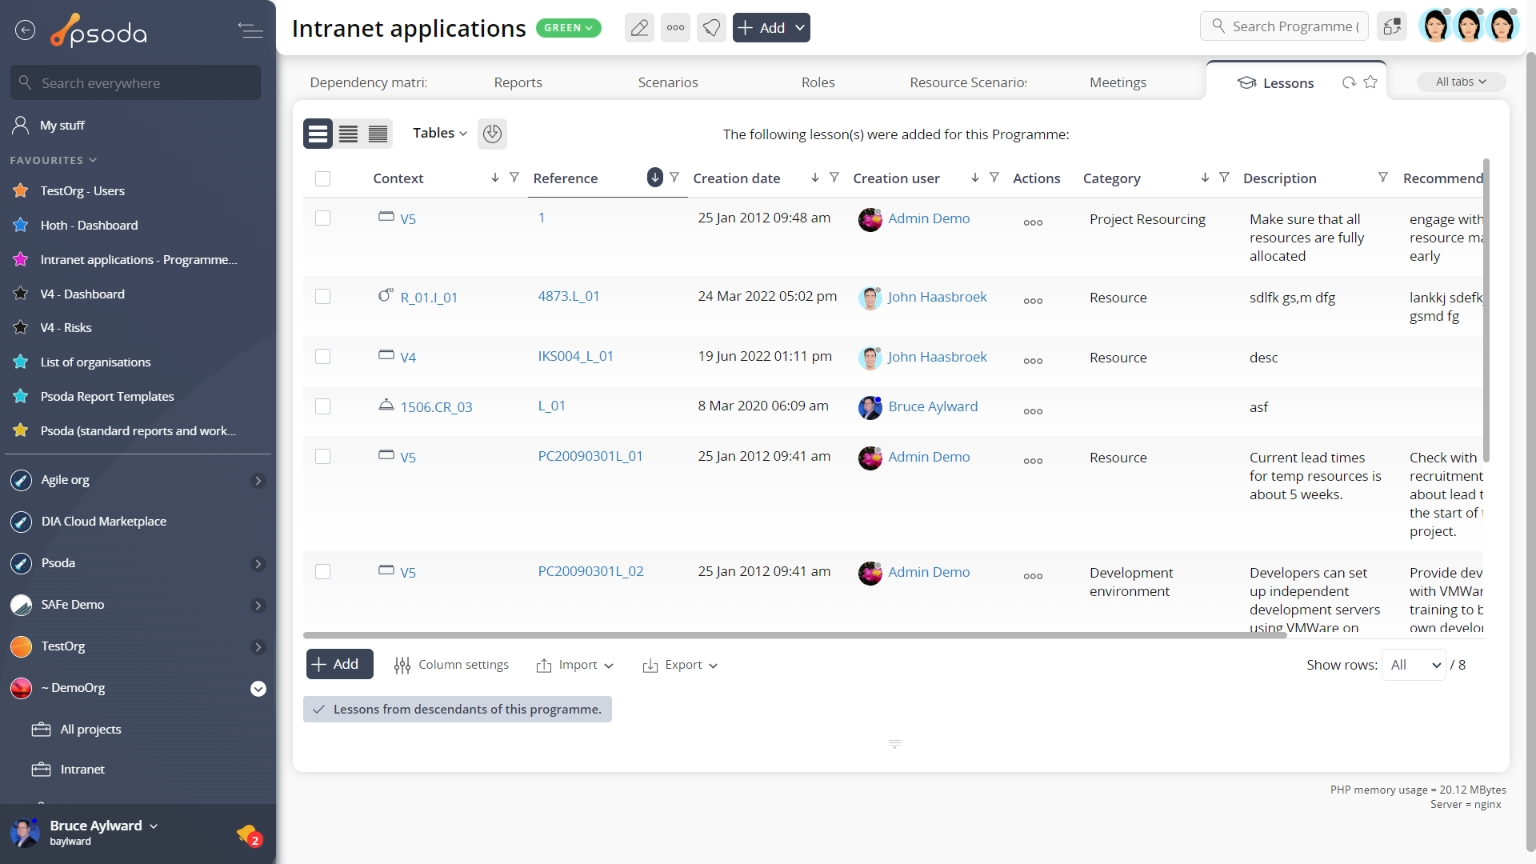 Figure 29 – Programme lessons tab
Milestones
This tab shows an asset listing of all of the whiteboards that have been added to this programme, as shown in Figure 30. By default, this table will present you with a number of details about the whiteboards such as it’s context, title, description, type, the user who created this whiteboard and it’s current state. If you click on the link beneath the whiteboard column, you will navigate to the selected whiteboard’s view page.
From the Actions column of this whiteboards table, you can act on individual whiteboard by 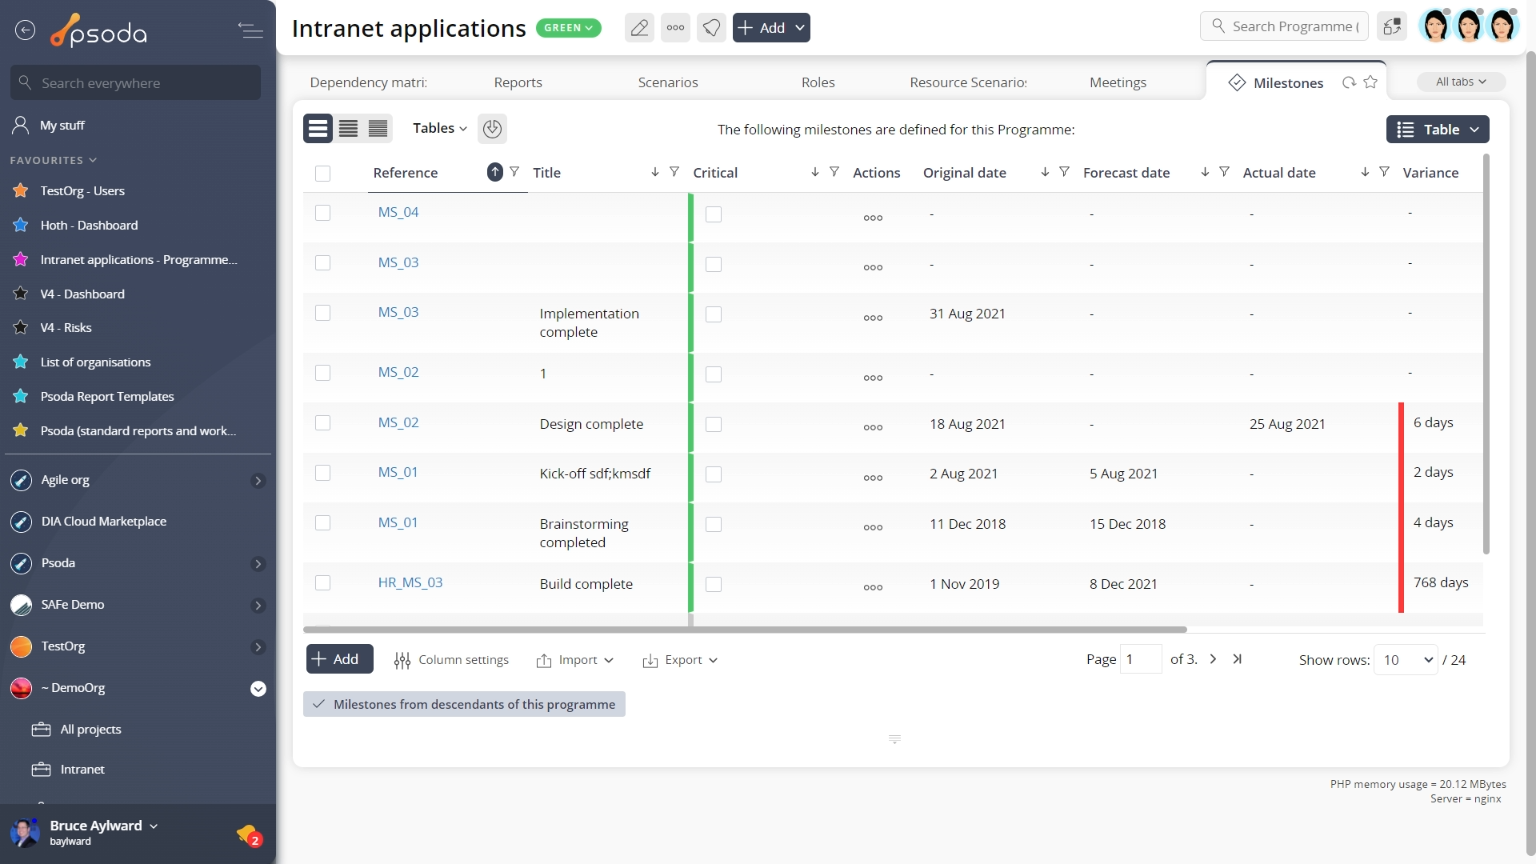
Figure 30 – Programme milestones tab
Note that you can customise your table view by clicking the ![]() edit button at the bottom of the milestones table or navigate to this same spot to
edit button at the bottom of the milestones table or navigate to this same spot to ![]() add more milestones to this programme manually or
add more milestones to this programme manually or ![]() import multiple from a CSV file. Here, you can also export this list to
import multiple from a CSV file. Here, you can also export this list to ![]() Excel or
Excel or ![]() CSV files.
CSV files.
Products
This tabbed view shows the products table as seen in Figure 31, listing any products that have been registered for this programme. By default, this table shows the name and any workflow that may have been applied to any of the containing products, as well as any actions that can be taken on a chosen portfolio.
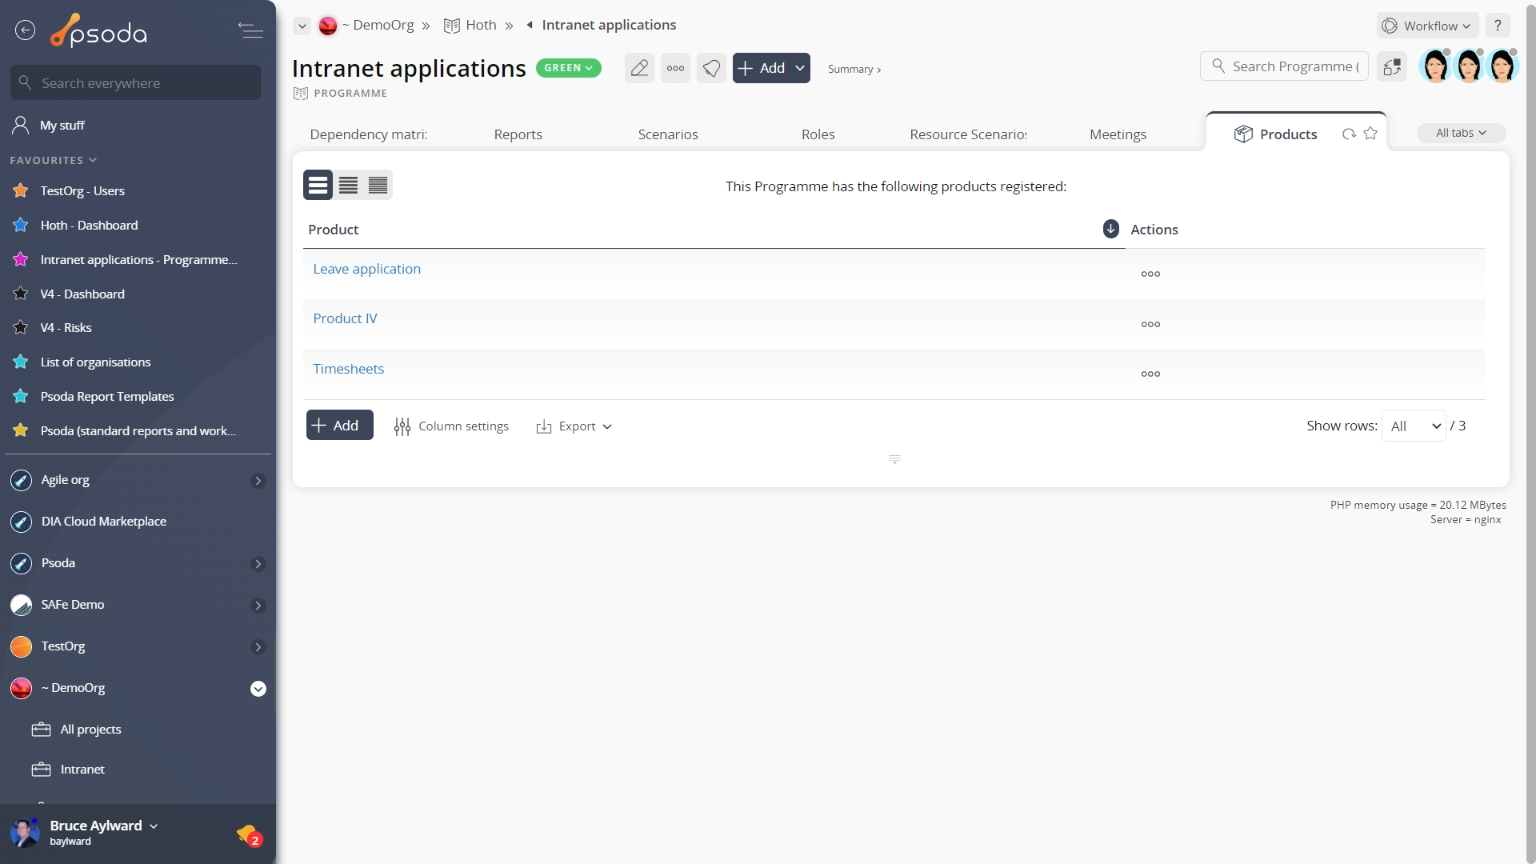 Figure 31 – Programme products table
Programmes & Projects
This tabbed view shows the programmes and projects table as seen in Figure 32, providing a high level overiew of the status of each listed programme/project that has been registered for this programme. It also shows how many sub-programmes, projects and sub-projects are associated with each programme and project, the Red/Amber/Green (RAG) status of the asset, the RAG change, and counters of open items such as actions and risks.
By default, this table view will also show you a checkbox column to allow for multiple selection of assets, estimated effort and cost information, the current state of the asset, any workflow transitions that may become applicable if a workflow has been applied to this asset, and the project type.
The Actions column of this table view provides information about what actions can be taken on the chosen asset. Such actions may include 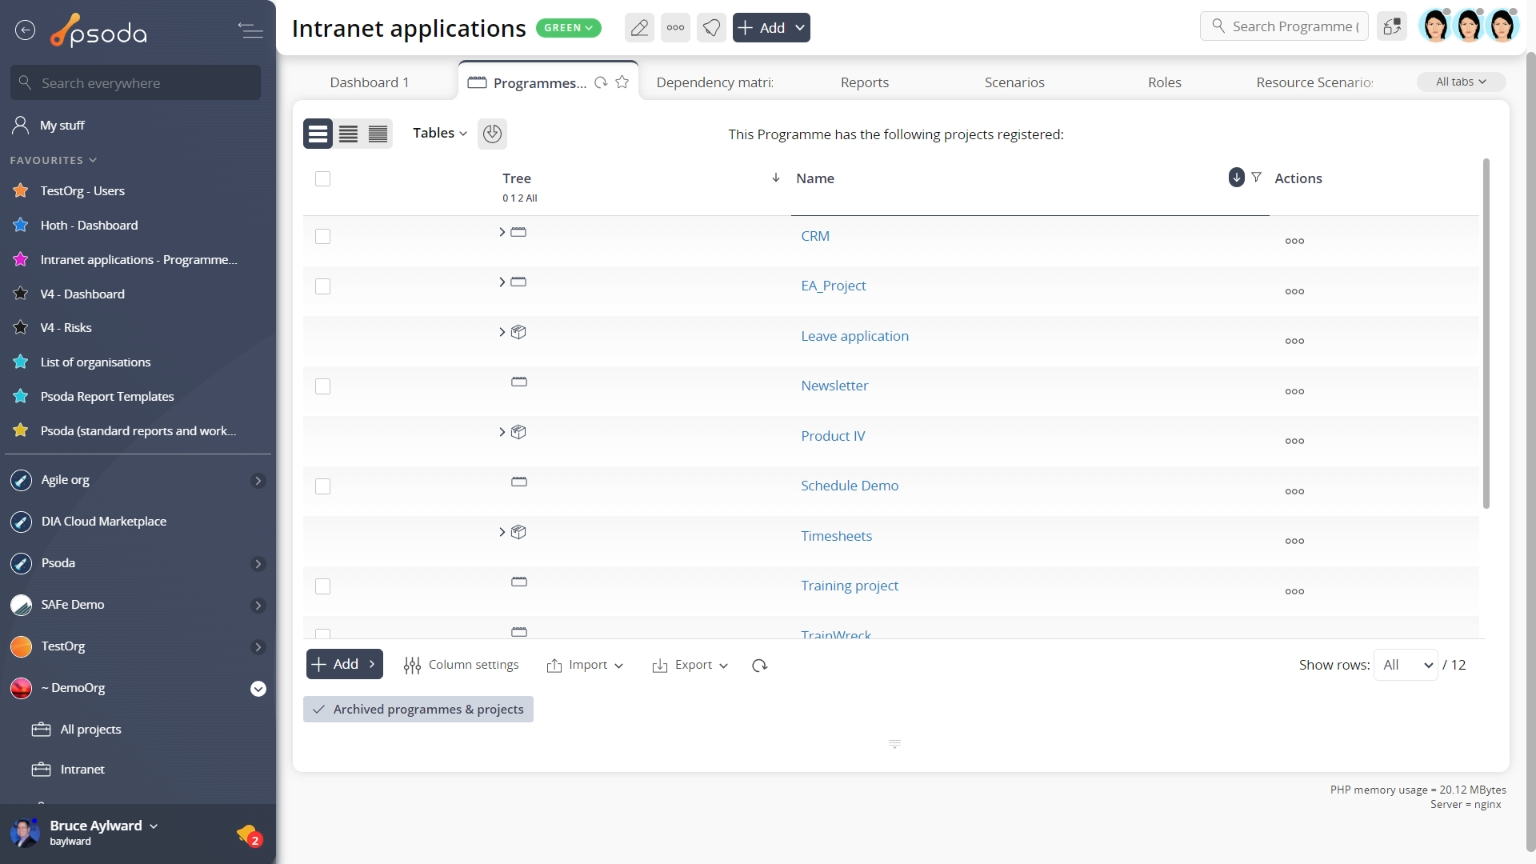 Figure 32 – Programme programme & project table
Radar charts
Instead of a table view, this tab provides a graphical view of how cost, resourcing and risk levels are interrelated in projects beneath this programme, as shown in Figure 33. The charts are generated from the information in put in the budgets, resources and risks tables at each the project level.
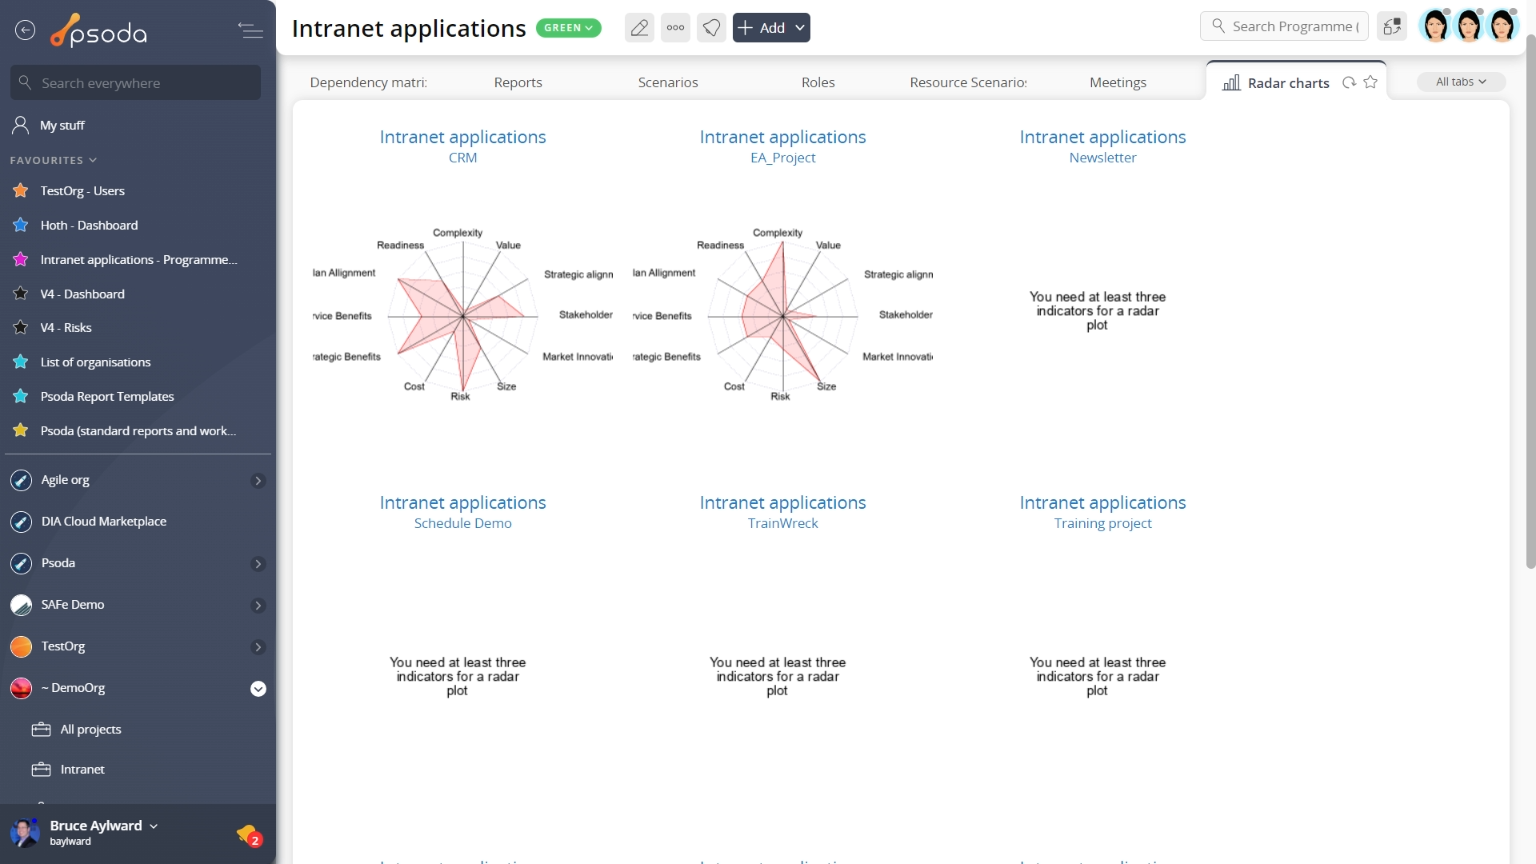
Figure 33 – Programme radar charts tab
If an asset under the programme level, doesn’t have the right information to generate this kind of chart, it’s name will be greyed out and no chart will be displayed. Reports
This tabbed view shows a listing of the reports as seen in Figure 34, listing any reports available for this programme.
Figure 34 shows a portion of this alphabetical listing, and your specific list may vary slightly depending on if your System Administrator has created any new report templates that have been customised to be available to your organisation only.
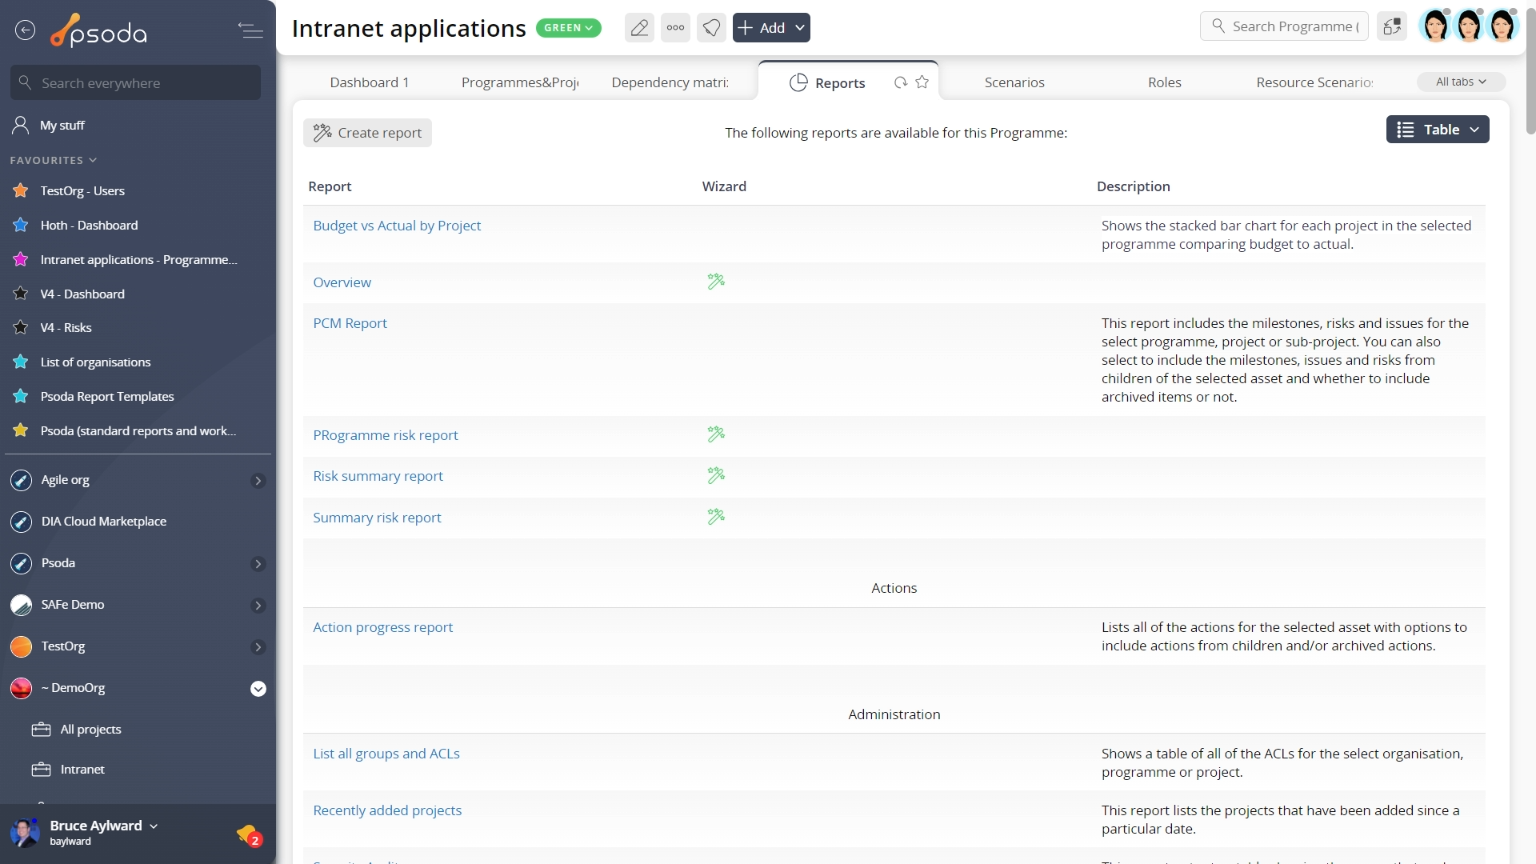
Figure 34 – Programme report table
This listing is unable to be customised, but provides the name of the report and a more detailed description of what information this report is built for and how the report is grouped.
Once you click on a report’s name, the run report form will popup. These popup forms vary depending on the report being run.
 Risks
Risks
This tabbed view shows the risks table as seen in Figure 35, listing any risks that have been logged for this programme. By default, you will be shown the risk’s context, reference, title, description, proximity, any workflow transitions that may be available and other details also captured in the screenshot below.
The Actions column of this table provides accessible functions to act on a chosen role. These functions include 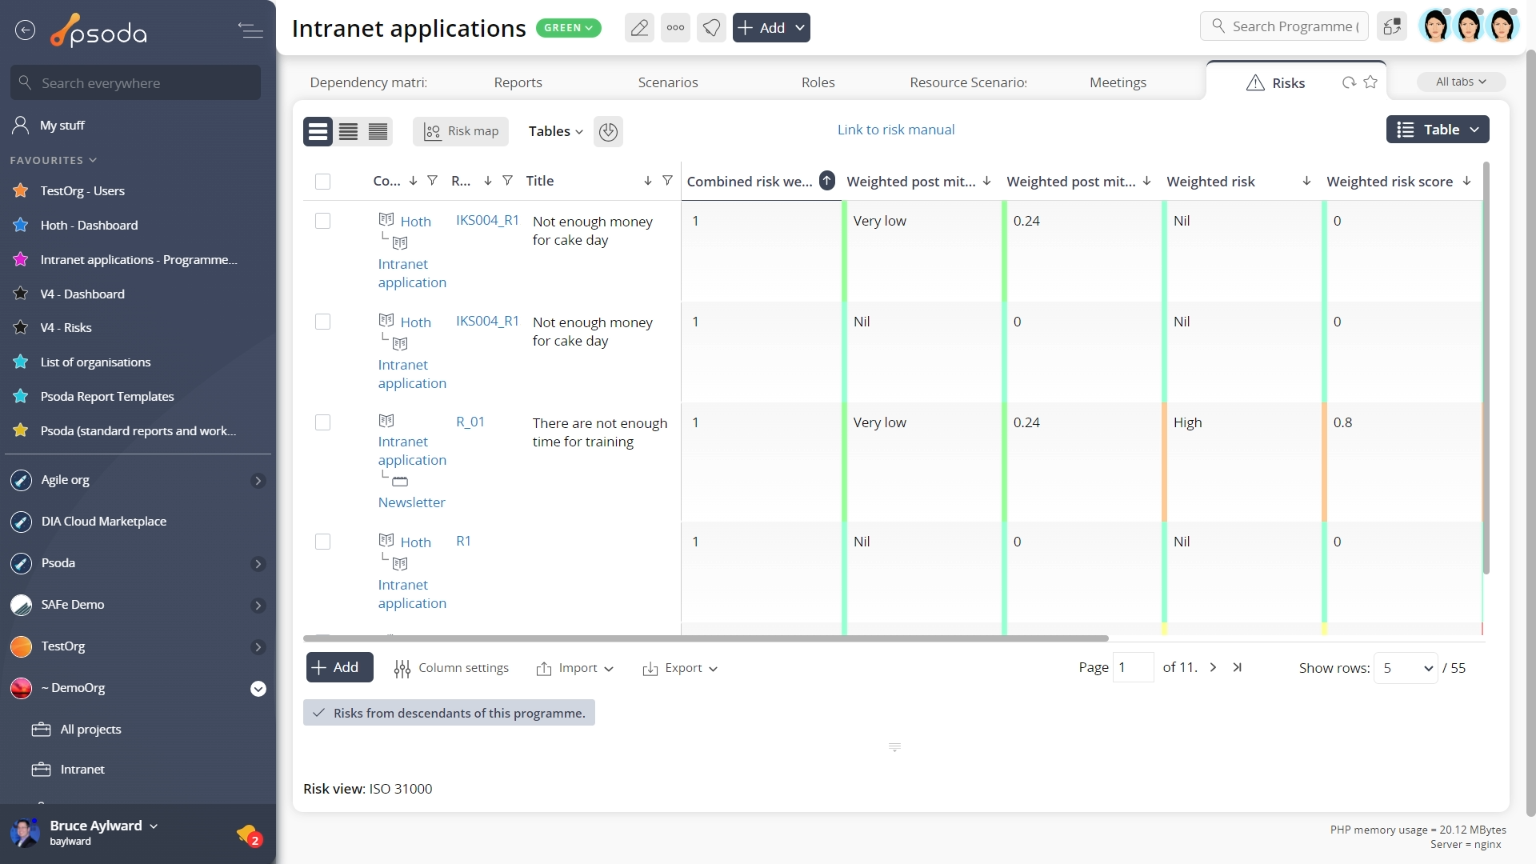
Figure 35 – Programme risk table
Note that at the bottom of this table you can Roles
Roles
This tabbed view shows the roles table as seen in Figure 37, listing any roles that have been defined for this programme. By default, you will be shown the role’s name, description and editable daily and hourly rates for members of this role, along with a list of users who are members of this role.
The Actions column of this table provides accessible functions to act on a chosen role. These functions include 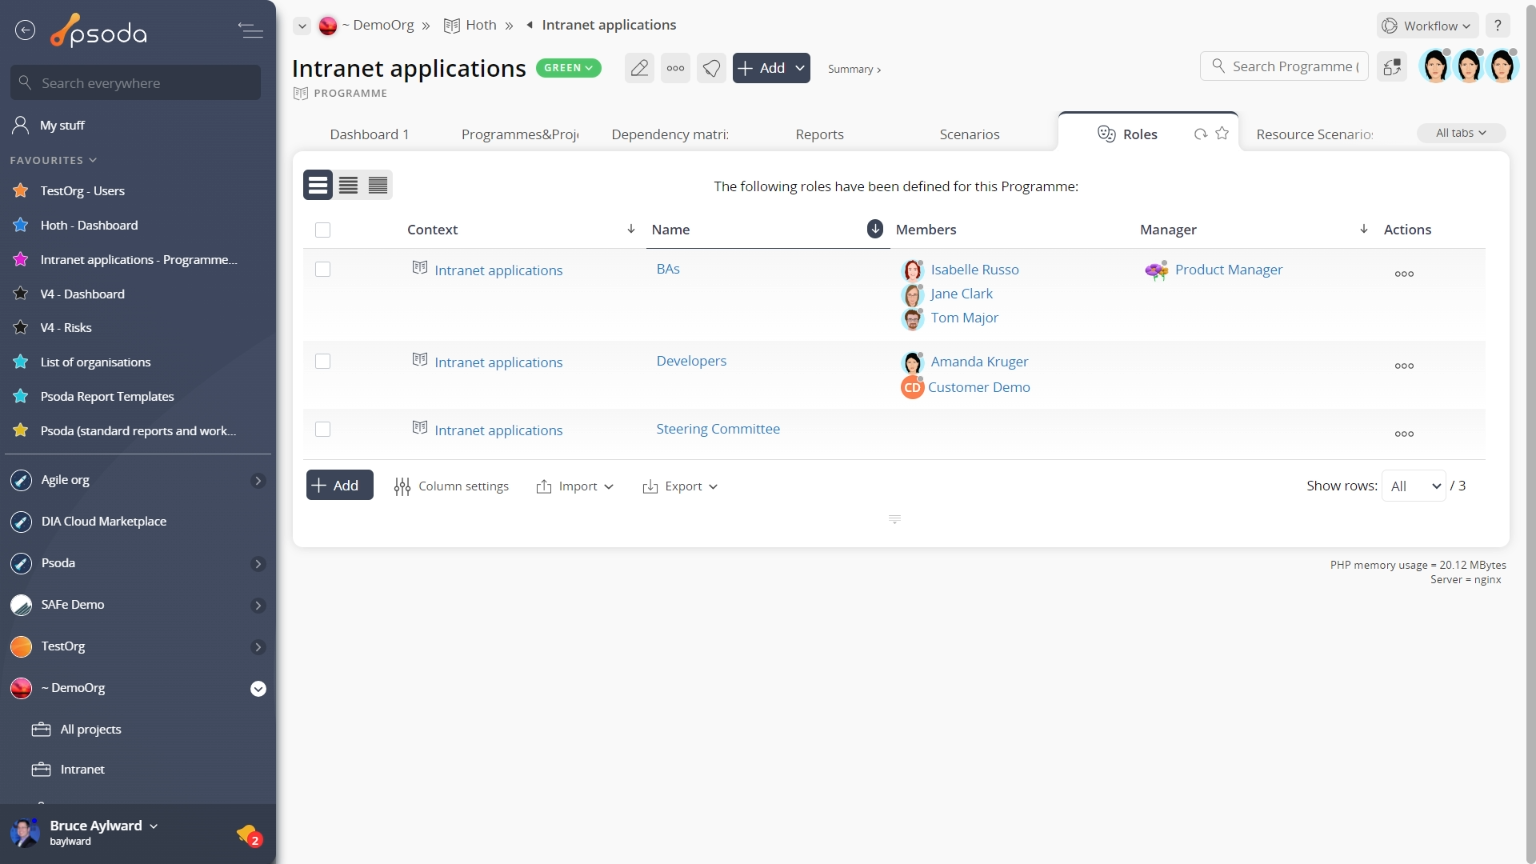
Figure 37 – Programme roles table
Note that at the bottom of this table you can ![]() add another single role,
add another single role, ![]() edit the table columns to show or hide role information, or export this role list to
edit the table columns to show or hide role information, or export this role list to ![]() Excel or
Excel or ![]() CSV files.
CSV files.
Schedule charts
Instead of a table view, this tab provides a graphical view of your accumulated baseline vs. actual over time for the budget groups contained in lower level assets beneath this programme, as shown in Figure 38. The charts are generated from the information in put in the budgets tables at each asset level.
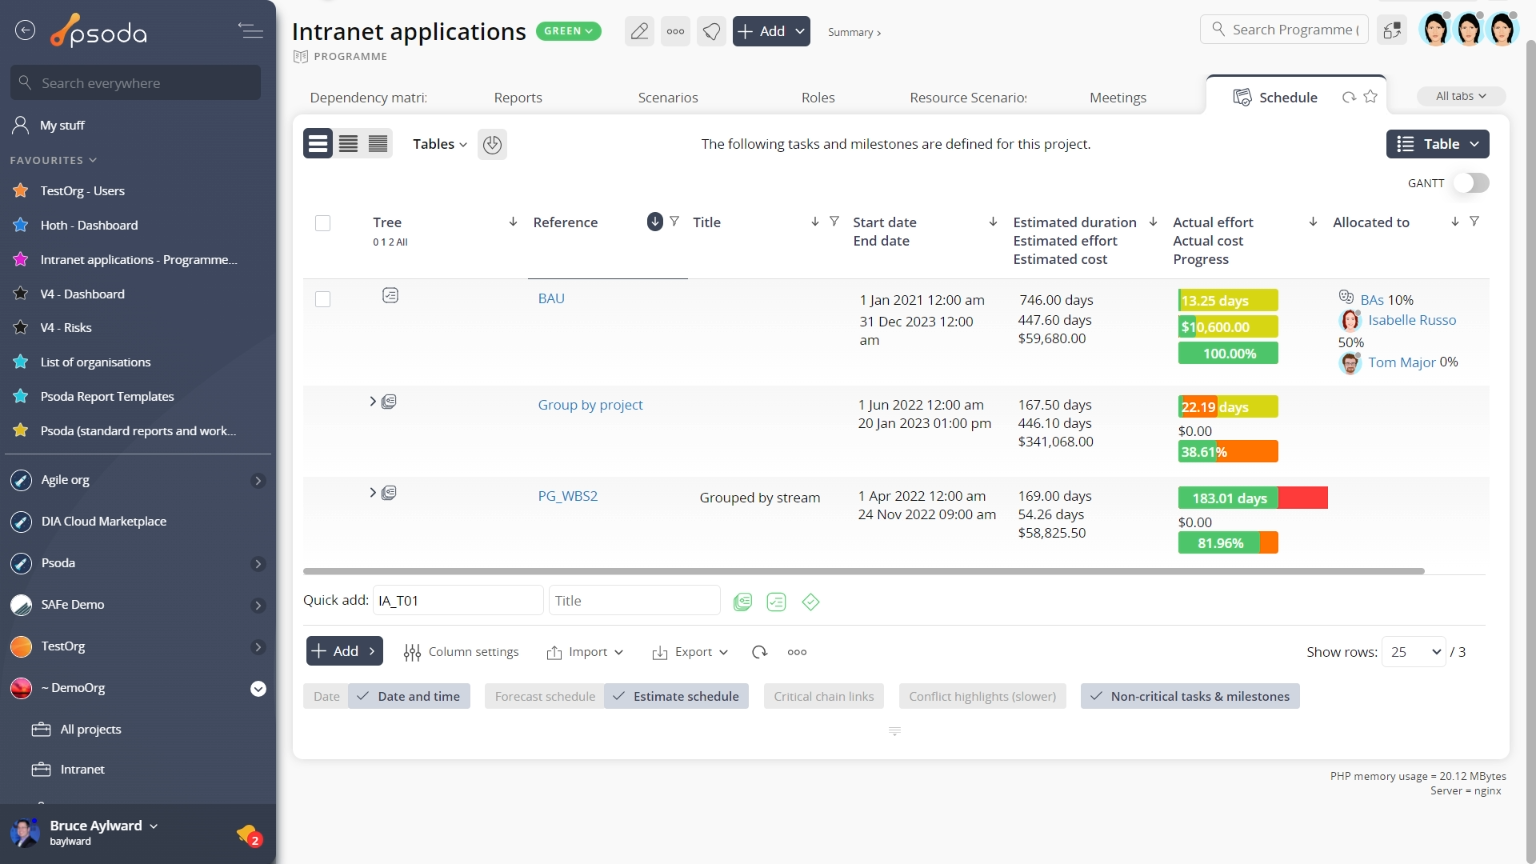
Figure 38 – Programme schedule charts tab
If an asset under the programme level, doesn’t have the right information to generate this kind of chart, it’s name will be greyed out and no chart will be displayed.
Schedule
This tabbed view shows the tasks and milestones table as seen in Figure 39, listing any
Figure 39 – Programme tasks and milestones table
Note that at the bottom of this table you can add another ![]() task group,
task group, ![]() task or
task or ![]() milestone,
milestone,![]() edit the table columns to show or hide asset information, or export this information to
edit the table columns to show or hide asset information, or export this information to ![]() Excel or
Excel or ![]() CSV files.
CSV files.
At the very bottom of this tabbed view you are presented with a number of table information formatting options which will increase/decrease the information you’re presented with, as well as other options to import task group/WBS information, view the information in a GANTT format or run a recalculation.
From this other options subsection at the bottom of this tabbed view, you may also have access to ![]() mass approve,
mass approve, ![]() mass complete or mass archive tasks.
mass complete or mass archive tasks.
 Test case overview
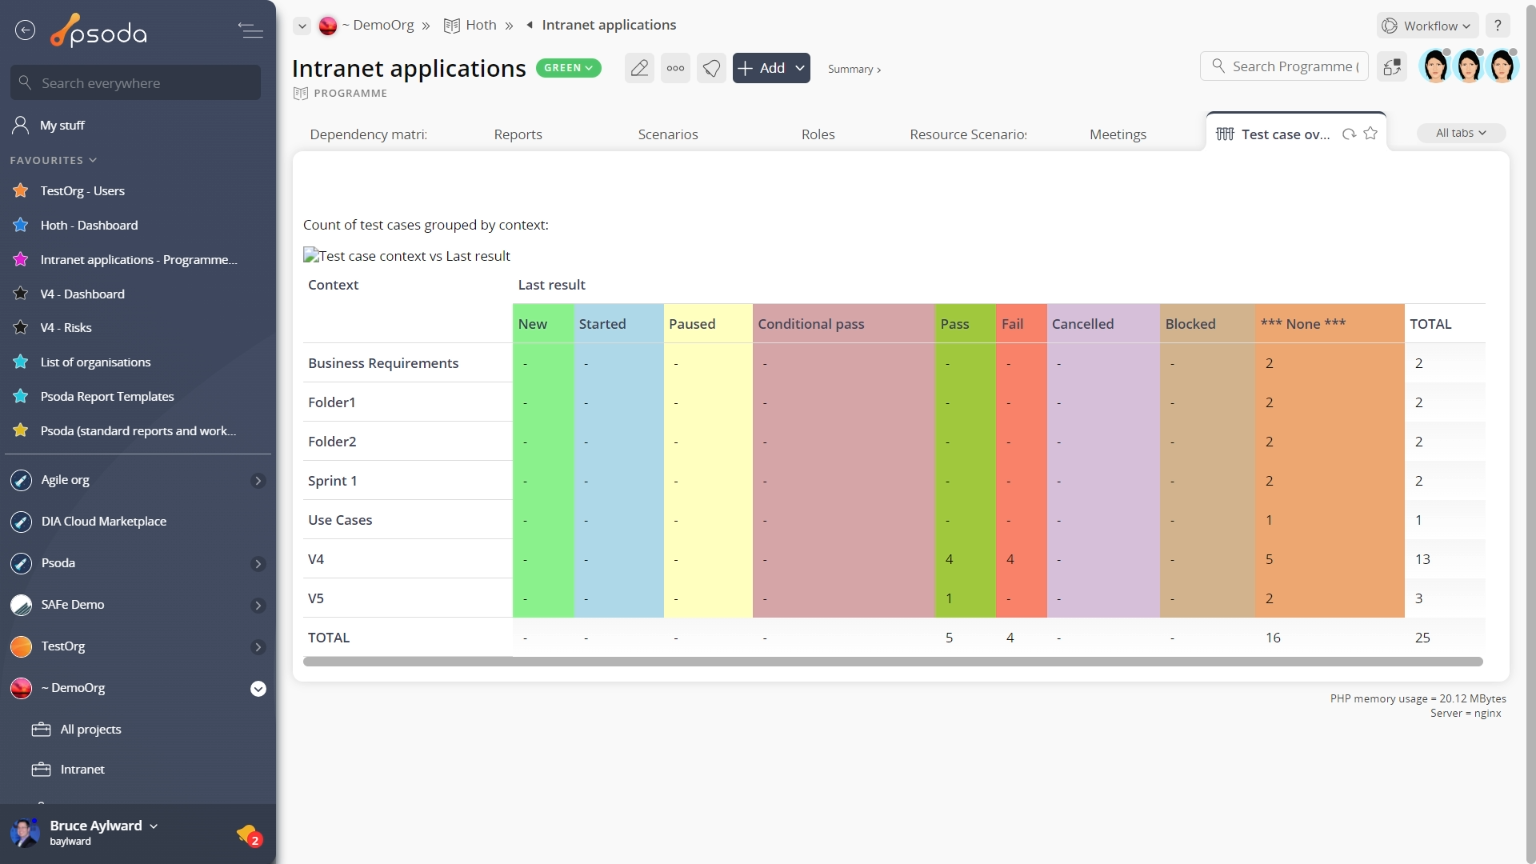
Figure 40 – Programme test case overview
Instead of a table view, this tab provides a graphical view of your test cases by presenting a number of graphs grouping test cases by certain categories, as shown in Figure 40. The defects overview charts are generated by information in the test cases tab at lower asset levels.
Whiteboards
This tab shows an asset listing of all of the whiteboards that have been added to this programme, as shown in Figure 41. By default, this table will present you with a number of details about the whiteboards such as it’s context, title, description, type, the user who created this whiteboard and it’s current state. If you click on the link beneath the whiteboard column, you will navigate to the selected whiteboard’s view page.
From the Actions column of this whiteboards table, you can act on individual whiteboard by 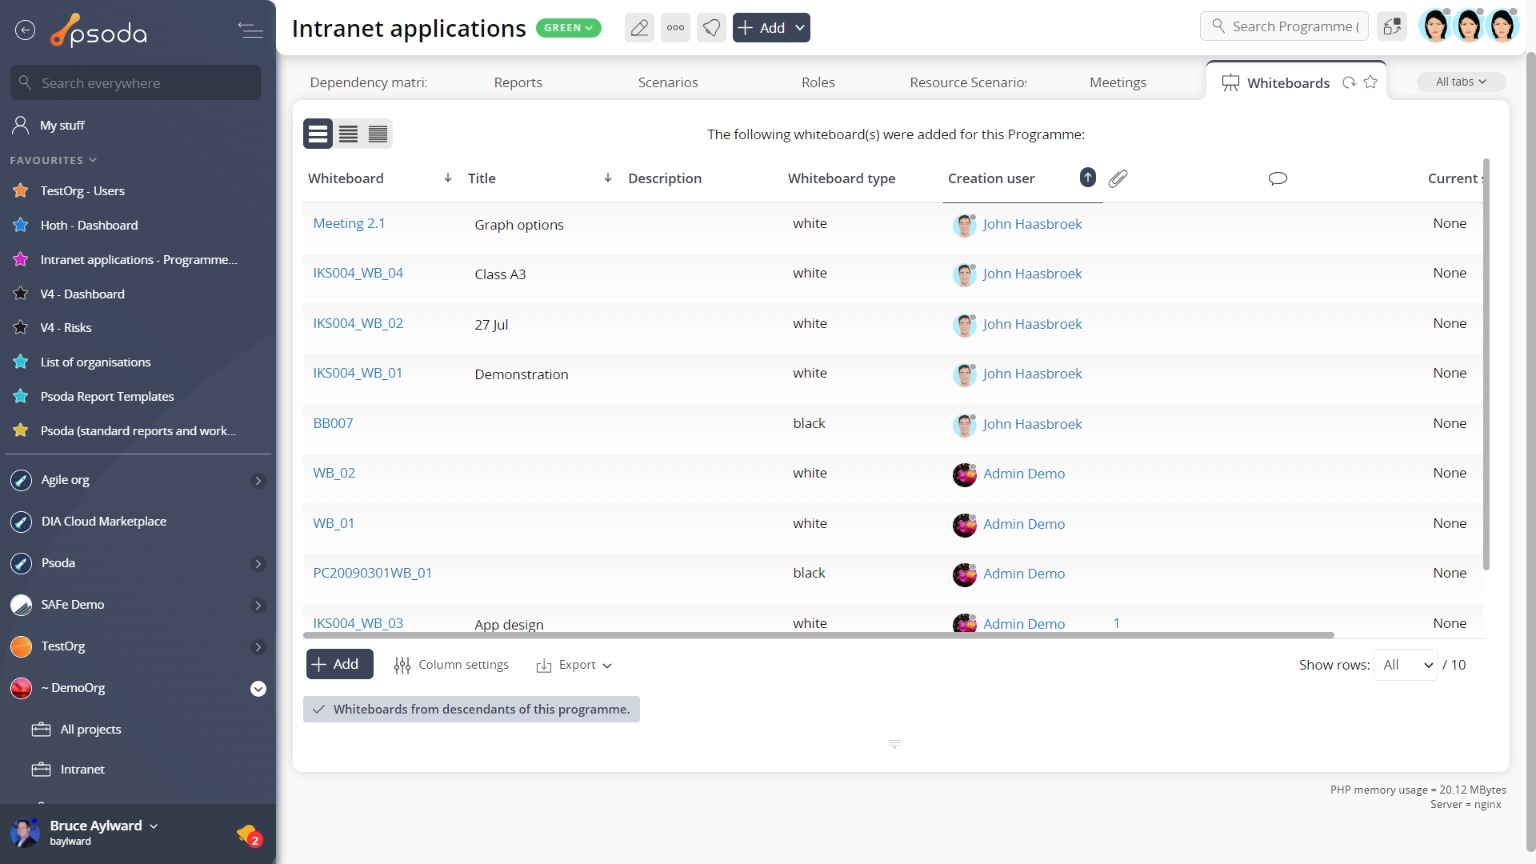
Figure 41 – Programme whiteboards tab
Note that you can customise your table view by clicking the