Figure 1 – Organisation view page
Depending on your access rights the top header area allows you to Actions
This tab shows an asset listing of all of the actions registered for this organisation, as shown in Figure 2. By default, this table will present you with a number of details about the actions such as it’s context, reference, description, priority and due date to name a few. If you click on the reference link of the listed action, you will navigate to that action’s view page.
From the Actions column of this actions table, you can act on individual actions by 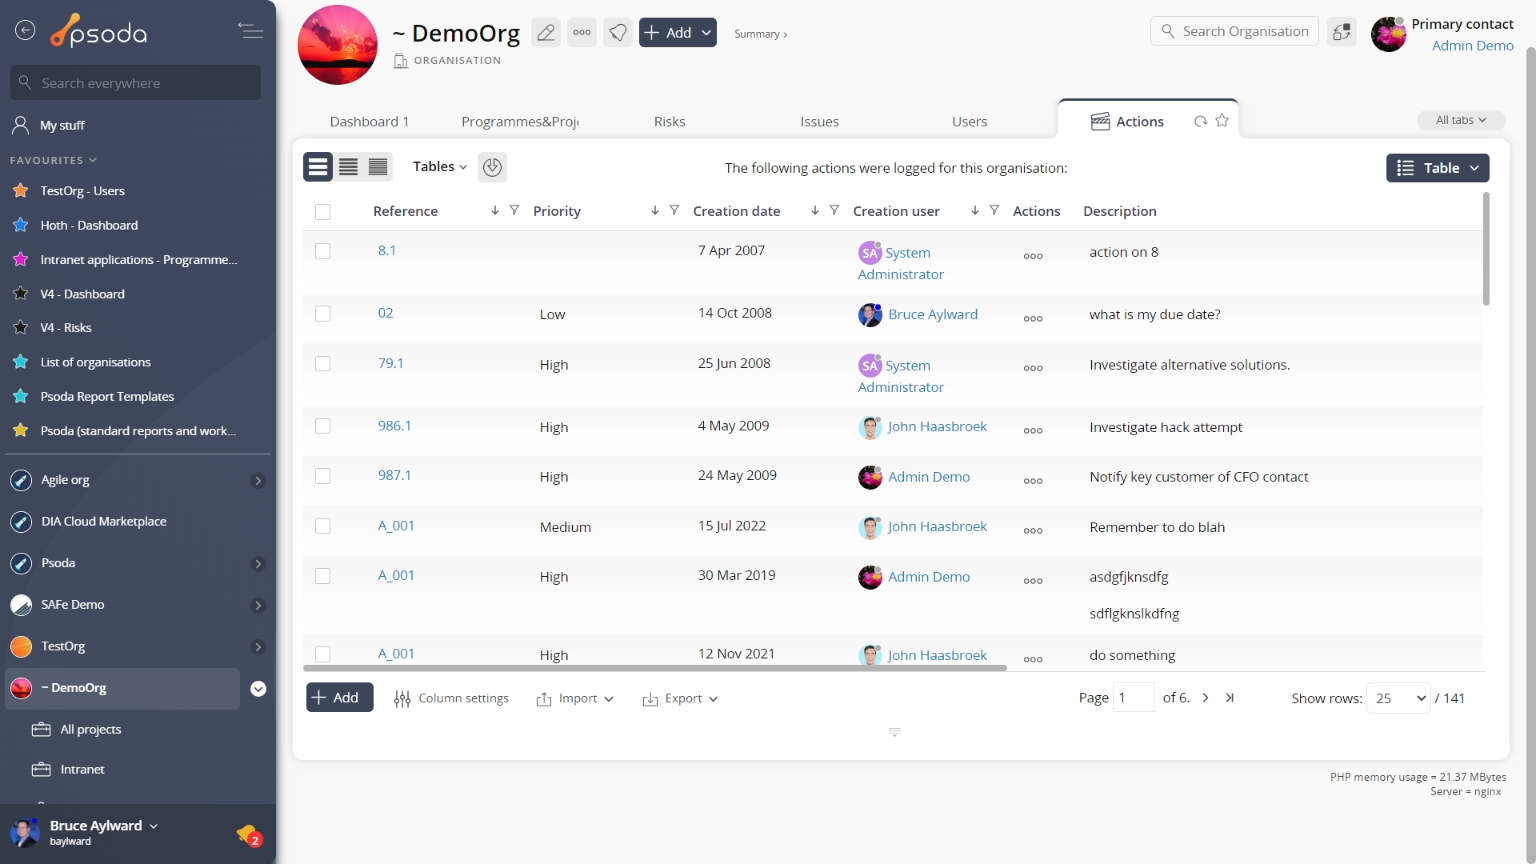
Figure 2 – Organisation actions tab
Note that you can customise your table view by clicking the Attachments
This tab shows an asset listing of all of the attachments that have been added to this organisation, as shown in Figure 3. By default, this table will present you with a number of details about the attachments such as the file’s name, attachment type, view the version and access a download link.
From the Actions column of this attachments table, you can act on individual attachments by 
Figure 3 – Organisation attachments tab
Note that you can customise your table view by clicking the Benefits
This tab shows an asset listing of all of the benefits defined for this organisation, as shown in Figure 4. By default, this table provides measurement information about the benefits listed, it’s title and a progress indicator. From here you may also view the workflow 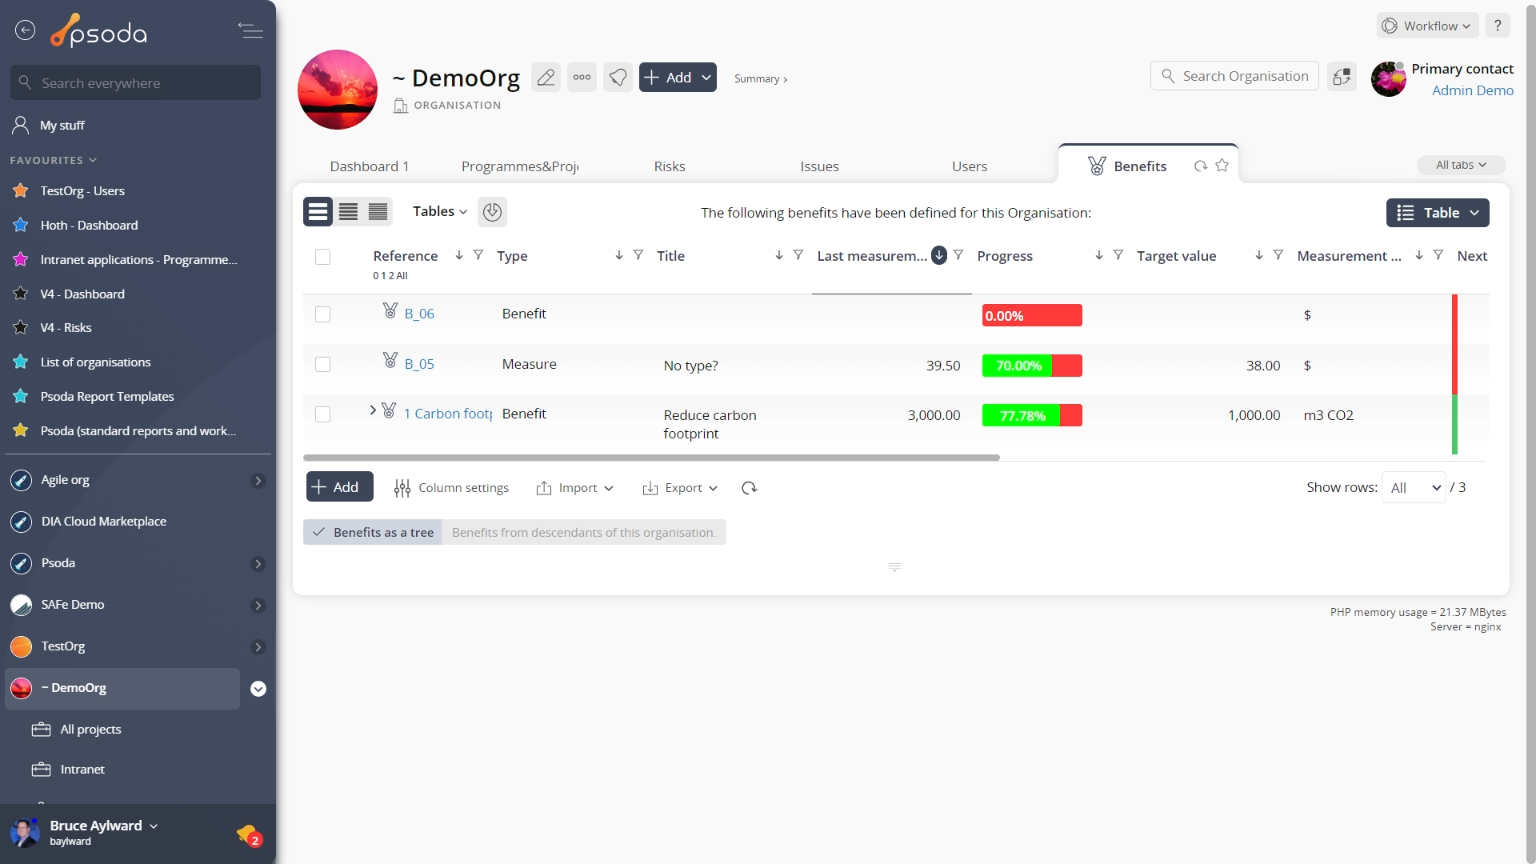
Figure 4 – Organisation benefits tab
Note that at the bottom of the table you can ![]() add more benefits, or customise your table view by clicking the
add more benefits, or customise your table view by clicking the ![]() edit button to show or hide certain benefit information, or export this benefit list to
edit button to show or hide certain benefit information, or export this benefit list to ![]() Excel or
Excel or ![]() CSV files.
CSV files.
 Benefit Map
Instead of a table view, this tab provides a graphical view of your benefits. The benefits map is generated from the information you put in the benefits table. Figure 5 below shows an example benefits map:
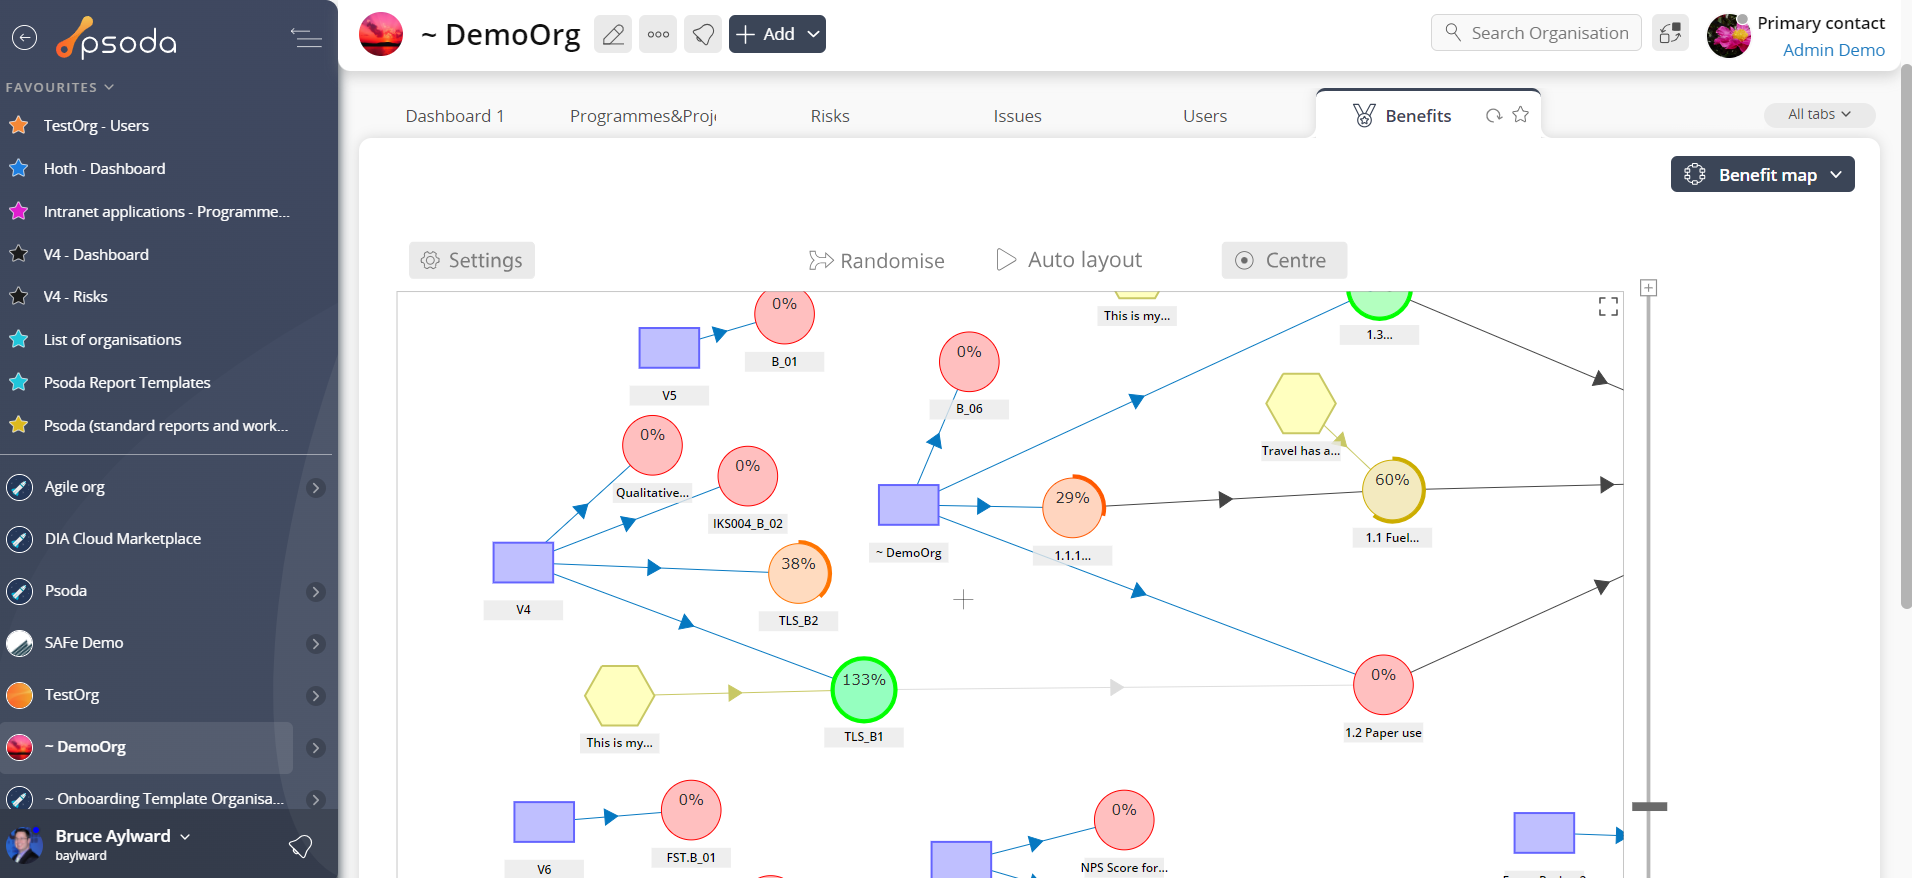 Figure 5 – Organisation benefit map
 Contracts
This tab shows an asset listing of all of the contracts that have been added to this organisation, as shown in Figure 6. By default, this table will present you with a number of details about the contracts such as it’s category, title, description, vendor, start, review and end dates, manager, any attachments or comments and the contract’s current state. If you select the link in the contract column, you will navigate into that contract’s view page.
From the Actions column of this contracts table, you can act on individual contracts by ![]() editing,
editing, ![]() deleting,
deleting, ![]() moving the contract or adding
moving the contract or adding ![]() comments or
comments or ![]() attachments to the chosen contract .
attachments to the chosen contract .
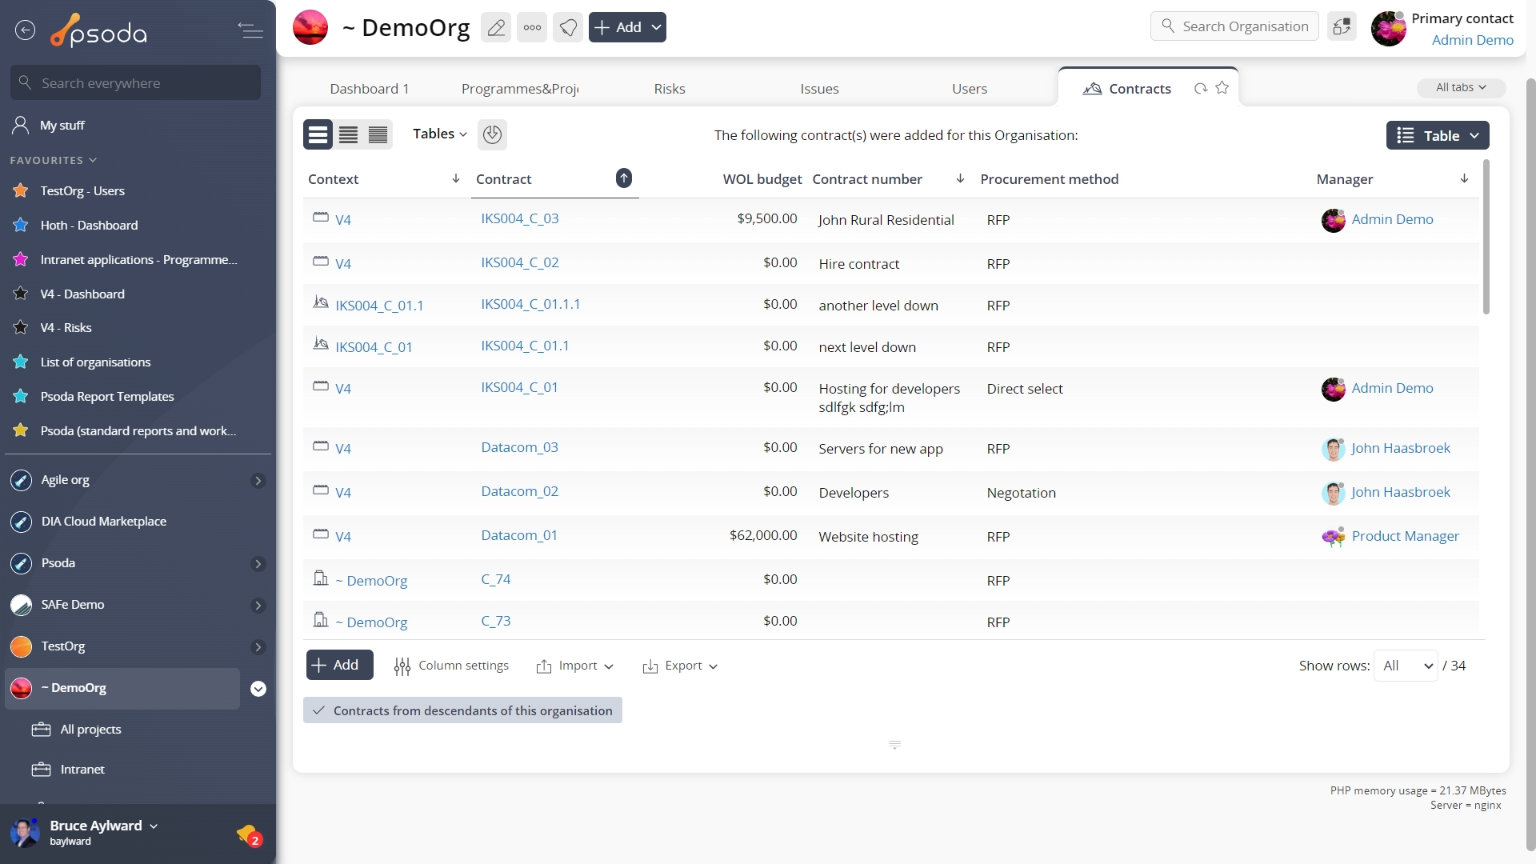
Figure 6 – Organisation contracts tab
Note that at the bottom of the table you can  Custom fields
This tab shows an asset listing of all of the custom fields that have been added to this organisation, as shown in Figure 7. By default, this table will present you with a number of details about the custom fields such as which section this custom field applies to, it’s title, description, codename and default value, to name a few. If you select the link in the title column, you will navigate into that custom field’s view page.
From the Actions column of this custom fields table, you can act on individual custom fields by 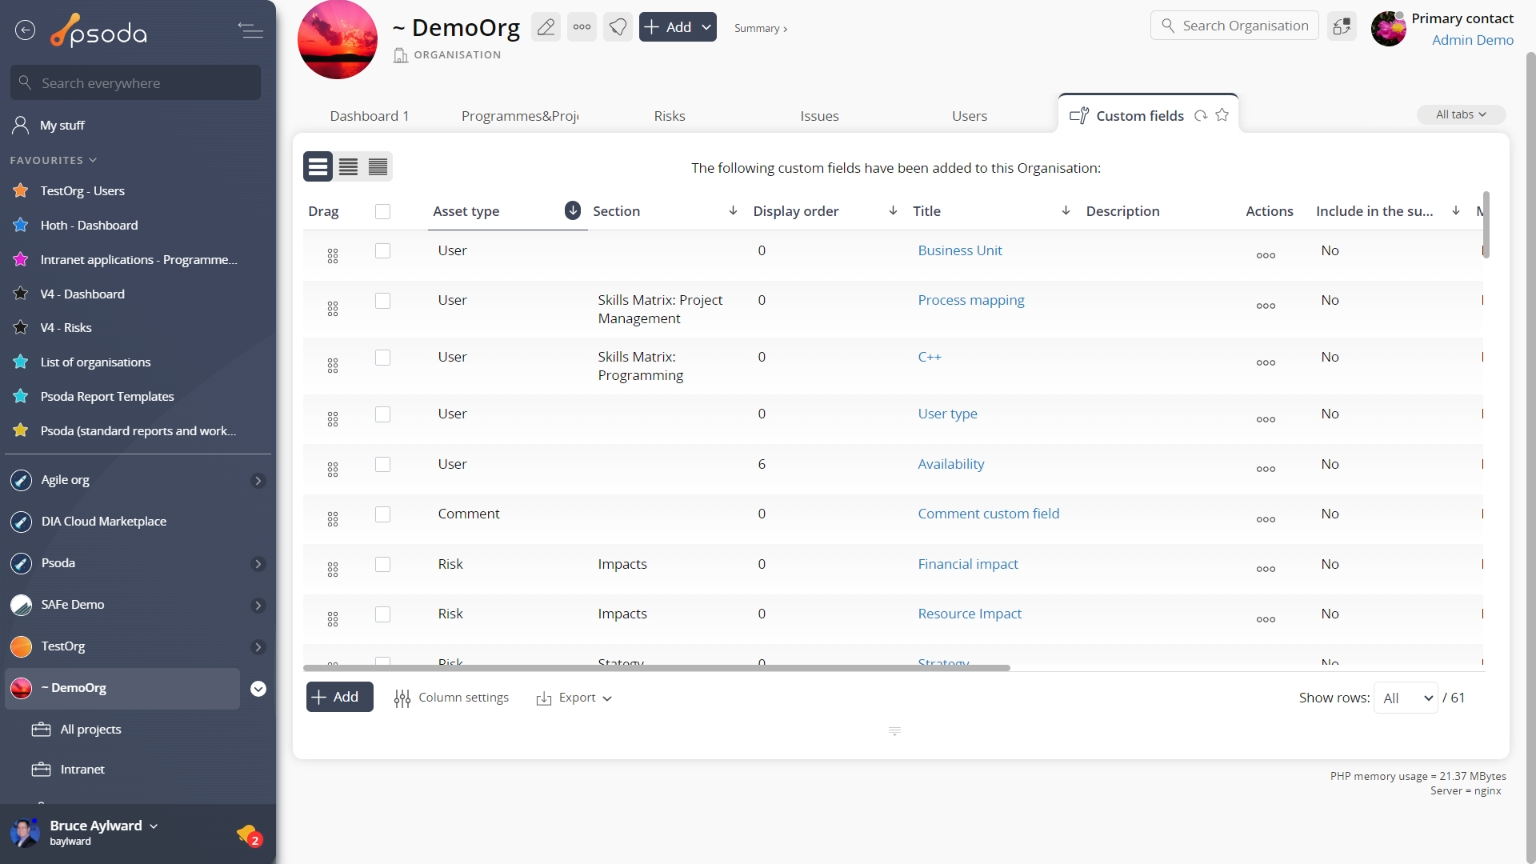
Figure 7 – Organisation custom fields tab
Note that at the bottom of the table you can ![]() add more custom fields, or customise your table view by clicking the
add more custom fields, or customise your table view by clicking the ![]() edit button to show or hide certain custom field information, or export this list to
edit button to show or hide certain custom field information, or export this list to ![]() Excel or
Excel or ![]() CSV files.
CSV files.
 Dashboard
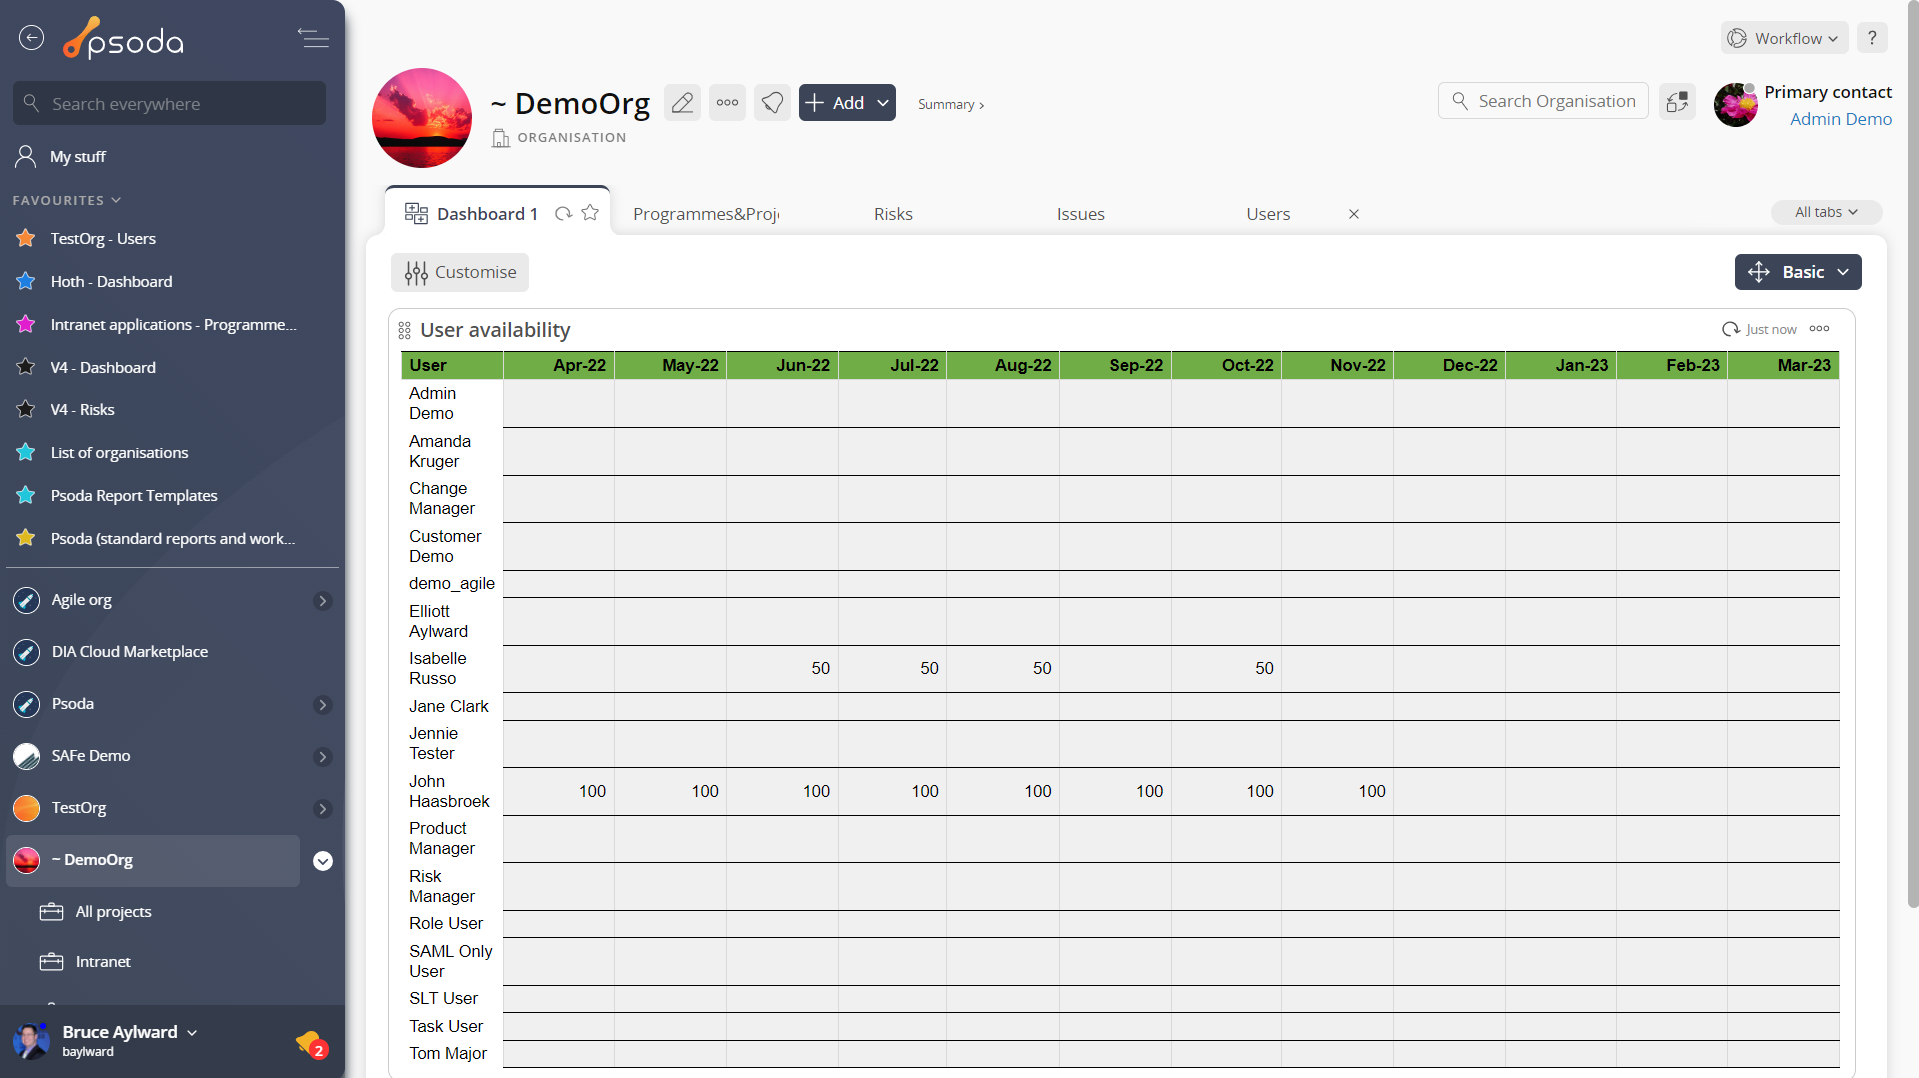
Figure 8 – Organisation dashboard tab
The dashboard provides an overview of all the programmes and projects running within the organisation. The first table shows each of the programmes with the overall status and counters for the number of open items such as actions, risks, issues, change requests, etc. You can click on each of the counters to view a list of the items. The second table shows each of the projects with the overall status and counters for the number of open items. Once again you can click on each of the counters to view a list of those items. Default roster
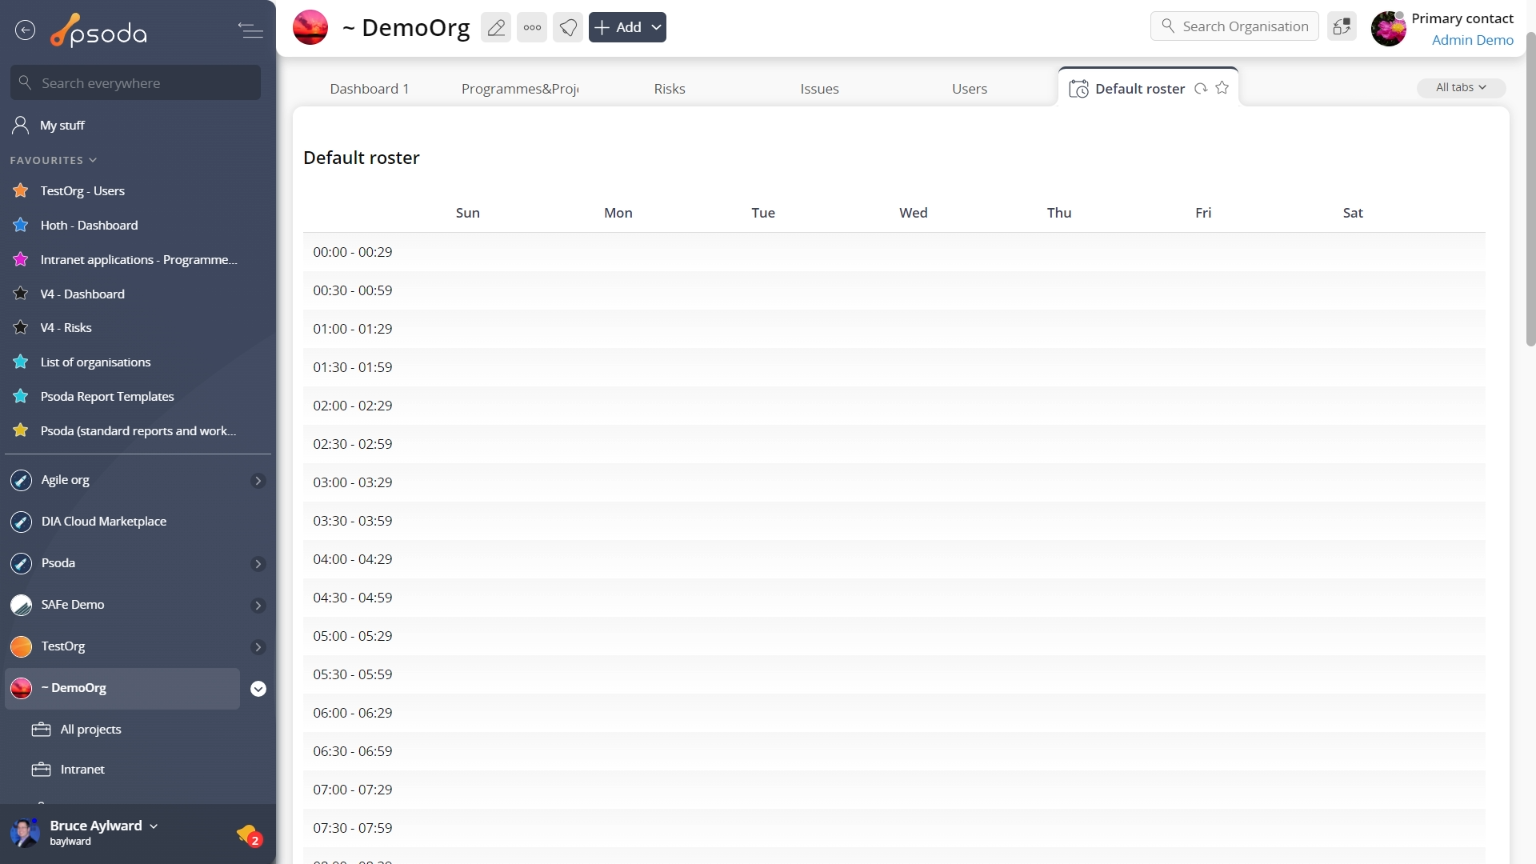
Figure 9 – Organisation default roster tab
This tab shows a breakdown of 30min timeslots indicating the hours that are marked as working or non-working times within the organisation’s roster. Those with ![]() ticks indicate that a working time has been assigned.
ticks indicate that a working time has been assigned.
 Deleted assets
This tab shows an asset listing of all of the assets that 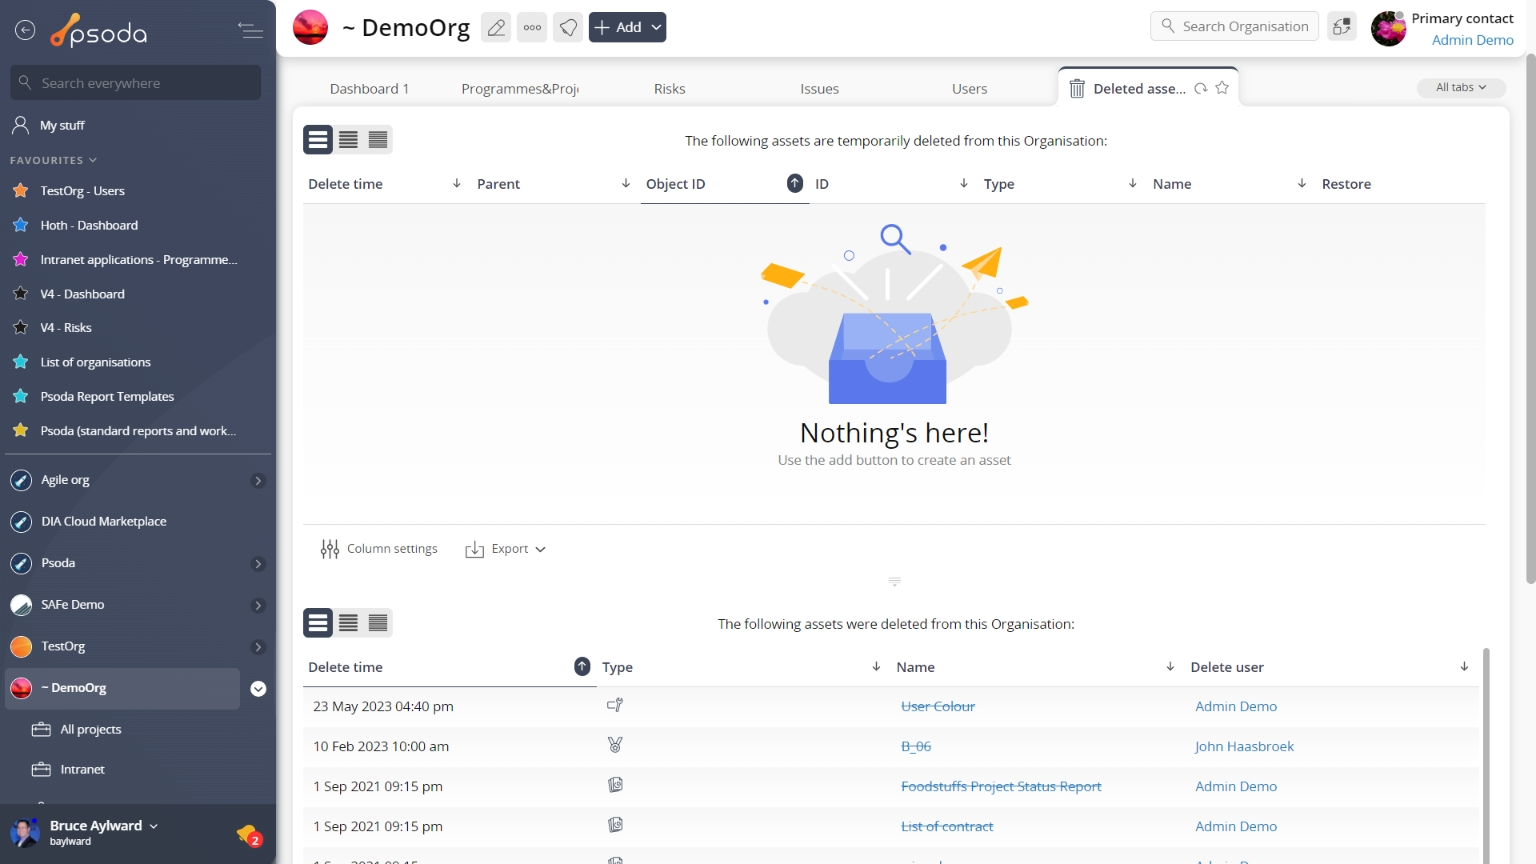
Figure 10 – Organisation deleted assets tab
Note that you can customise your table view by clicking the ![]() edit button at the bottom of the tables. Here, you can also export the list to
edit button at the bottom of the tables. Here, you can also export the list to ![]() Excel or
Excel or ![]() CSV files.
CSV files.
Dependency Matrix
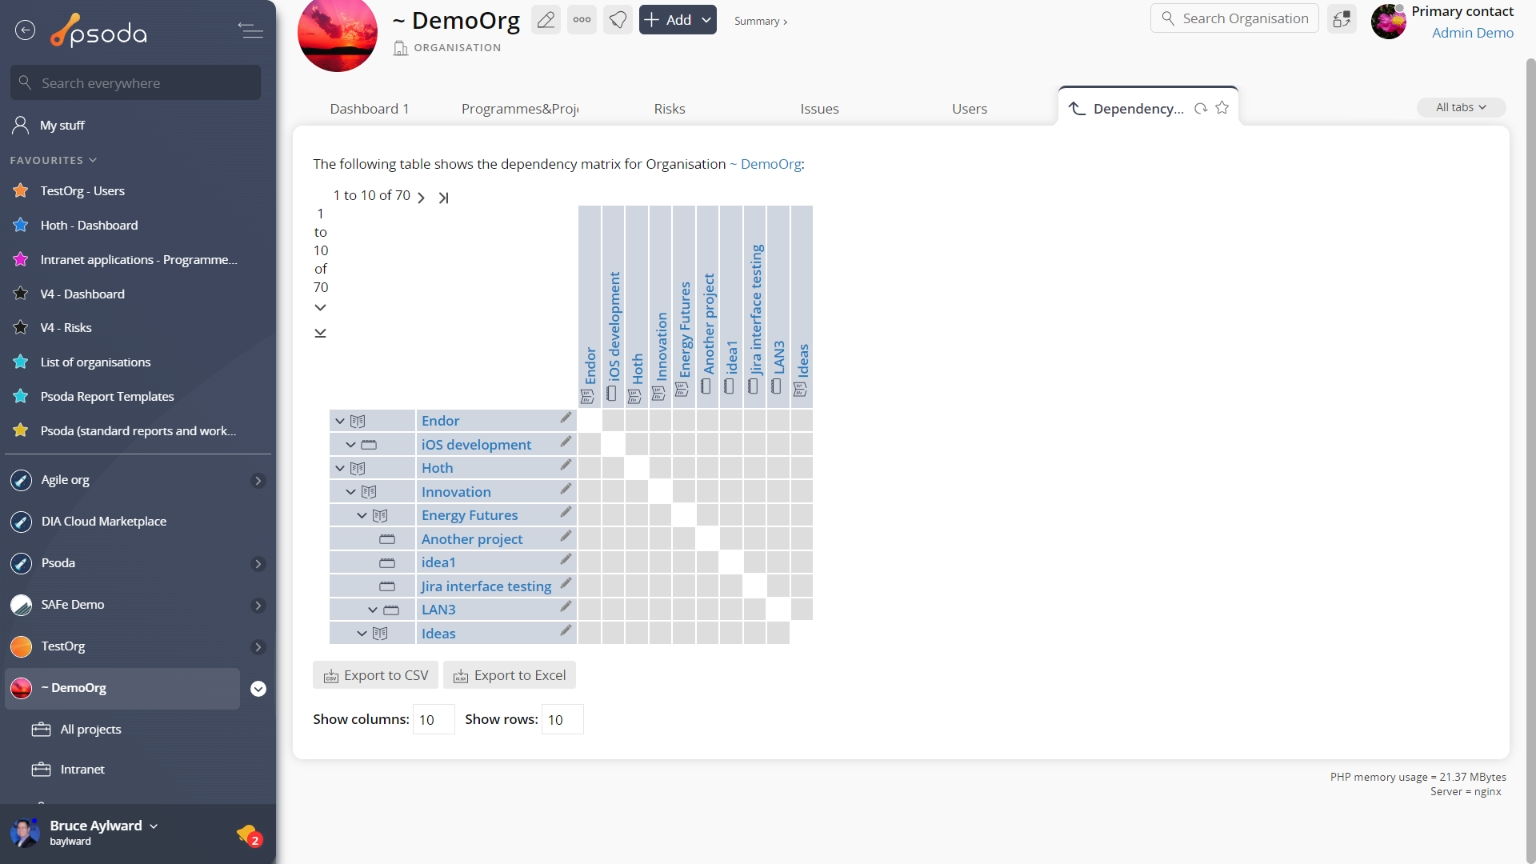
Figure 11 – Organisation dependency matrix tab
This tab shows the dependency matrix for the selected organisation. You can show more or less information by selecting the ![]() expand or
expand or ![]() collapse icons next to each asset that allows for this. This is a useful way of assessing
collapse icons next to each asset that allows for this. This is a useful way of assessing ![]() dependencies between a number of assets throughout the whole organisation.
dependencies between a number of assets throughout the whole organisation.
Details
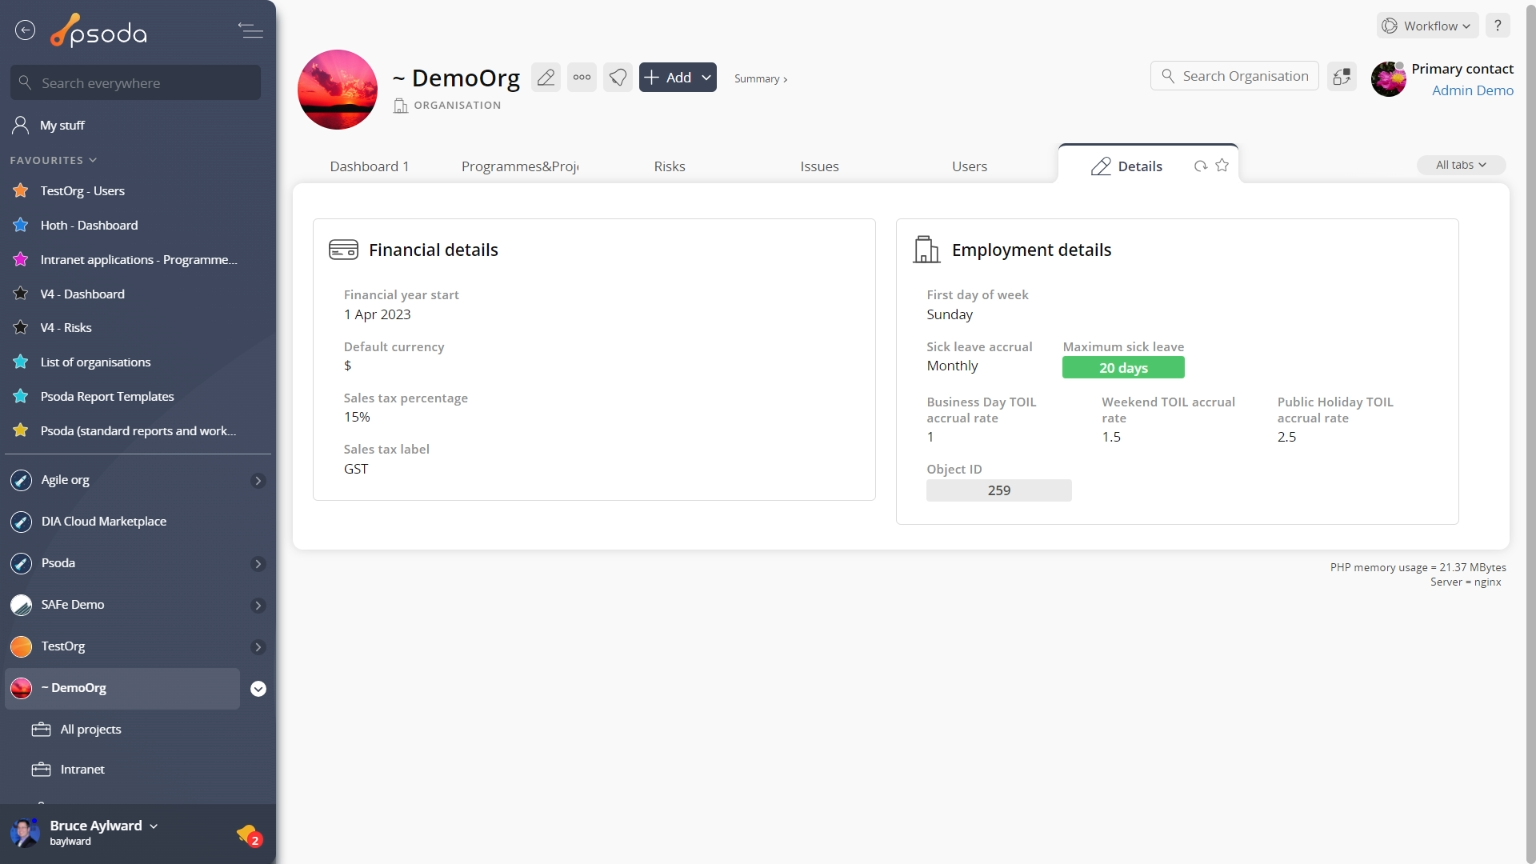
This tab shows additional details for the selected organisation including the start of the financial year, default currency, sales tax percentage, sales tax label, first day of the working week, sick leave accrual, maximum number of sick leave days that a user can accrue, as well as business day, weekend and public holiday TOIL accrual rates, as shown in Figure 12.
Figure 12 – Organisation details tab
All of the information in this view is read-only, and to edit any information you will need sufficient access rights, or need to contact your System Administrator.
Expenses
This tab shows an asset listing of all of the expenses that have been logged for this organisation, as shown in Figure 13. By default, this table shows the budget item that this expense item is associated with, the reference, description, date, date of payment as well amount including and excluding tax information. The number of comments and attachments added to an expense item is also indicated in this view. If you click on the link in the reference column, you will navigate into the selected expense’s view page.
From the Actions column of this expenses table, you can act on individual expenses by 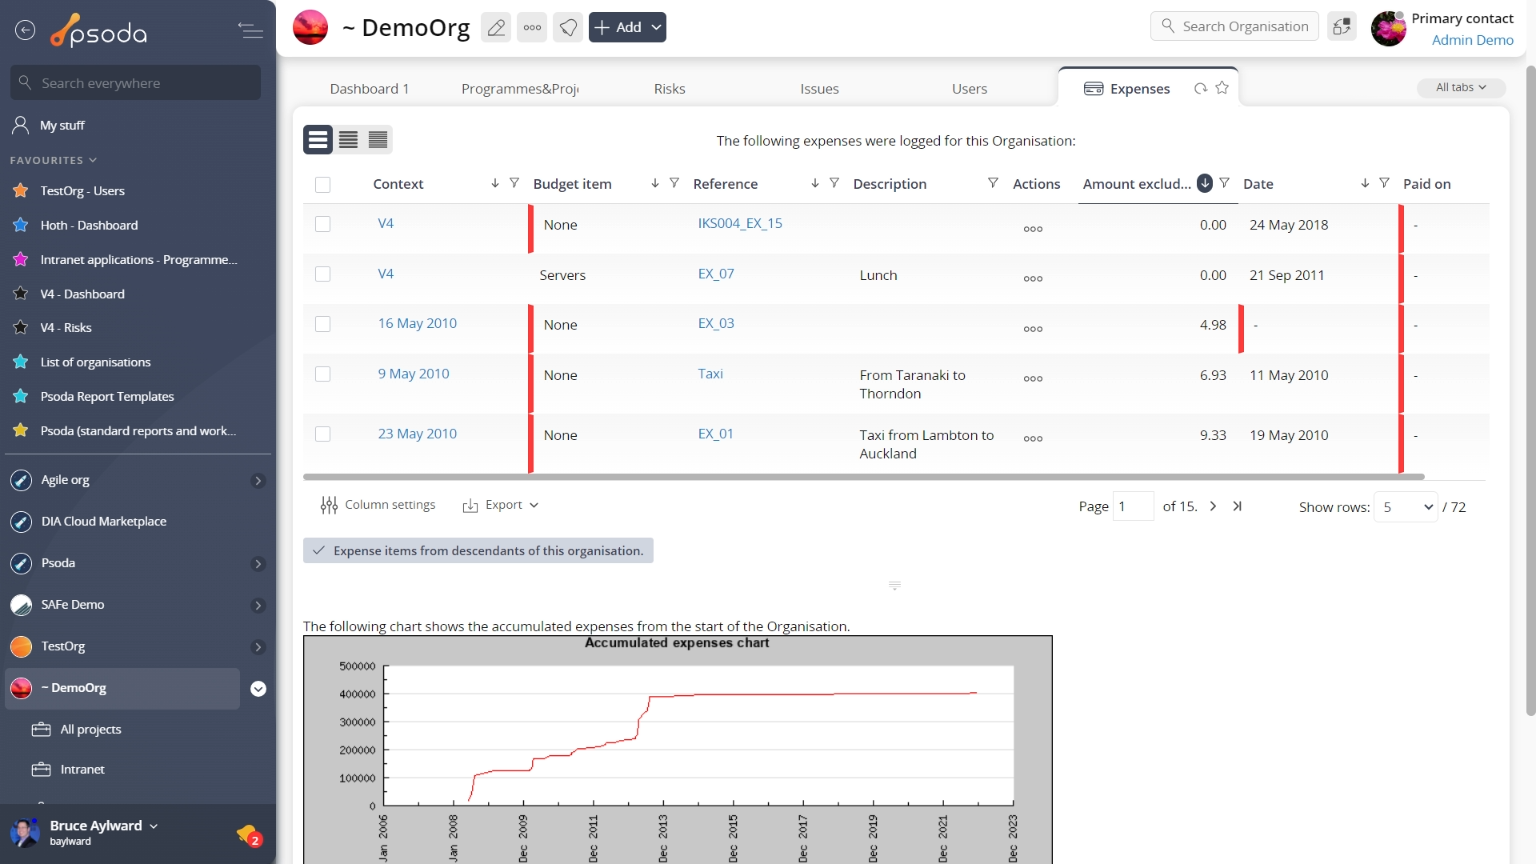 Figure 13 – Organisation expenses tab
A chart at the bottom of this tabbed view will also visually show you the accumulated expenses from the start of this organisation.
Note that you can customise your table view by clicking the ![]() edit button at the bottom of the expenses table or navigate to this same spot to
edit button at the bottom of the expenses table or navigate to this same spot to ![]() add more expense items to this organisation. Here, you can also export this list to
add more expense items to this organisation. Here, you can also export this list to ![]() Excel or
Excel or ![]() CSV files.
CSV files.
 GANTT
GANTT
This tabbed view shows the GANTT chart shown in Figure 14, generated by the information in your Schedule tab. By default, this table shows the name of the task group, task or milestone and it’s start and end dates.
On the right-most side of the chart there is a breakdown of tasks in a visual format than will span across a monthly, weekly or daily scale (this is setting dependent). The users who are allocated to each asset will have their names written next to this asset’s timeline.
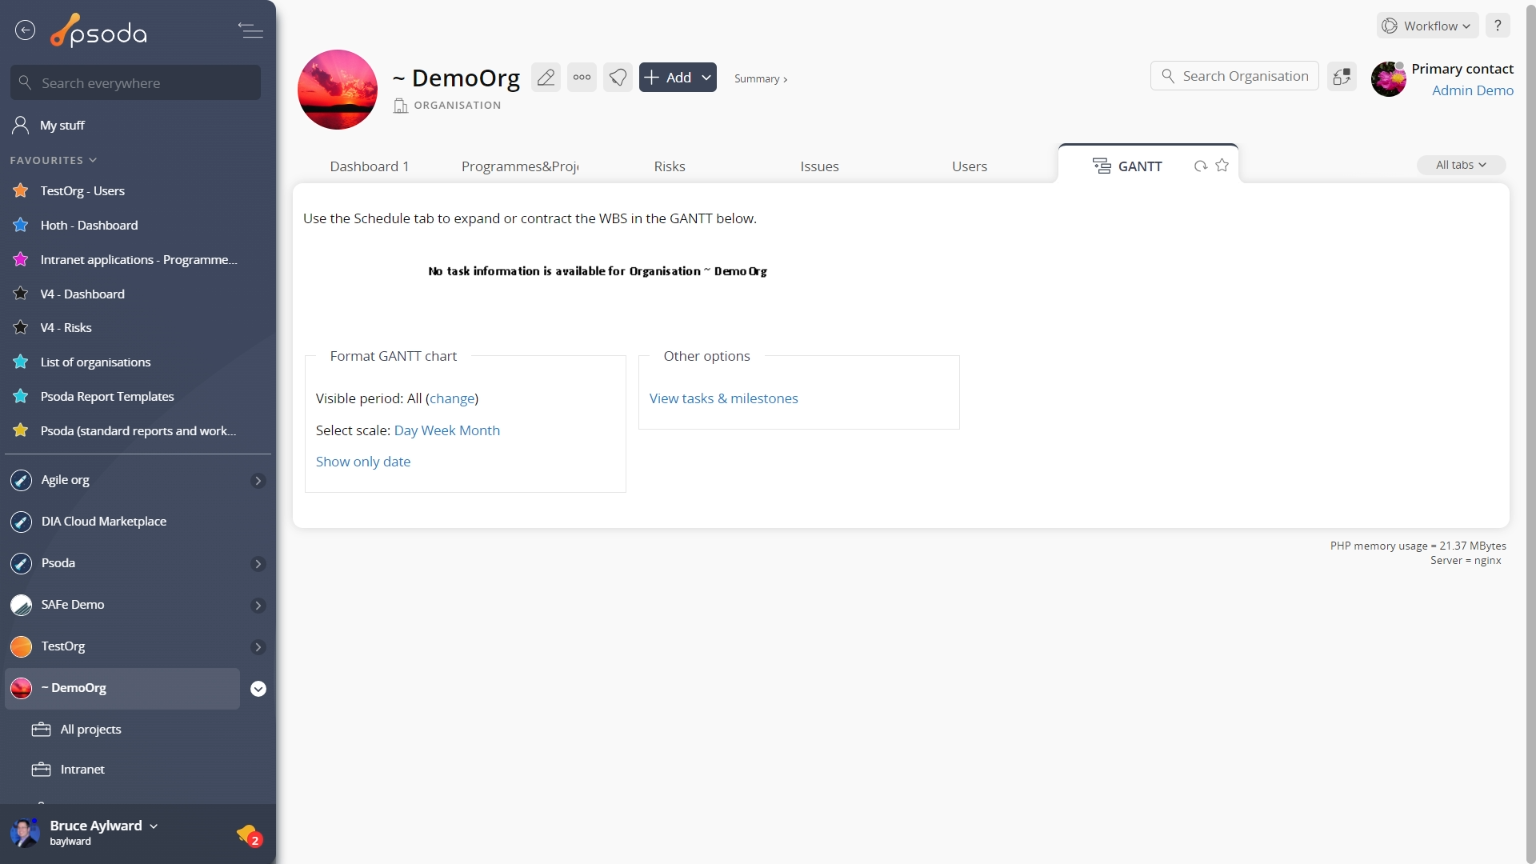
Figure 14 – Organisation GANTT chart
At the very bottom of this tabbed view you are presented with a number of table information formatting options which will adjust the GANTT’s visible period, or scale, or whether it displays more than just task dates.In addition, the view tasks & milestones link will navigate to the Schedule tabbed view so that you can expand or contract the work breakdown structure viewed in the GANTT.
 Groups
This tab shows an asset listing of all of the groups registered for this organisation, as shown in Figure 15. By default, this table shows the name and description of each group as well as the parent group for any sub-groups.
From the Actions column of this groups table, you can act on individual groups by 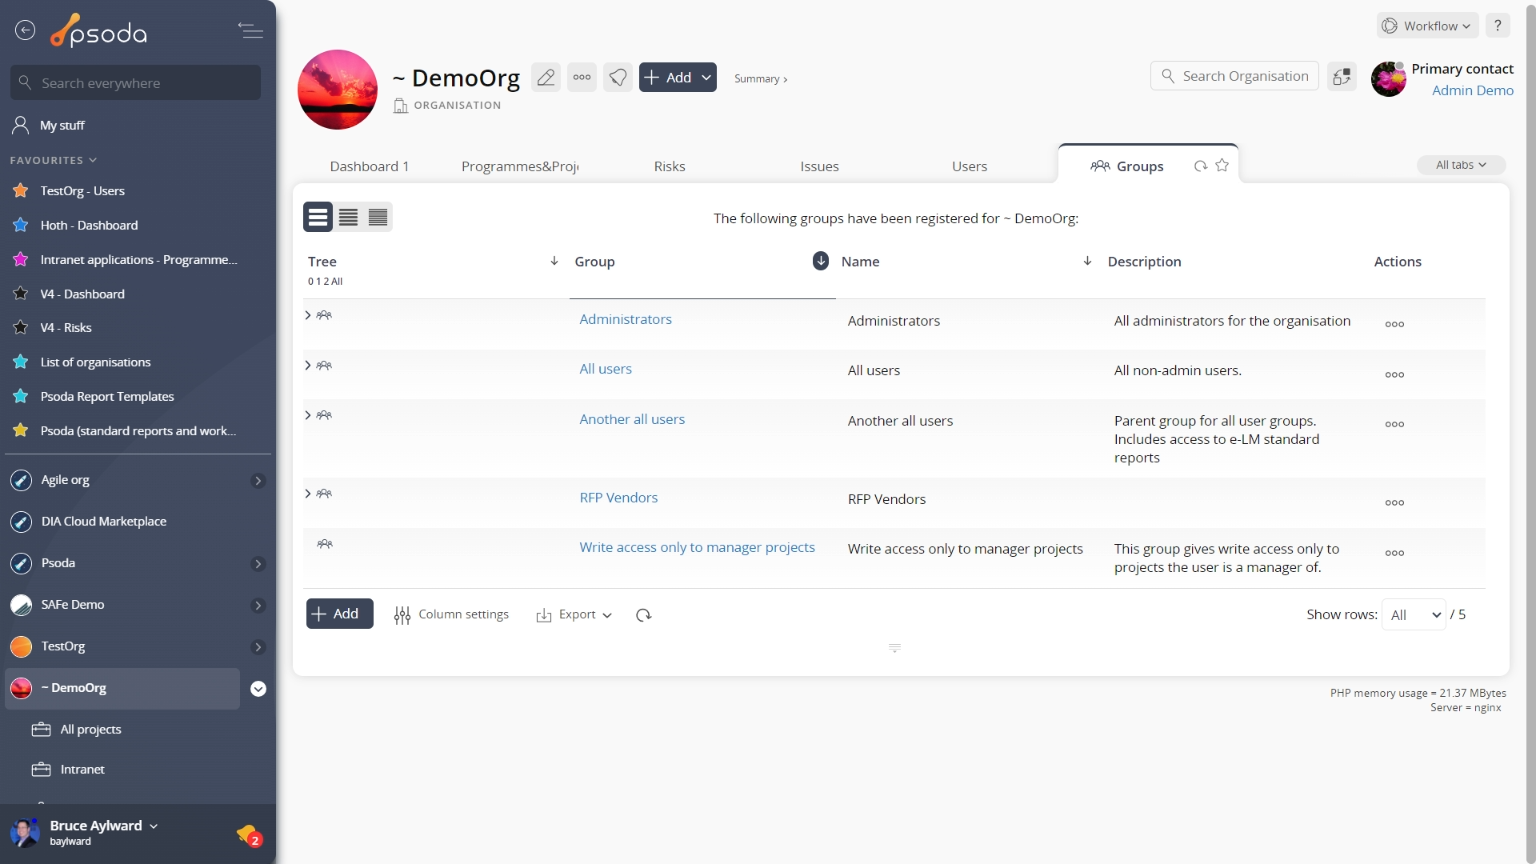
Figure 15 – Organisation groups table
Note that you can customise your table view by clicking the ![]() edit button at the bottom of the groups table or navigate to this same spot to
edit button at the bottom of the groups table or navigate to this same spot to ![]() add more groups to this organisation. Here, you can also export this list to
add more groups to this organisation. Here, you can also export this list to ![]() Excel or
Excel or ![]() CSV files.
CSV files.
 Holiday calendars
This tabbed view shows the holiday calendar table as seen in Figure 16, listing any holiday calendars that have been defined for this organisation. By default, this table shows the name and description of any containing holiday calendars, as well as the users who are members of these holiday calendars.
The Actions column of the holiday calendar table provides accessible functions to act on a chosen holiday calendar. These functions include 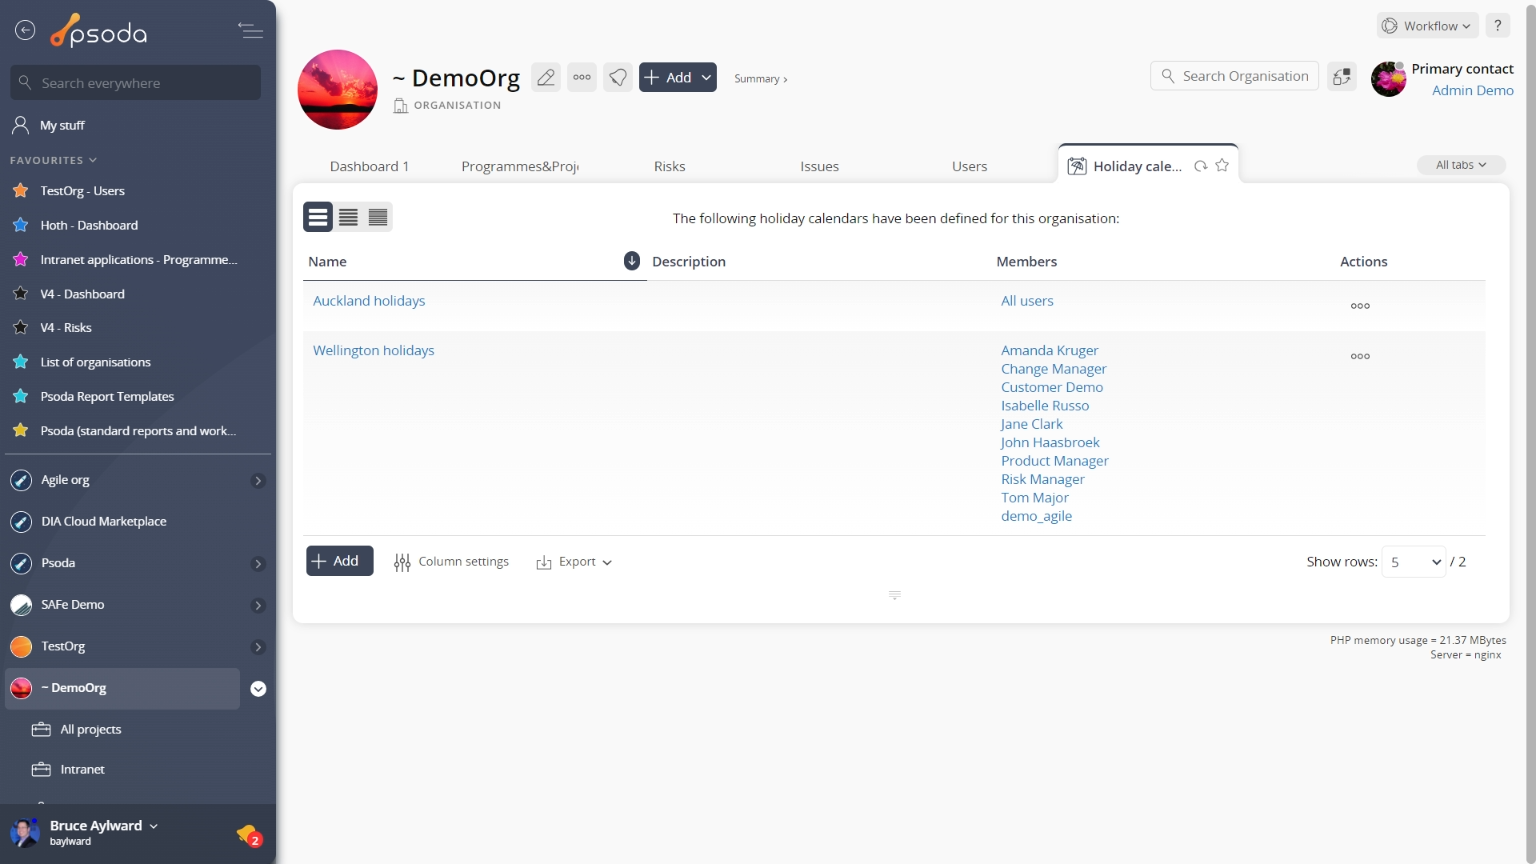 Figure 16 – Organisation holiday calendar table
Note that at the bottom of the table you can ![]() add another holiday calendar,
add another holiday calendar, ![]() edit the table columns to show or hide certain information, or export this holiday calendar list to
edit the table columns to show or hide certain information, or export this holiday calendar list to ![]() Excel or
Excel or ![]() CSV files.
CSV files.
 Indicators
This tabbed view shows the indicator table as seen in Figure 17, listing any indicators that have been defined for this organisation. By default, this table shows the name and description of any containing indicators, the classes (areas that this indicator applies to in Psoda) and whether this is a read-only indicator.
The Actions column of the indicator table provides accessible functions to act on a chosen indicator. These functions include 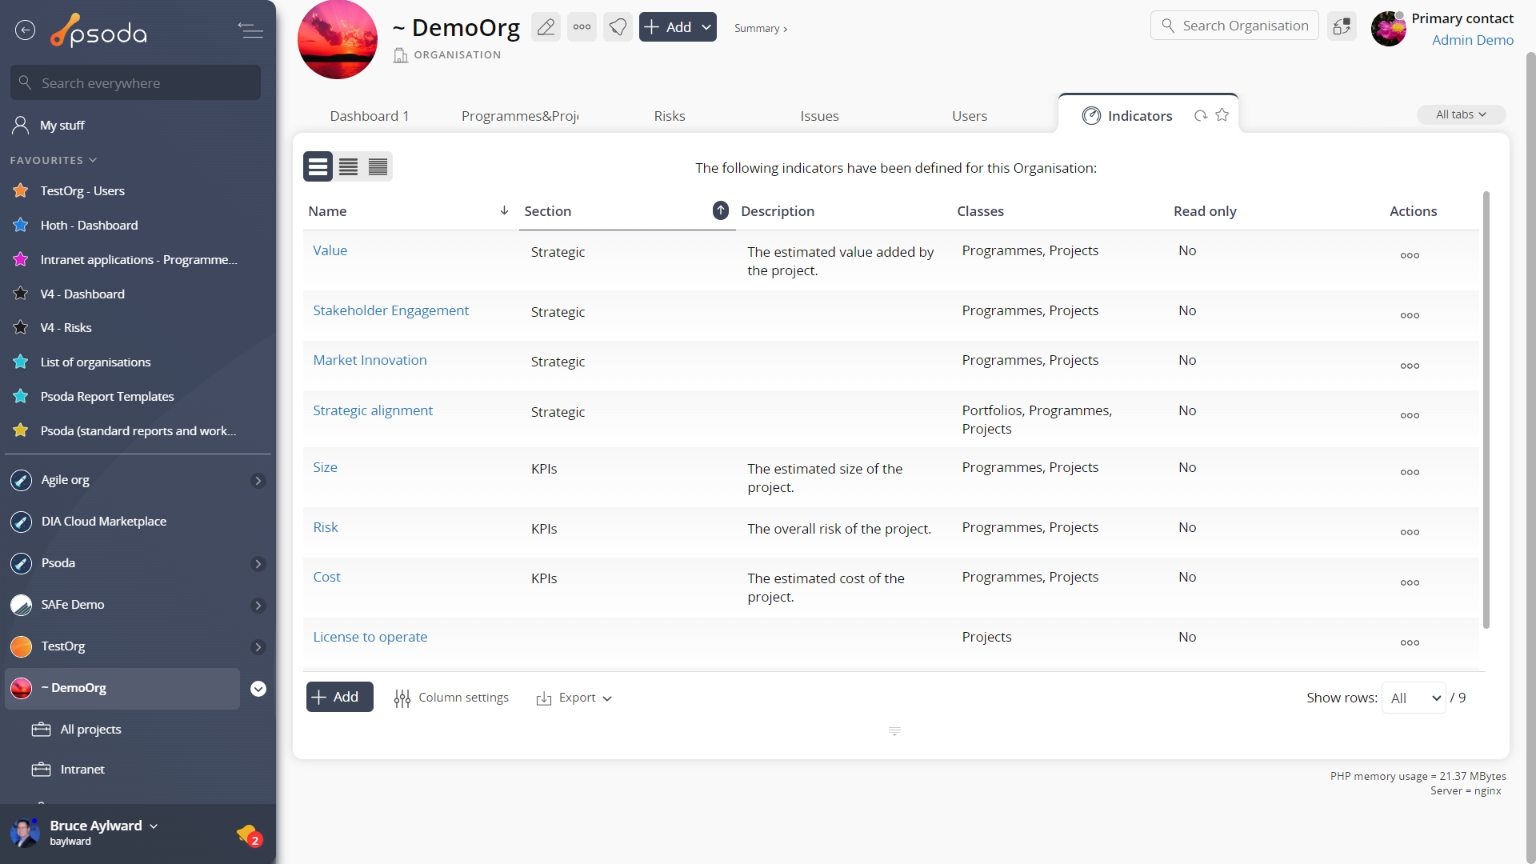 Figure 17 – Organisation indicator table
 Issues
This tabbed view shows the issues table as seen in Figure 18, listing any issues that have been logged for this organisation. By default, this table provides impact and priority information, plan progress and resolution dates for the issues listed, as well as any actions that can be taken. The workflow column also provides information as to the next workflow transitions available.
The Actions column of the issues table provides accessible functions to act on a chosen issue. These functions include 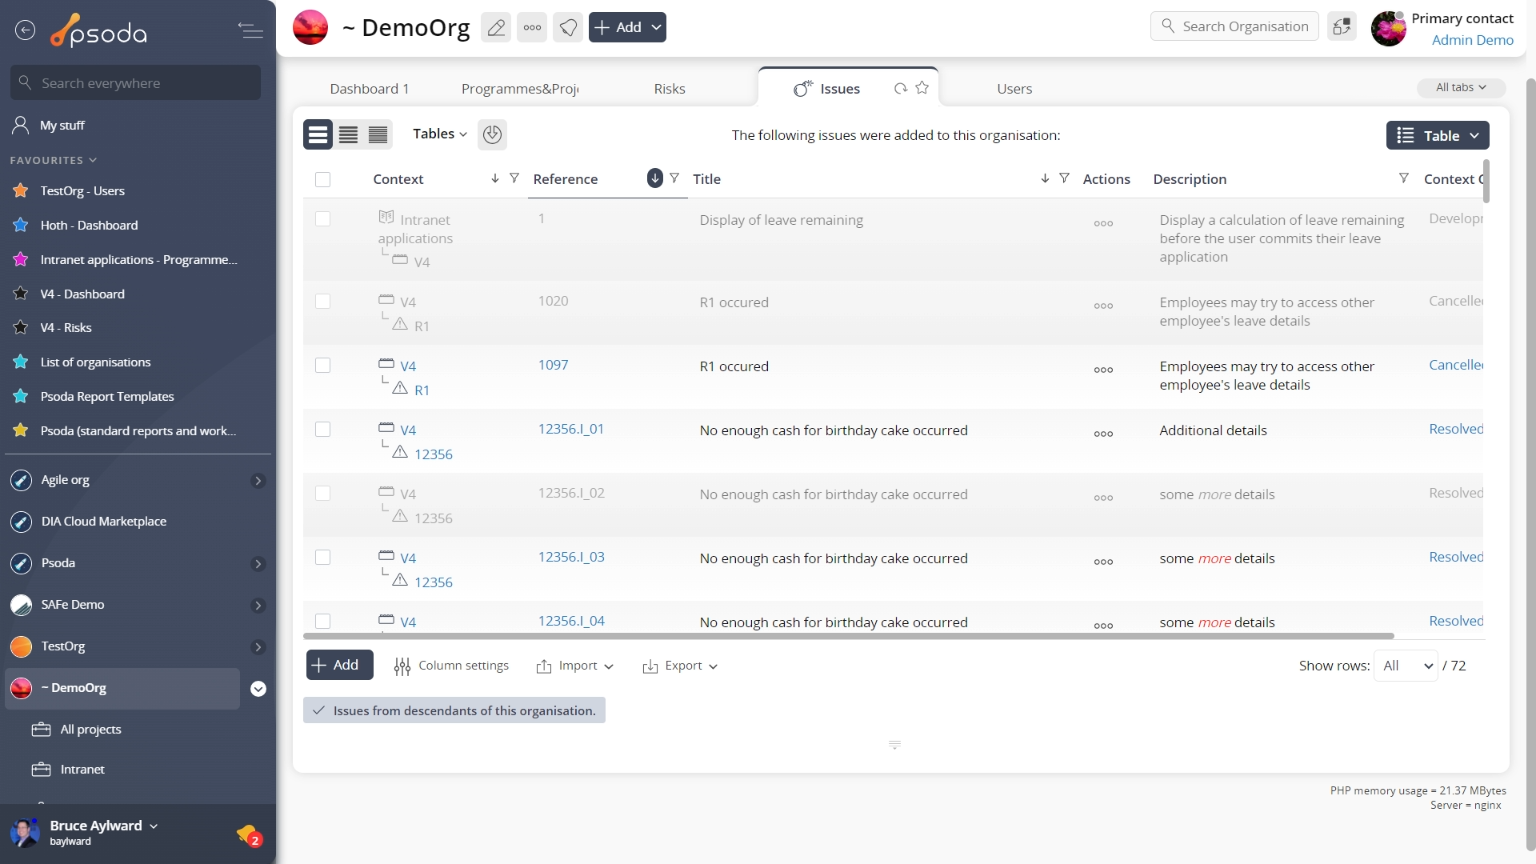
Figure 18 – Organisation issues tab
Note that at the bottom of the table you can Lessons
This tabbed view shows the lessons table as seen in Figure 19, listing any lessons that have been added for this organisation. By default, this table provides a link into a selected lesson itself, as well as providing other information such as the lesson title, description and context. The workflow column also provides information as to the next workflow transitions available, if a workflow has been selected upon lesson creation.
The Actions column of the lessons table provides accessible functions to act on a chosen issue. These functions include 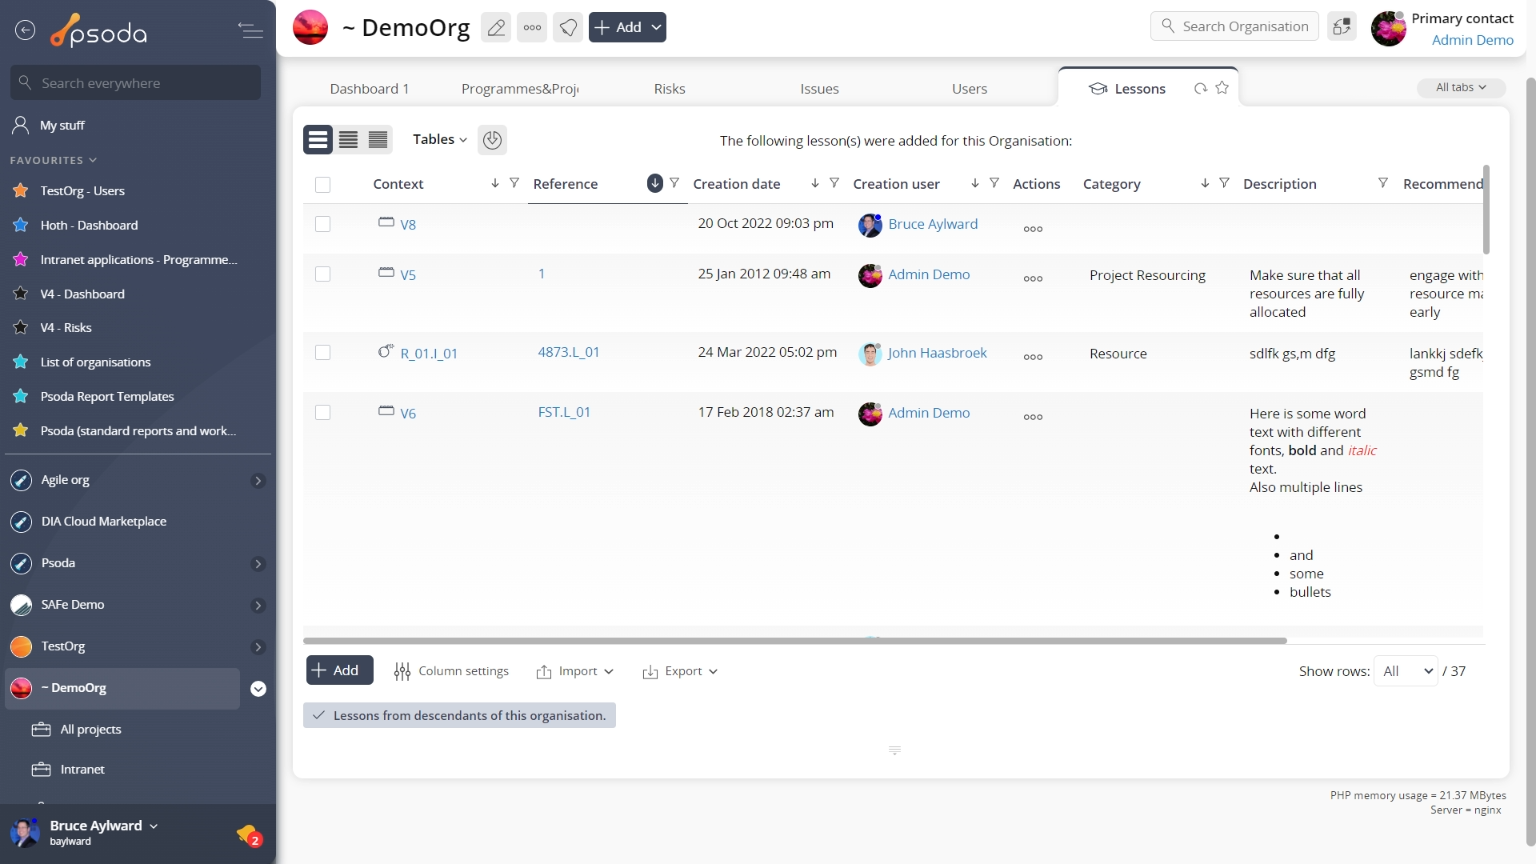 Figure 19 – Organisation lessons tab
 Portfolios
This tabbed view shows the portfolio table as seen in Figure 20, listing any portfolios that have been defined for this organisation. By default, this table shows the name and description of any containing portfolios, as well as any actions that can be taken on a chosen portfolio.
The Actions column of the portfolio table provides accessible functions to act on a chosen portfolio. These functions include 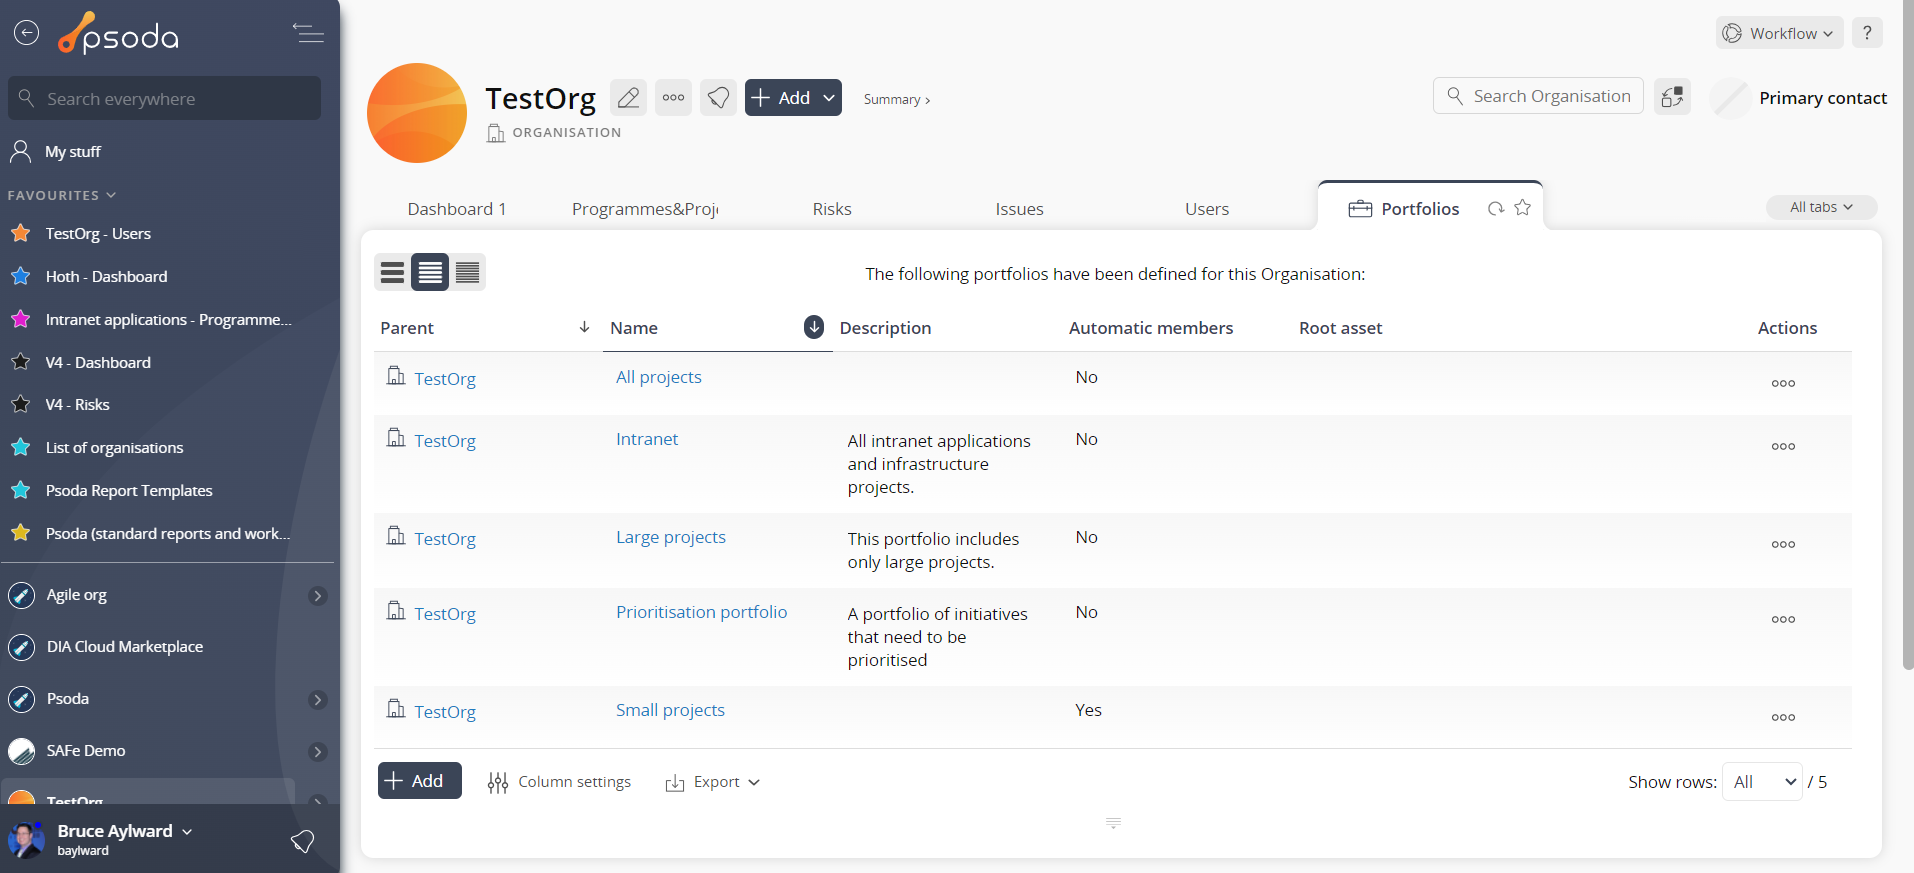 Figure 20 – Organisagtion portfolio table
Note that at the bottom of the table you can ![]() add another portfolio,
add another portfolio, ![]() edit the table columns to show or hide certain portfolio information, or export this portfolio list to
edit the table columns to show or hide certain portfolio information, or export this portfolio list to ![]() Excel or
Excel or ![]() CSV files.
CSV files.
 Programmes & Projects
This tabbed view shows the programmes and projects table as seen in Figure 21, providing a high level overview of the status of each listed programme/project that has been registered for this organisation. It also shows how many sub-programmes, projects and sub-projects are associated with each programme and project, the Red/Amber/Green (RAG) status of the asset, the RAG change, and counters of open items such as actions and risks.
By default, this table view will also show you a checkbox column to allow for multiple selection of assets, estimated effort and cost information, the current state of the asset, any workflow transitions that may become applicable if a workflow has been applied to this asset, and the project type.
The Actions column of this table view provides information about what actions can be taken on the chosen asset. Such actions may include 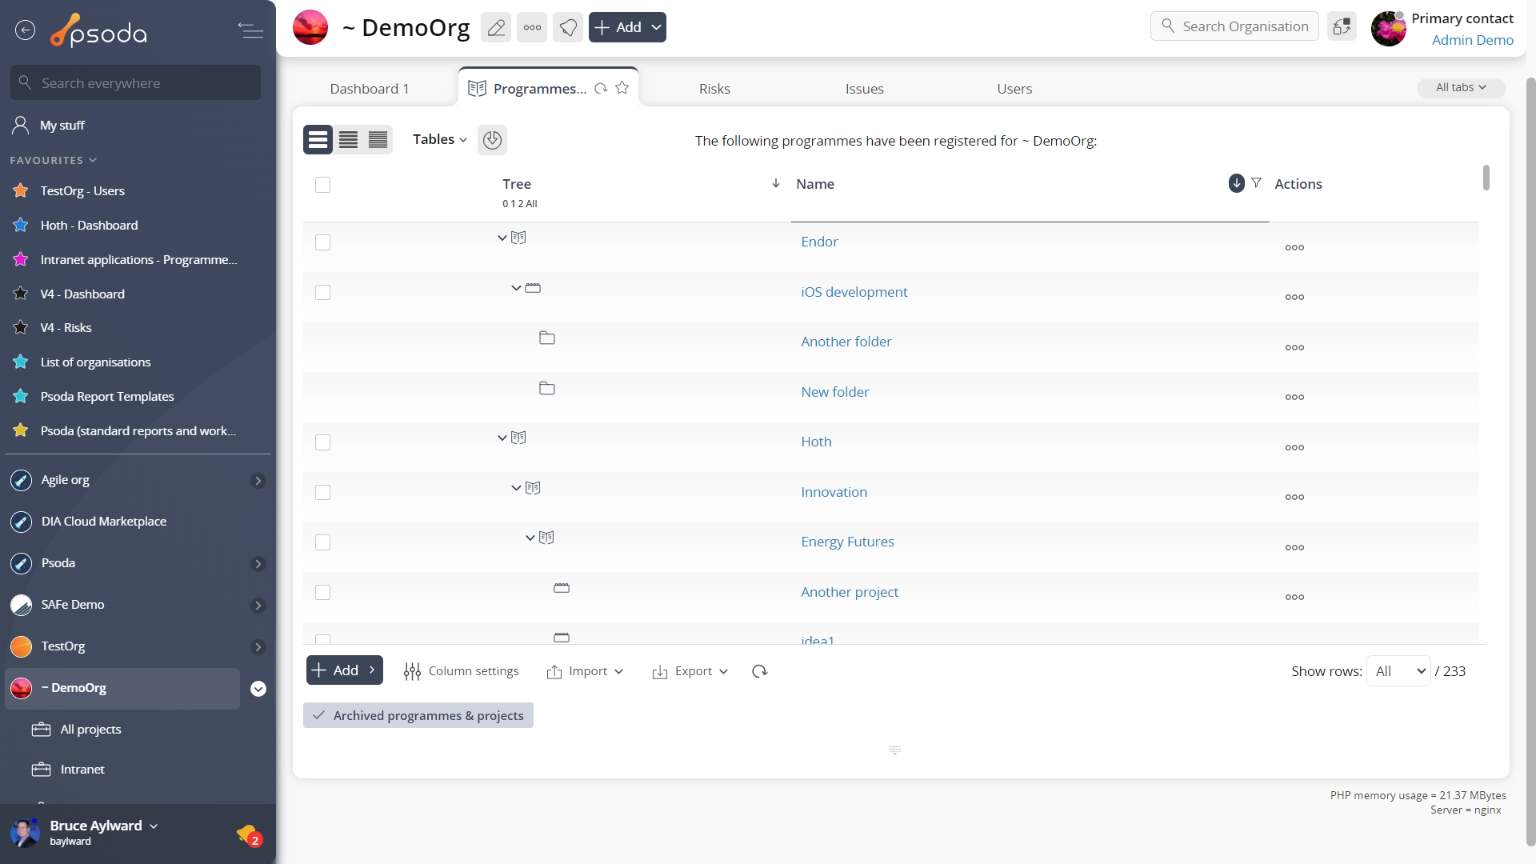
Figure 21 – Organisation programme & project tab
Figure 20 shows that the organisation being viewed contains one programme, containing one project, which in turn contains two sub-projects. Each asset has a RAG status of green, an RAG change indicated if applicable and the parent asset (the programme) has one open action, one open change request and one open defect. Note that at the bottom of this table you can add another Reports
This tabbed view shows a listing of the reports as seen in Figure 22, listing any reports available for this organisation.
Figure 21 shows a portion of this alphabetical listing, and your specific list may vary slightly depending on if your System Administrator has created any new report templates that have been customised to be available to your organisation only.
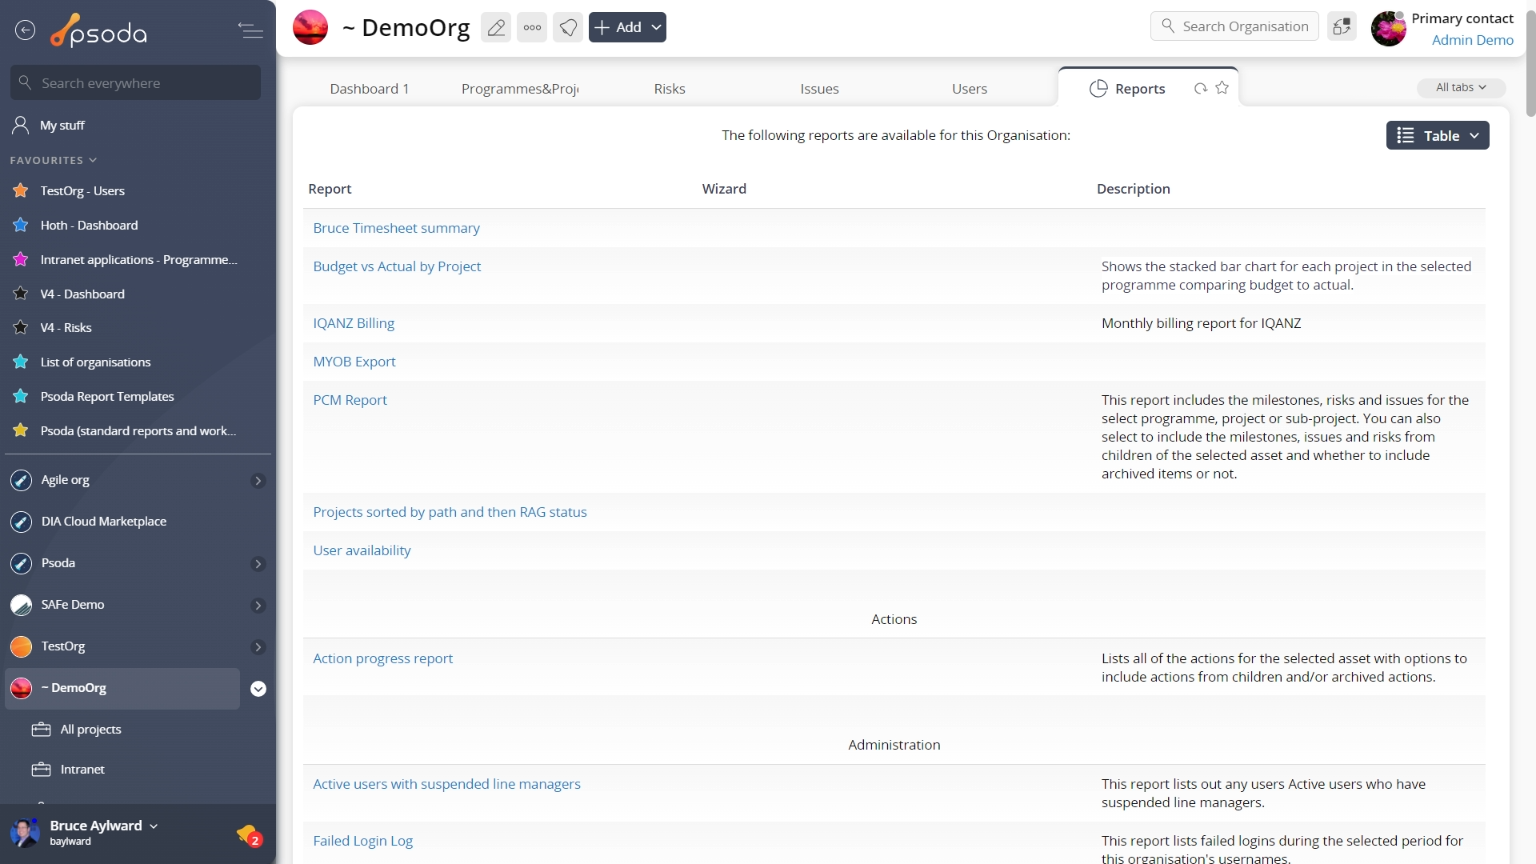
Figure 22 – Organisation report table
This listing is unable to be customised, but provides the name of the report and a more detailed description of what information this report is built for and how the report is grouped.
Once you click on a report’s name, the run report form will popup. These popup forms vary depending on the report being run.
Report templates
This tabbed view shows the report templates table as seen in Figure 23, listing any report templates that have been added to this organisation. By default, this table shows the last time the template was updated, the title, description, status and classes (areas in Psoda that this report template will be available) of each template.
The Actions column of the report template table provides accessible functions to act on a chosen template. These functions include 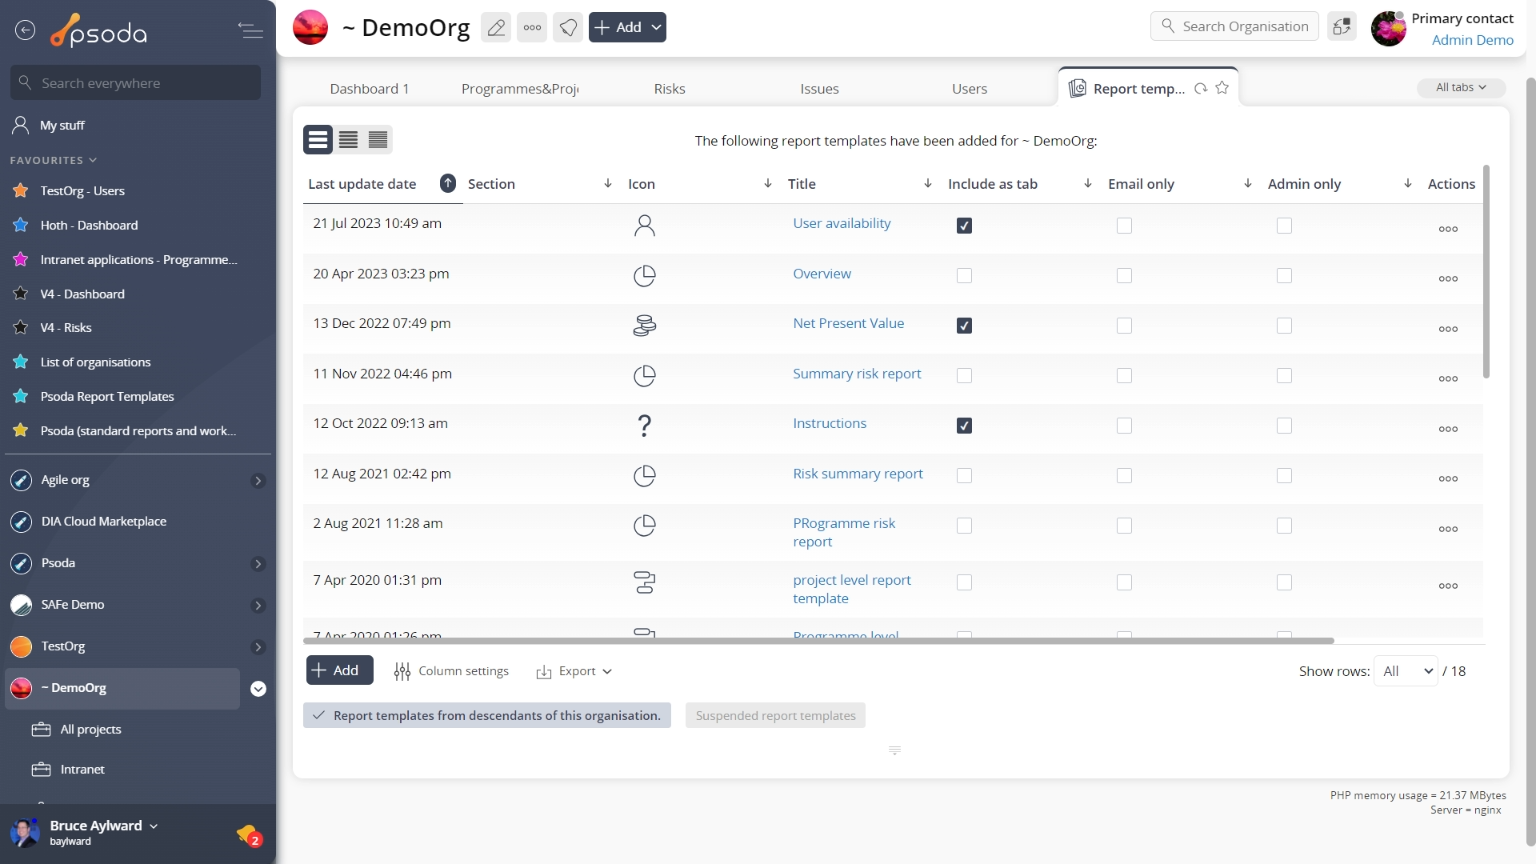
Figure 23- Organisation report template table
Note that at the bottom of the table you can ![]() add another single template,
add another single template, ![]() edit the table columns to show or hide certain template information, or export this template list to
edit the table columns to show or hide certain template information, or export this template list to ![]() Excel or
Excel or ![]() CSV files.
CSV files.
 Risks
Risks
This tabbed view shows the risks table as seen in Figure 24, listing any risks that have been logged for this organisation. By default, you will be shown the risk’s context, reference, title, description, proximity, any workflow transitions that may be available and other details also captured in the screenshot below.
The Actions column of this table provides accessible functions to act on a chosen role. These functions include 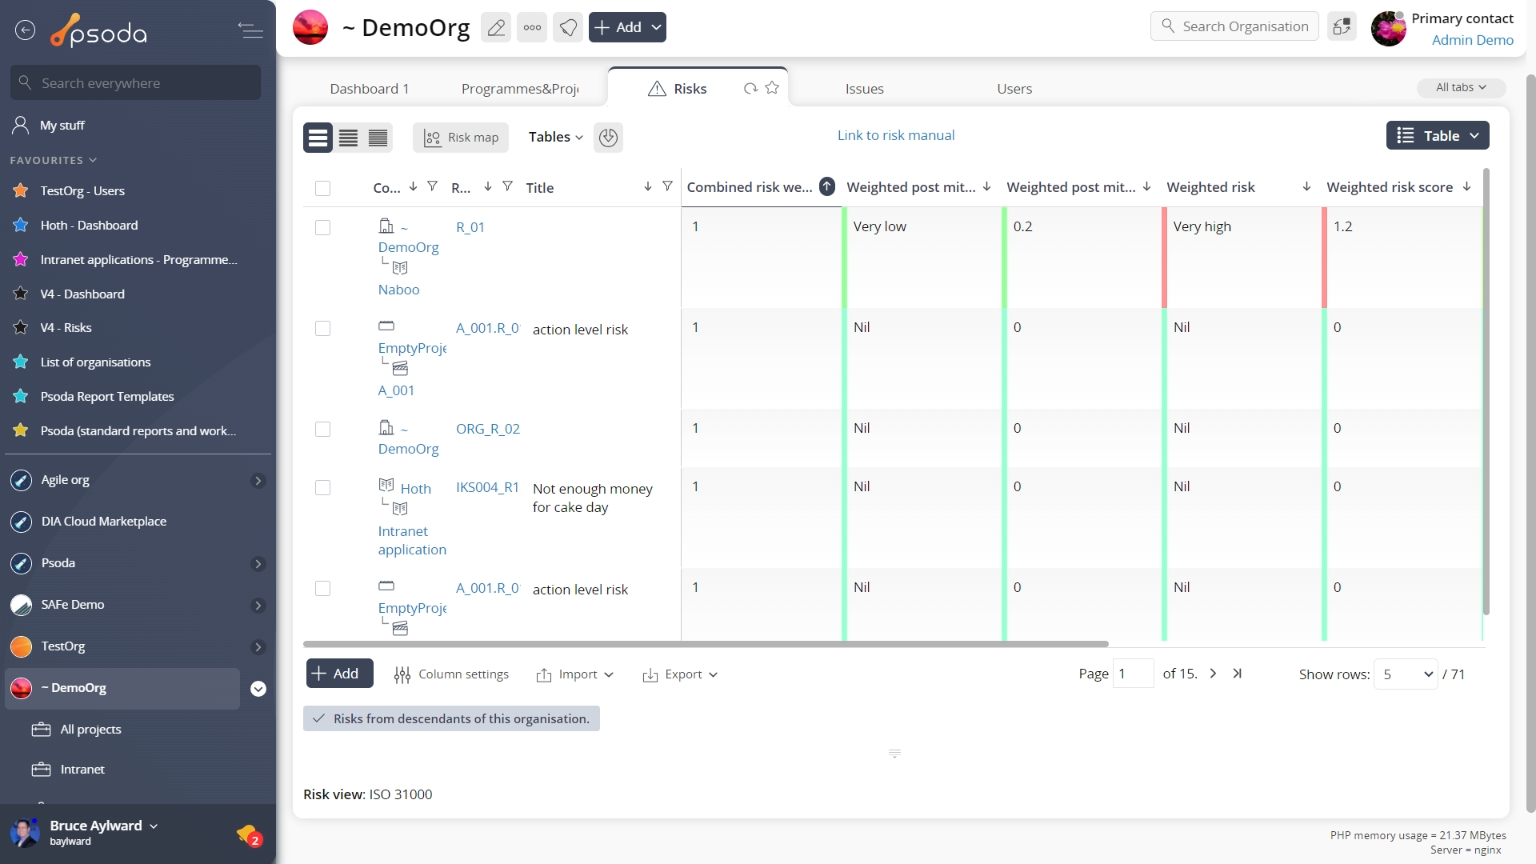
Figure 24 – Organisation risk tab
Note that at the bottom of this table you can Risk distribution
Instead of a table view, this tab provides a graphical view of the distribution of risks in this organisation. The risk distribution chart is generated from the information you put in the risks table.
This interactive chart shown in Figure 25 incorporates a mouse over function so that as you hover the mouse over a blue dot shows a list of risks that are at that point will be shown on right-most side of the chart.
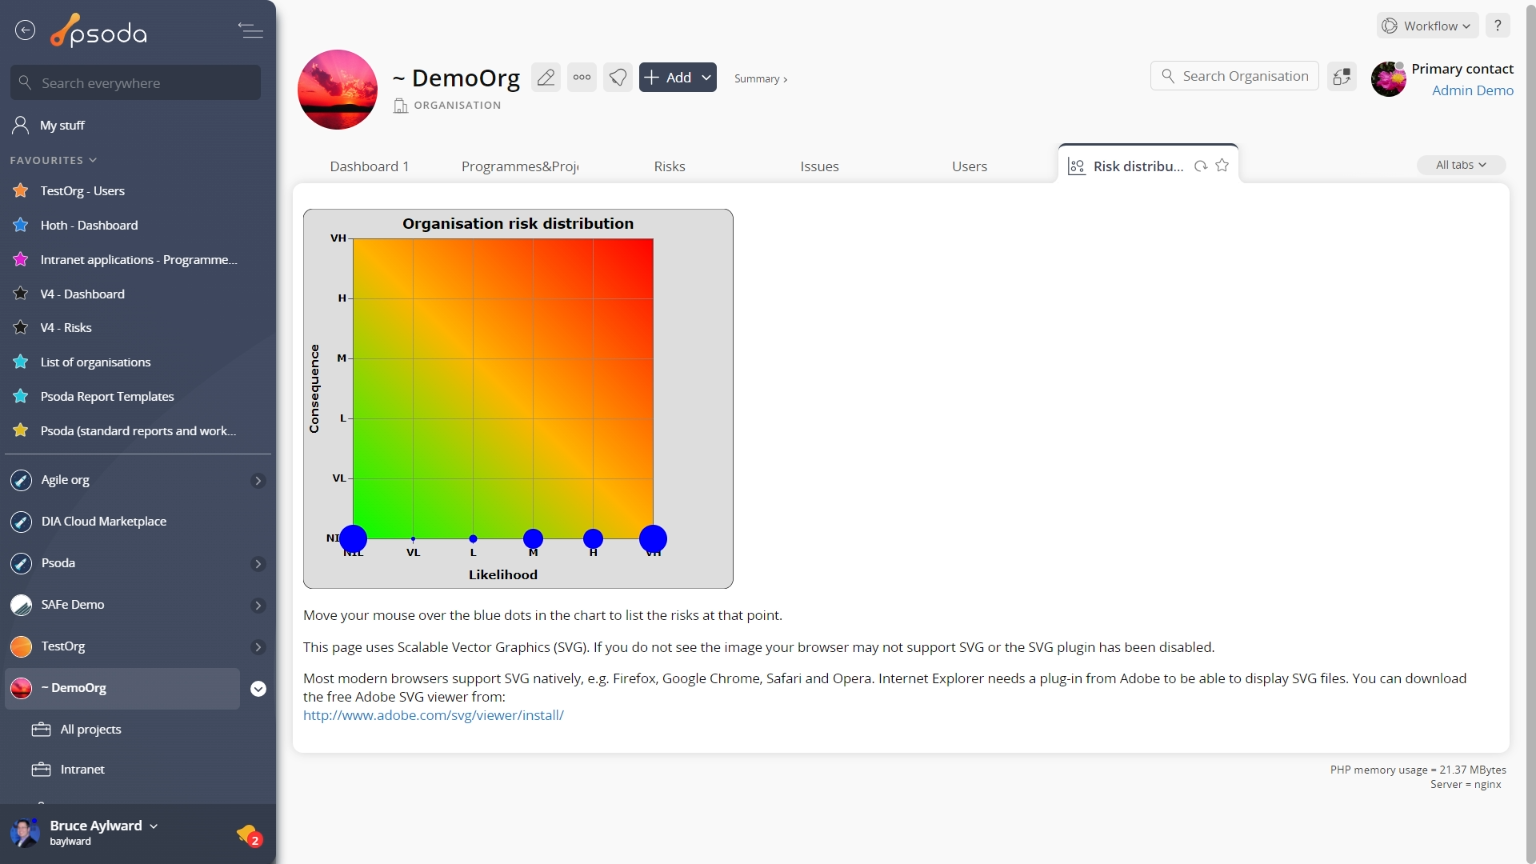 Figure 25 – Organisation risk distribution chart tab
At the very bottom of this tabbed view you have the option to decrease/increase the number of risks depicted by selecting the hide/include risks for programmes, projects and sub-projects link.
Please note that this page uses Scalable Vector Graphics (SVG). If you do not see the image your browser may not support SVG or the SVG plugin has been disabled. Most modern browsers support SVG natively, e.g. Firefox, Google Chrome, Safari and Opera. Internet Explorer needs a plug-in from Adobe to be able to display SVG files. You can download the free Adobe SVG viewer from: http://www.adobe.com/svg/viewer/install/ Roles
This tabbed view shows the roles table as seen in Figure 26, listing any roles that have been defined for this organisation. By default, you will be shown the role’s name, description and editable daily and hourly rates for members of this role, along with a list of users who are members of this role.
The Actions column of this table provides accessible functions to act on a chosen role. These functions include 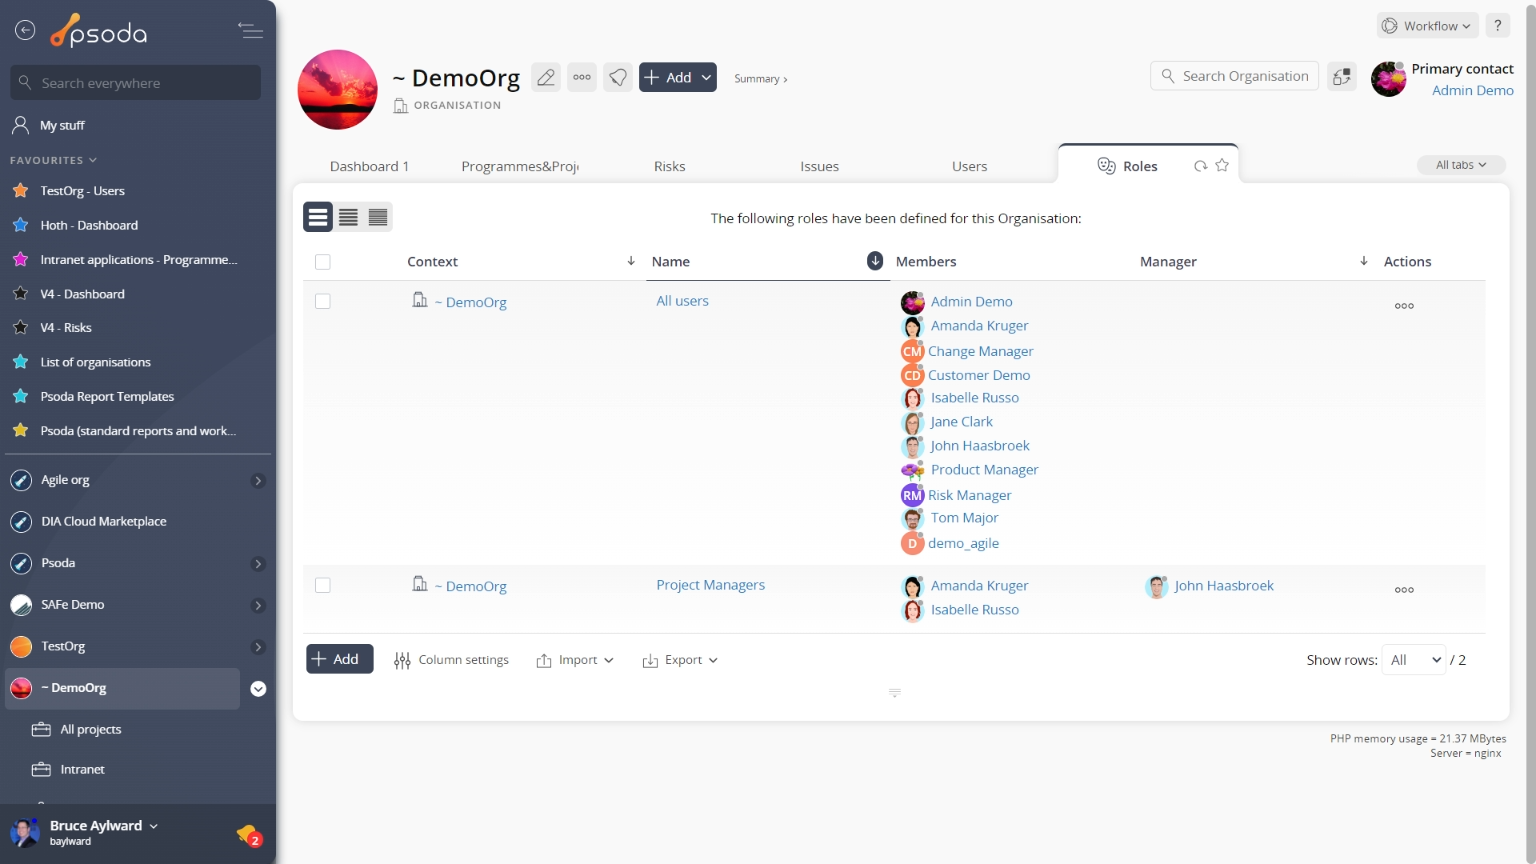
Figure 26 – Organisation roles table
Note that at the bottom of this table you can ![]() add another single role,
add another single role, ![]() edit the table columns to show or hide role information, or export this role list to
edit the table columns to show or hide role information, or export this role list to ![]() Excel or
Excel or ![]() CSV files.
CSV files.
 Schedule
This tabbed view shows the tasks and milestones table as seen in Figure 27, listing any task groups, tasks and milestones that have been defined for this organisation By default, you will have a non-billable tasks group folder already in this listing, containing leave and public holidays.
By default, this table includes the reference, title and description of the task, task group or milestone, important scheduling information, who the asset is allocated to, along with the available actions that can be taken on the listed asset and any tasks or milestones that have to be completed first.
The Actions column of this table provides accessible functions to act on a chosen task group, task or milestone. These functions may include 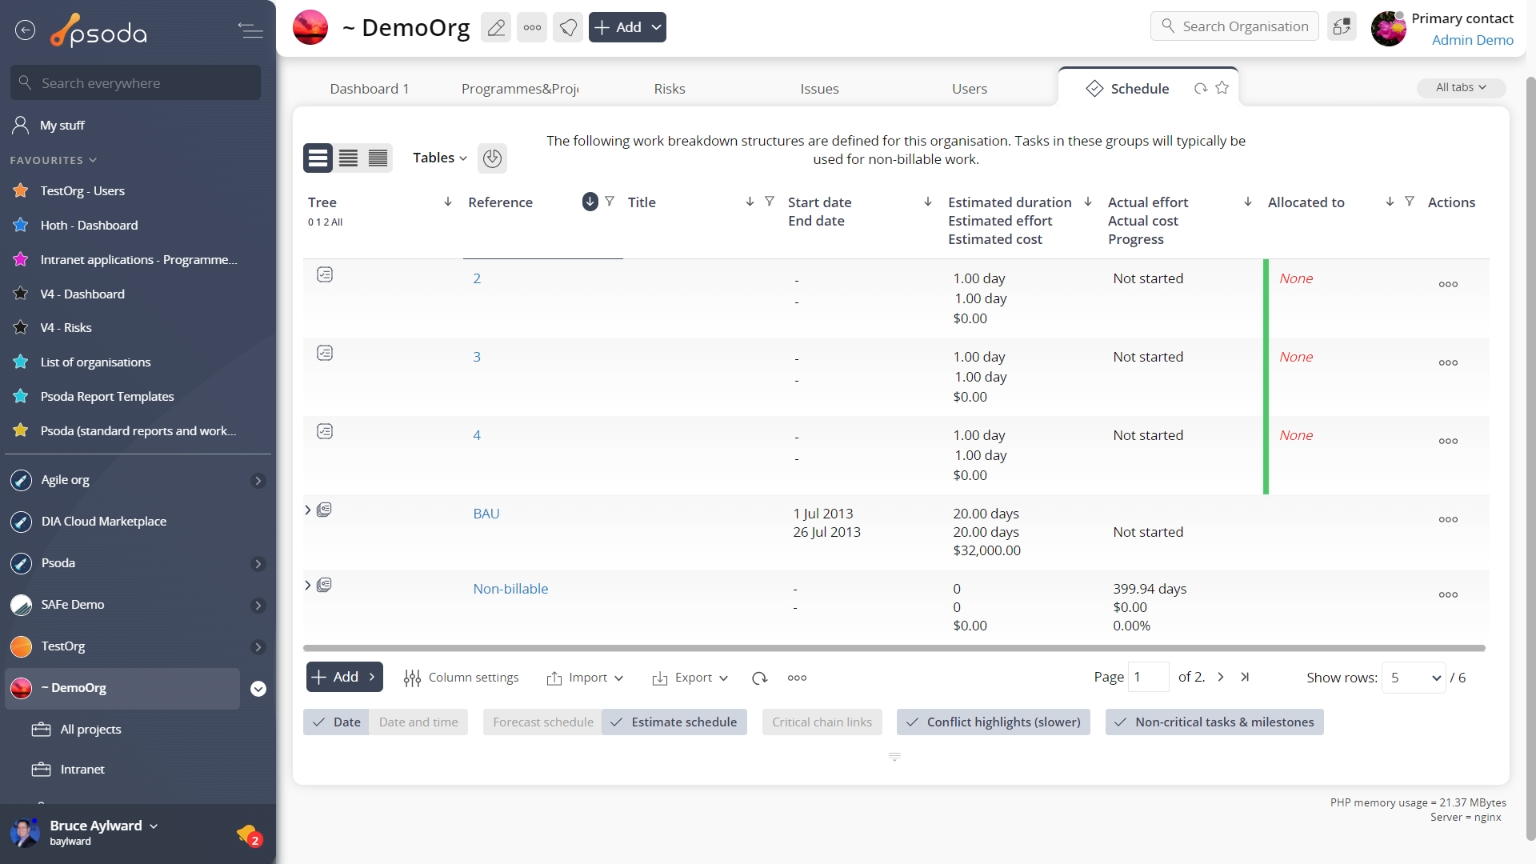
Figure 27 – Organisation tasks and milestones tab
Note that at the bottom of this table you can add another ![]() task group,
task group, ![]() task or
task or ![]() milestone,
milestone,![]() edit the table columns to show or hide asset information, or export this information to
edit the table columns to show or hide asset information, or export this information to ![]() Excel or
Excel or ![]() CSV files.
CSV files.
At the very bottom of this tabbed view you are presented with a number of table information formatting options which will increase/decrease the information you’re presented with, as well as other options to import task group/WBS information, view the information in a GANTT format or run a recalculation.
 Users
Users
This tabbed view shows the users table as seen in Figure 28, listing any users that have been registered for this organisation By default, you will be shown whether a particular user is currently online, the last time they accessed Psoda, their username, status and other details captured in Figure 28.
You can click on the user’s username to go to the user view page and act from their, alternatively the Actions column of this table provides accessible functions to act on a chosen user. These functions include 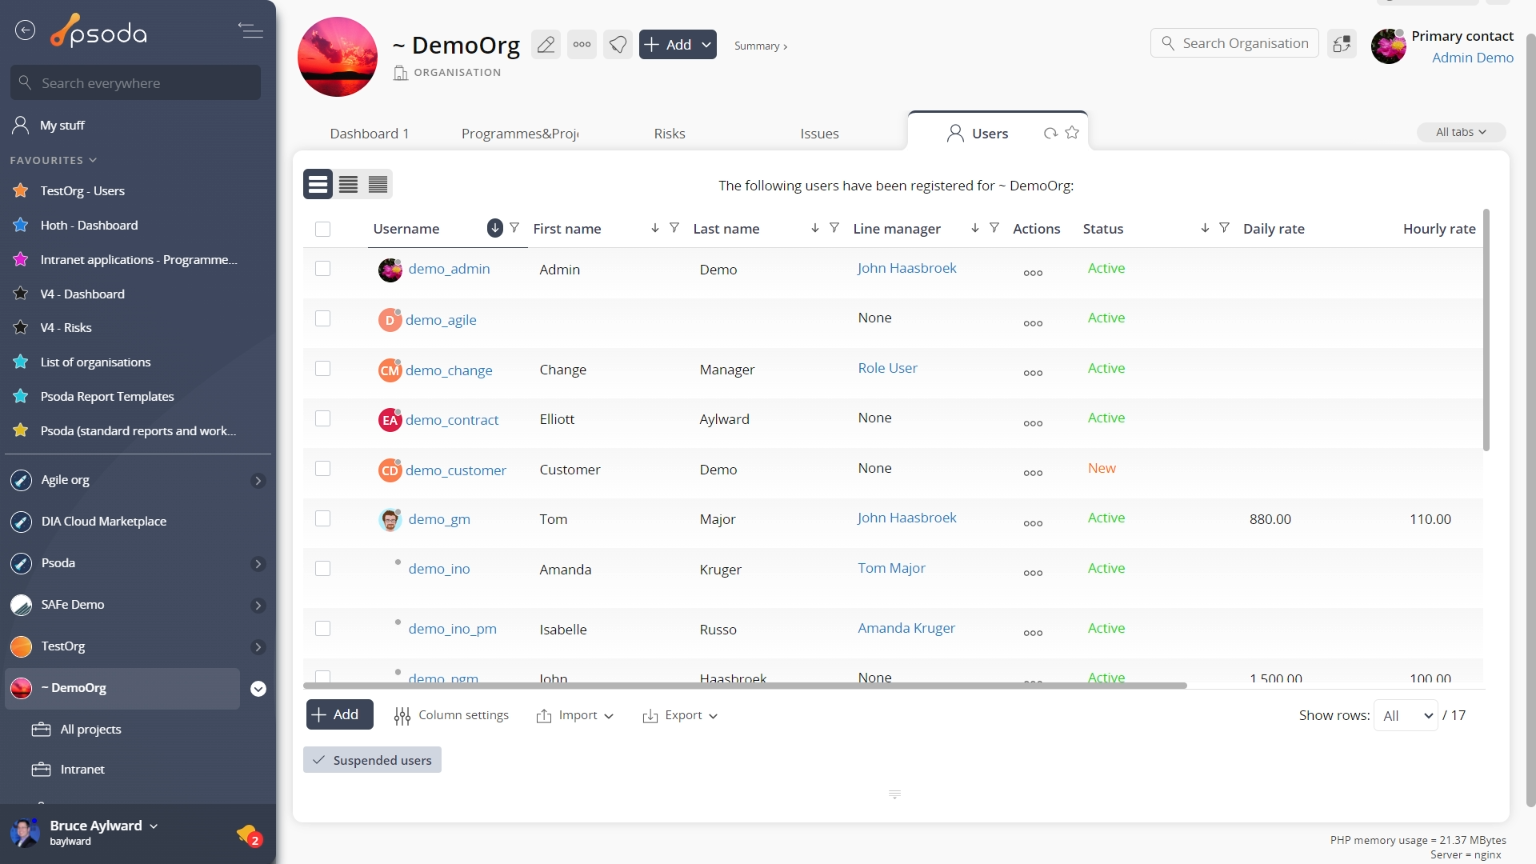
Figure 28- Organisation users table
Note that at the bottom of this table you can Vendors
This tabbed view shows the vendors table as seen in Figure 29, listing any vendors that have been defined for this organisation By default, you will be shown the name and description of the vendor, along with the available actions that can be taken on the listed vendors and any workflow transitions if a workflow has been assigned.
From the Actions column of this table, you can 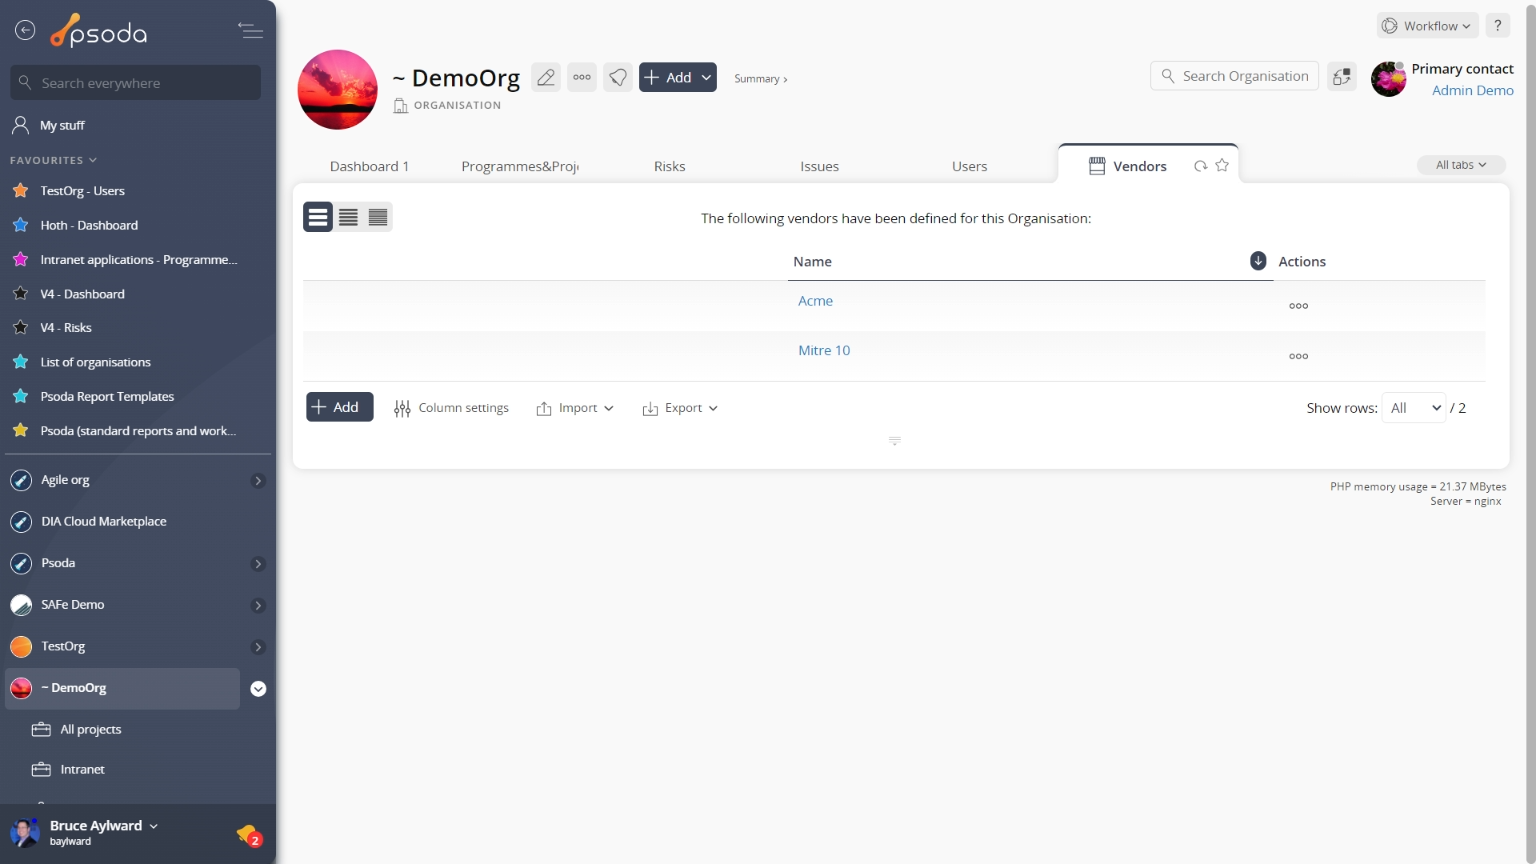
Figure 29- Organisation vendors table
Note that at the bottom of this table, you can Workflows
This tabbed view shows the workflows table as seen in Figure 30 listing any workflows that have been added to this organisation By default, this table shows the title, the description and the status, class and default of each workflow.
The Actions column of the workflow table provides accessible functions to act on a chosen workflow. These functions include 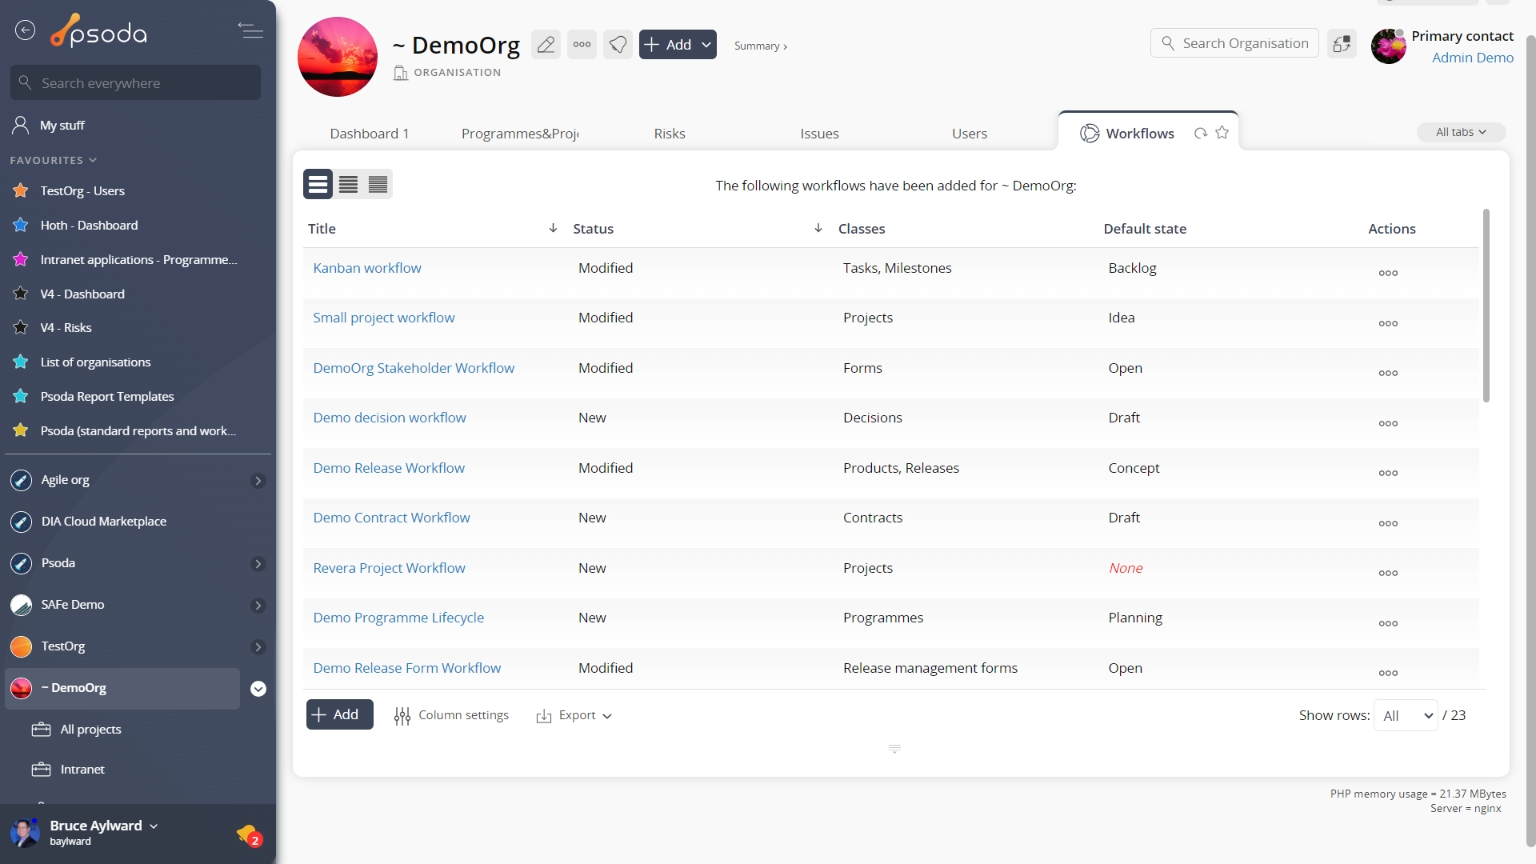
Figure 30- Organisation workflow table
Note that at the bottom of the table you can ![]() add another workflow,
add another workflow, ![]() edit the table columns to show or hide certain workflow information, or export this workflow list to
edit the table columns to show or hide certain workflow information, or export this workflow list to ![]() Excel or
Excel or ![]() CSV files.
CSV files.
Organisational chart
This tab shows the hierarchical relationships between users in your organisation. You can show/hide the delegates of a user by clicking the + or – buttons under each user card. You can set the overall depth of the chart using the input field at the bottom of the page. You can right click on a user card to either move (set line manager), detach (remove line manager), or delete the user, and click the “View” button to view more details about the user. You can click and drag to explore the chart, scroll with your mouse or use the scroll bar on the right, enter full screen with the button in the top right, resize the chart with the handle in the bottom right, and reset the position of the chart with the “Centre” button in the top left. If you would like to save this chart you can do so by clicking on the settings button in the top left and enabling “display static image”. You can then right-click this image to save it.
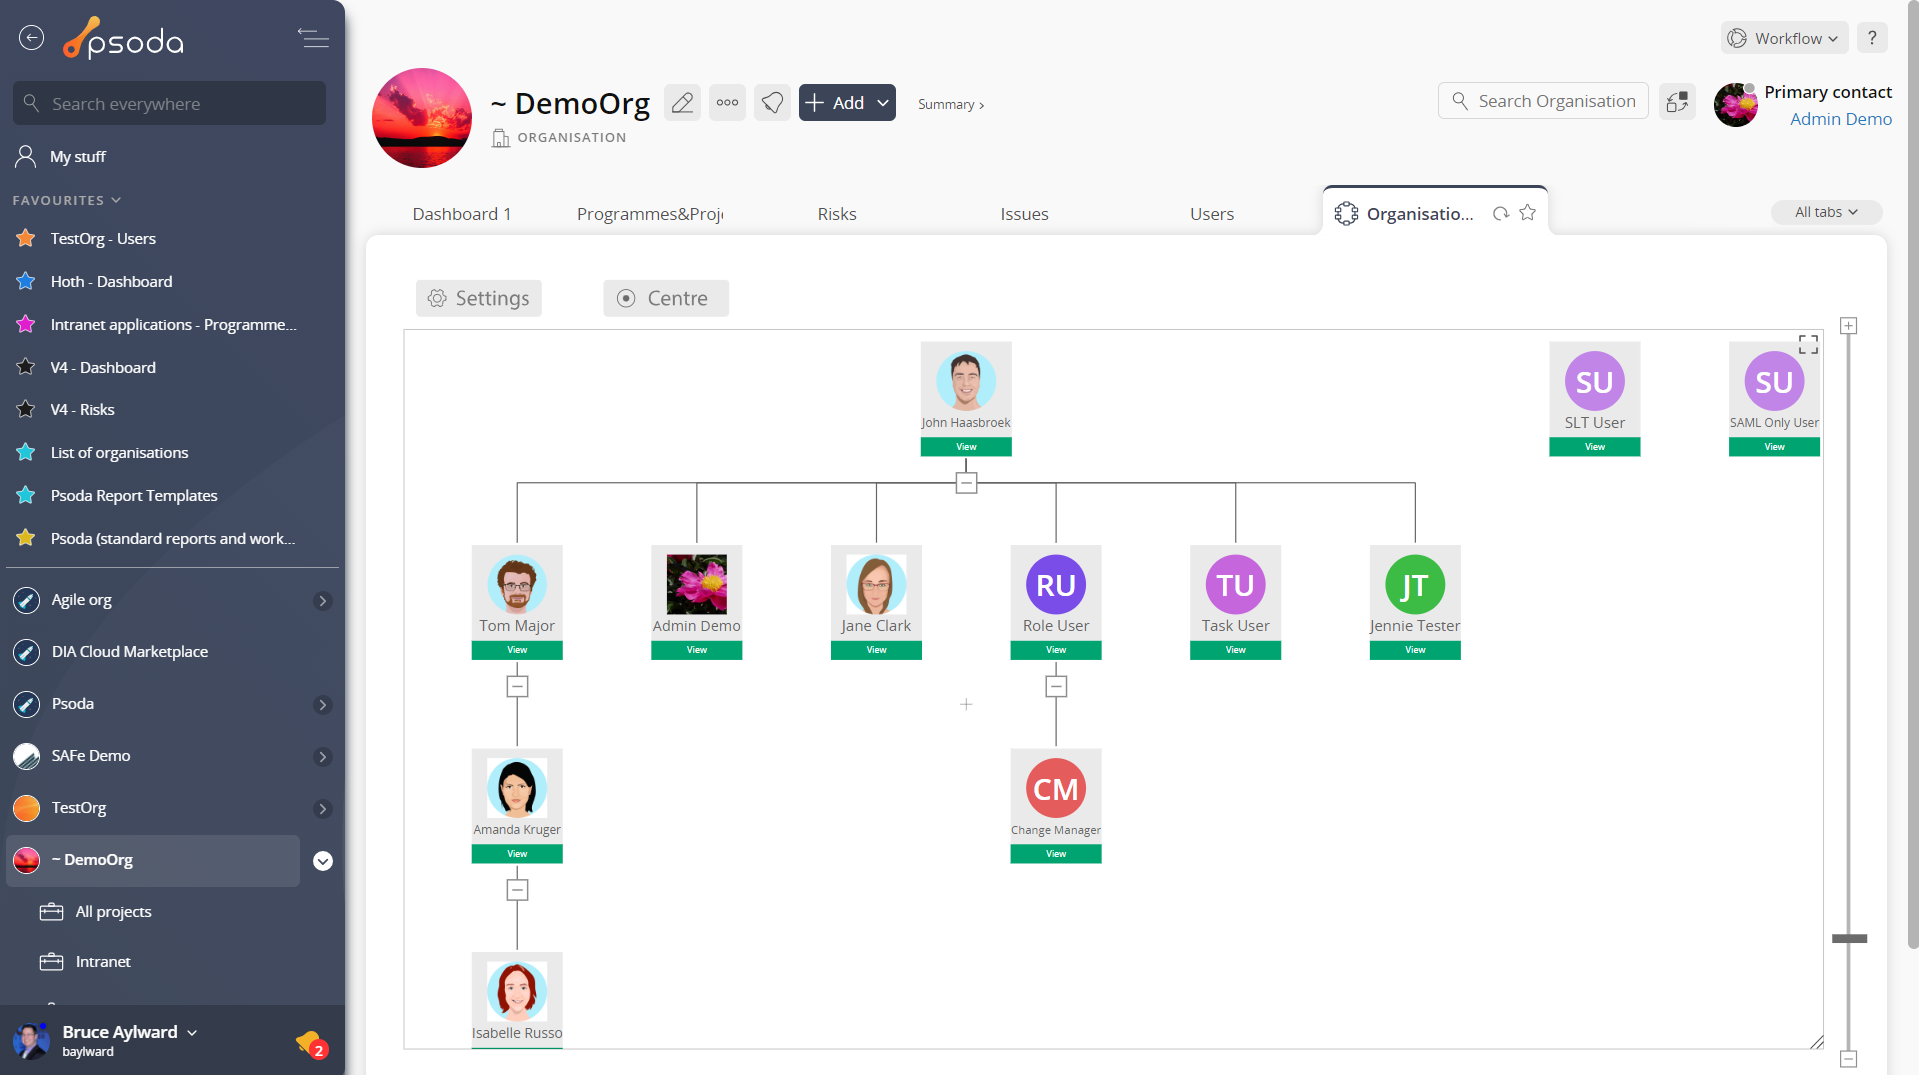
Figure 31- Organisational chart tab
Risk maps
This tab shows the organisations configuration of the risk matrix. Showing the mapping of consequence and likelihood to an overall risk level. For example if you have a high consequence and a medium likelihood then the intersection shows you would get an overall risk score of low.
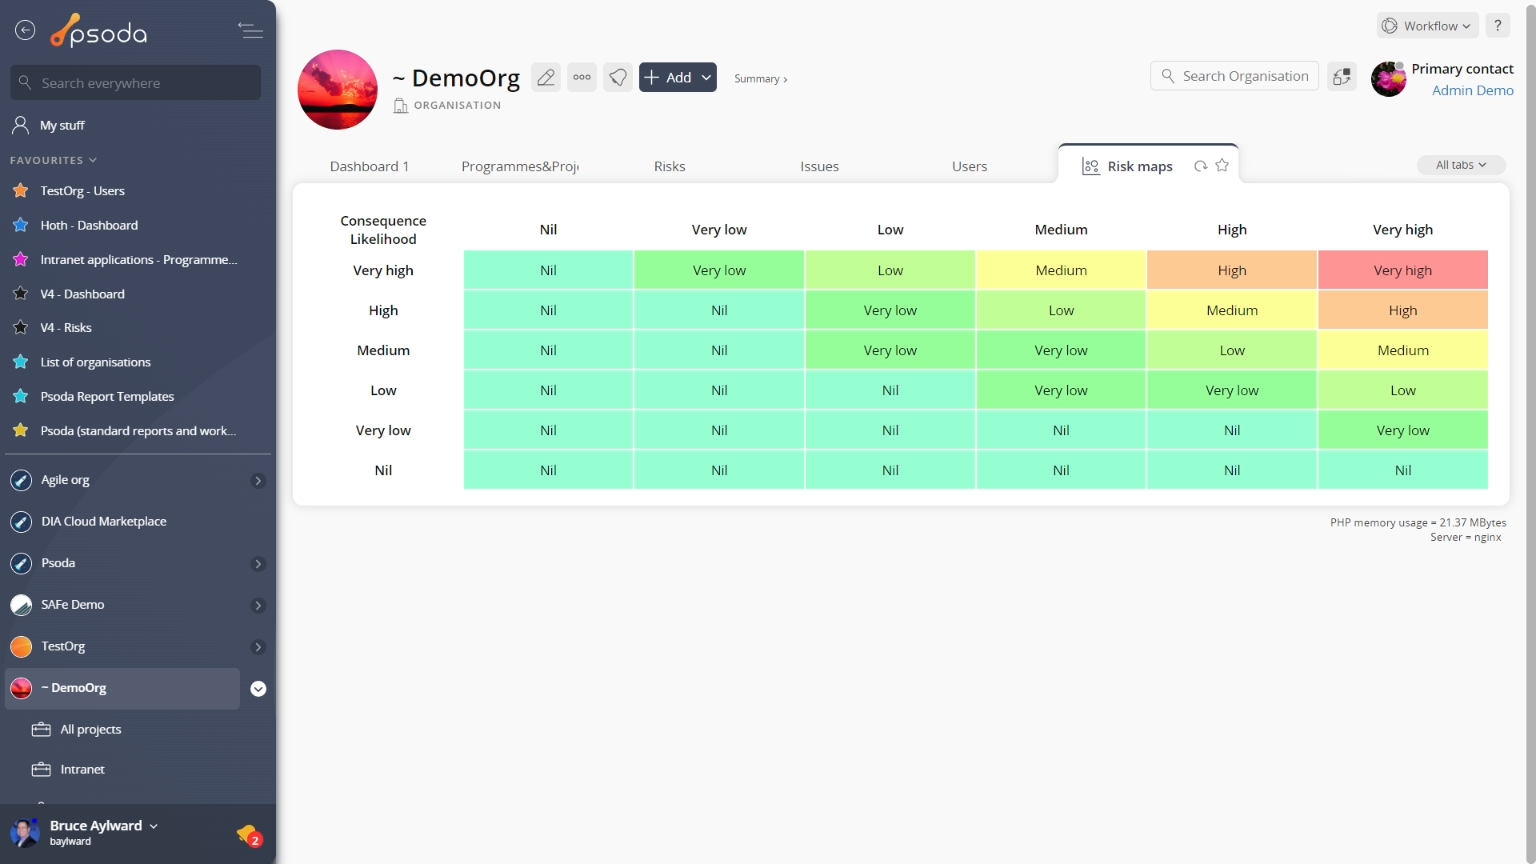
Figure 32- Organisational risk map tab
Related topics
- Organisations
- Edit organisation form
- Delete organisation form
- Actions
- Asset listing
- Attachments
- Benefits
- Contracts
- Custom fields
- Deleted assets
- Dependency matrix
- Expenses
- GANTT
- Groups
- Holiday calendars
- Indicators
- Issues
- Lessons
- Milestones
- Portfolios
- Programmes
- Reports
- Report templates
- Risks
- Risk distribution
- Roles
- RSS feeds
- Tasks
- Users
- Vendors
- WBSs / Task groups
- Workflows