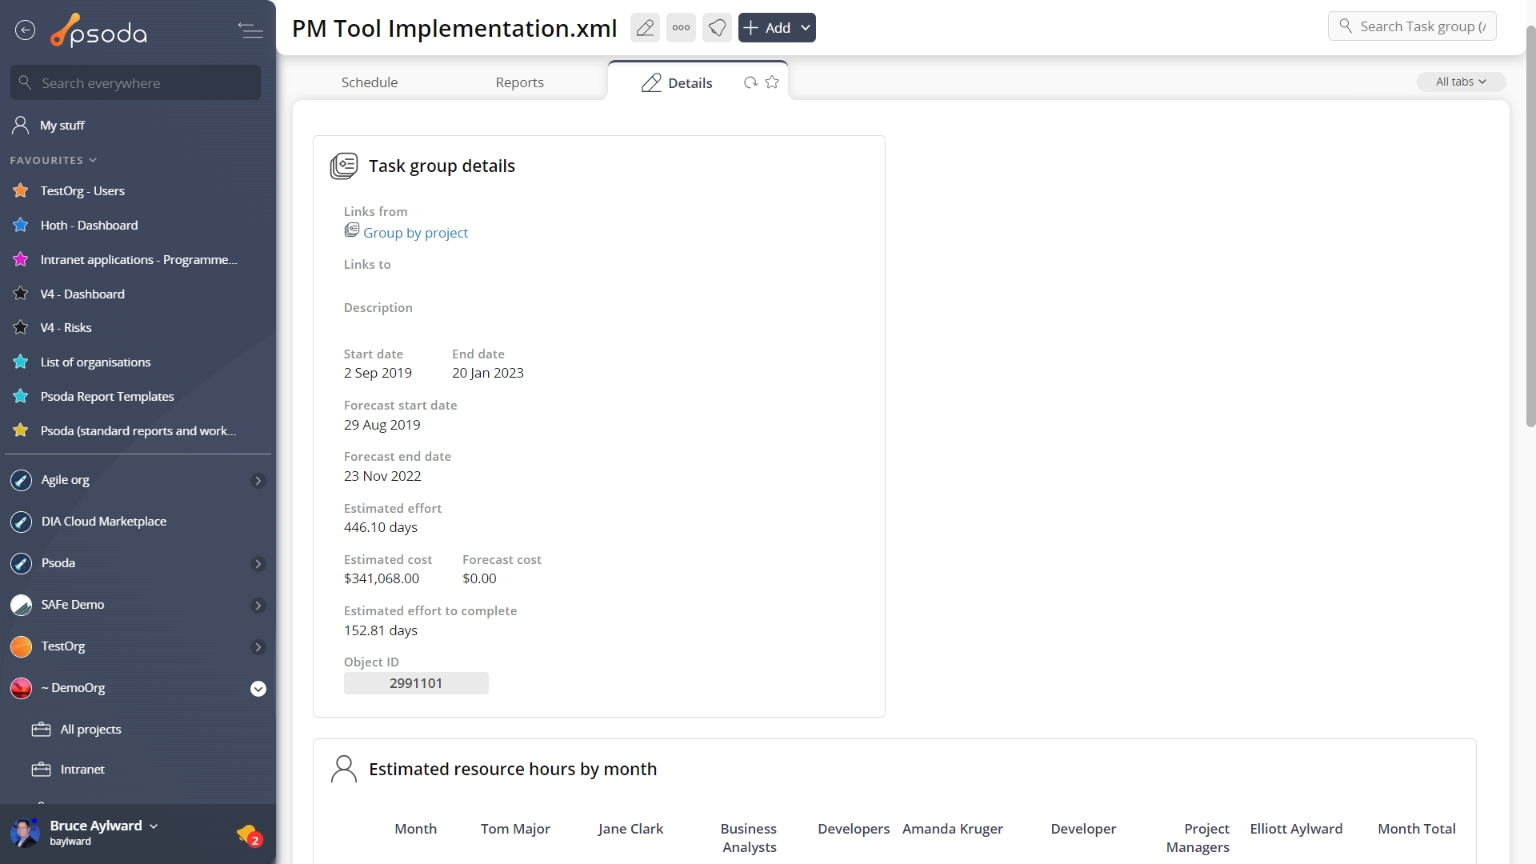
Figure 1 – Task group view page
The top header area allows you to Advanced estimates
This tab shows an asset listing of all of the tasks that have been added to this task group that are scheduled according to advanced estimates, as shown in Figure 2. By default, this table will present you with a number of details about the advanced estimates such as it’s context, reference, start and end dates, the users listed as resources for that estimate, resource total and a breakdown of actual and variance comparisons for time breakdowns.
From the Actions column of this advanced estimates table, you can act on individual estimate by 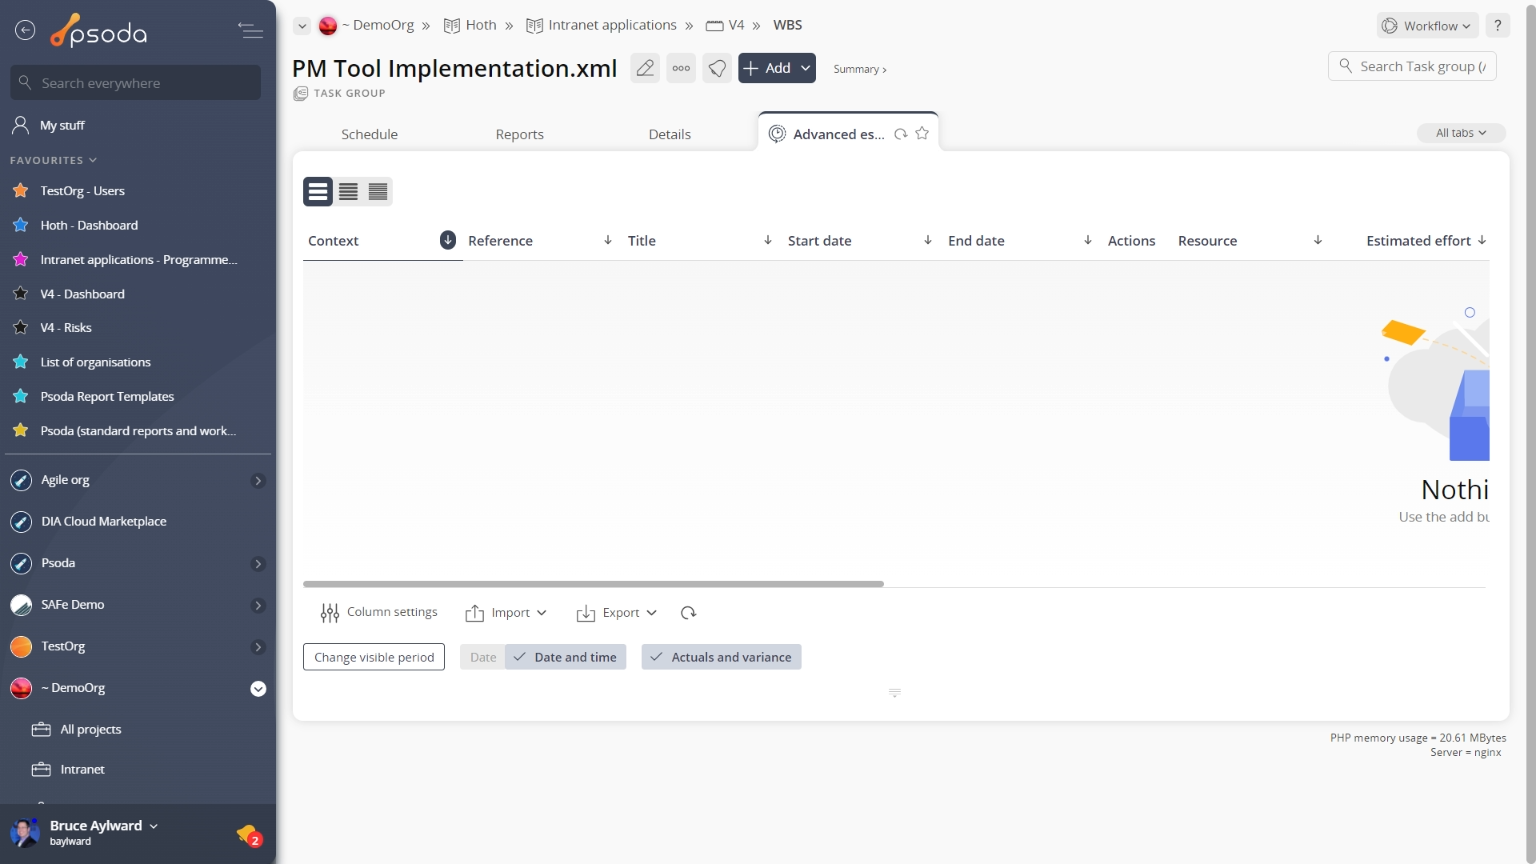
Figure 2 – Task group advanced estimates tab
Note that you can customise your table view by clicking the ![]() edit button at the bottom of the advanced estimates table. Here, you can also export this list to
edit button at the bottom of the advanced estimates table. Here, you can also export this list to ![]() Excel or
Excel or ![]() CSV files.
CSV files.
 Attachments
This tab shows an asset listing of all of the attachments that have been added to this task group, as shown in Figure 3. By default, this table will present you with a number of details about the attachments such as the file’s name, attachment type, view the version and access a download link.
From the Actions column of this attachments table, you can act on individual attachments by 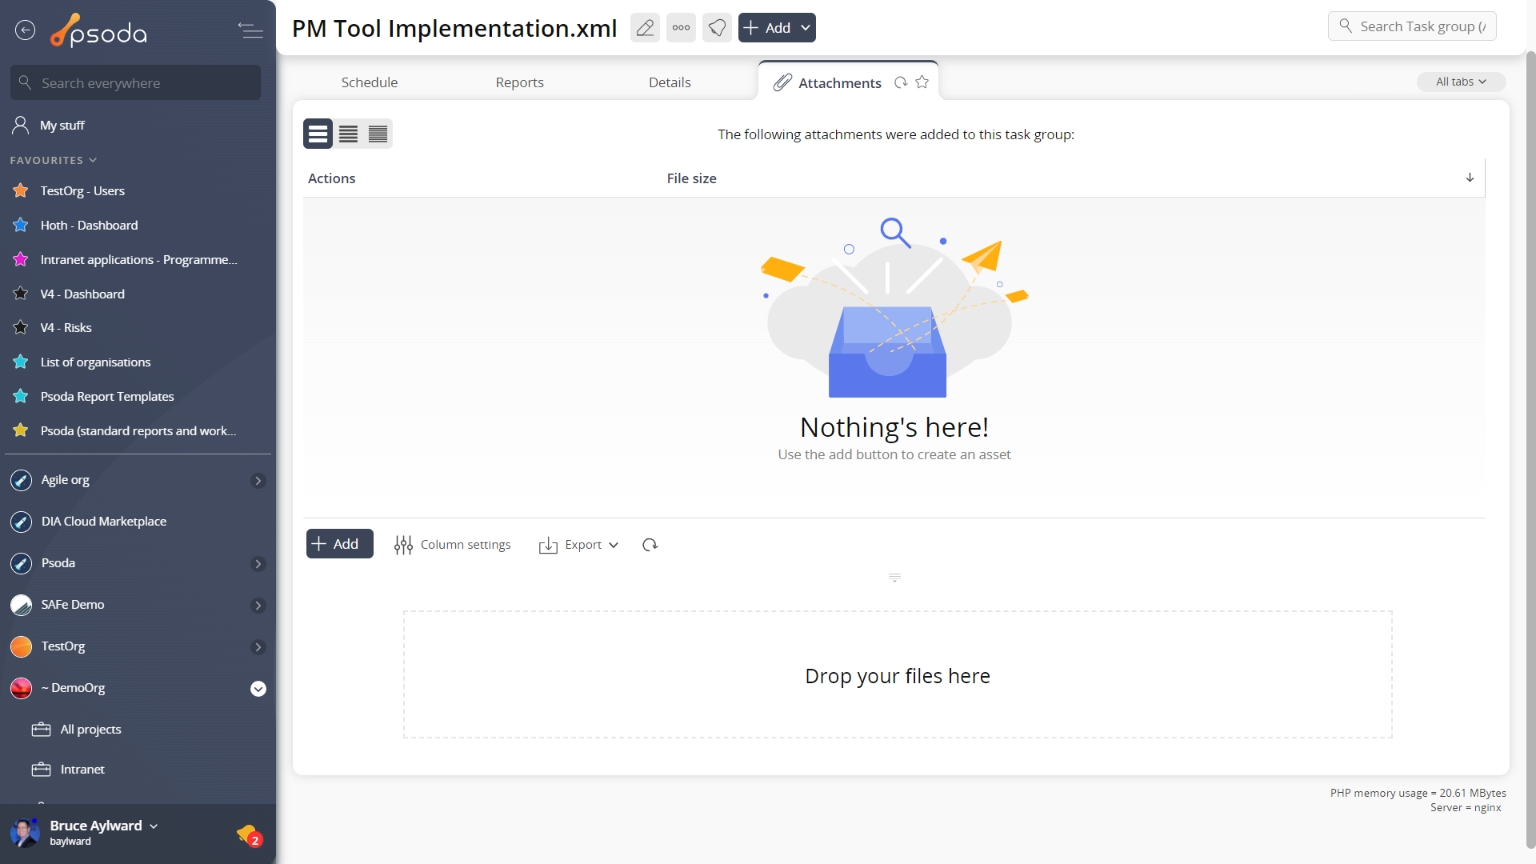
Figure 3 – Task group attachments tab
Note that you can customise your table view by clicking the Charts
Instead of a table view, this tab provides a graphical view of your accumulated baseline vs. actual over time for this task group. Figure 4 below shows an example chart: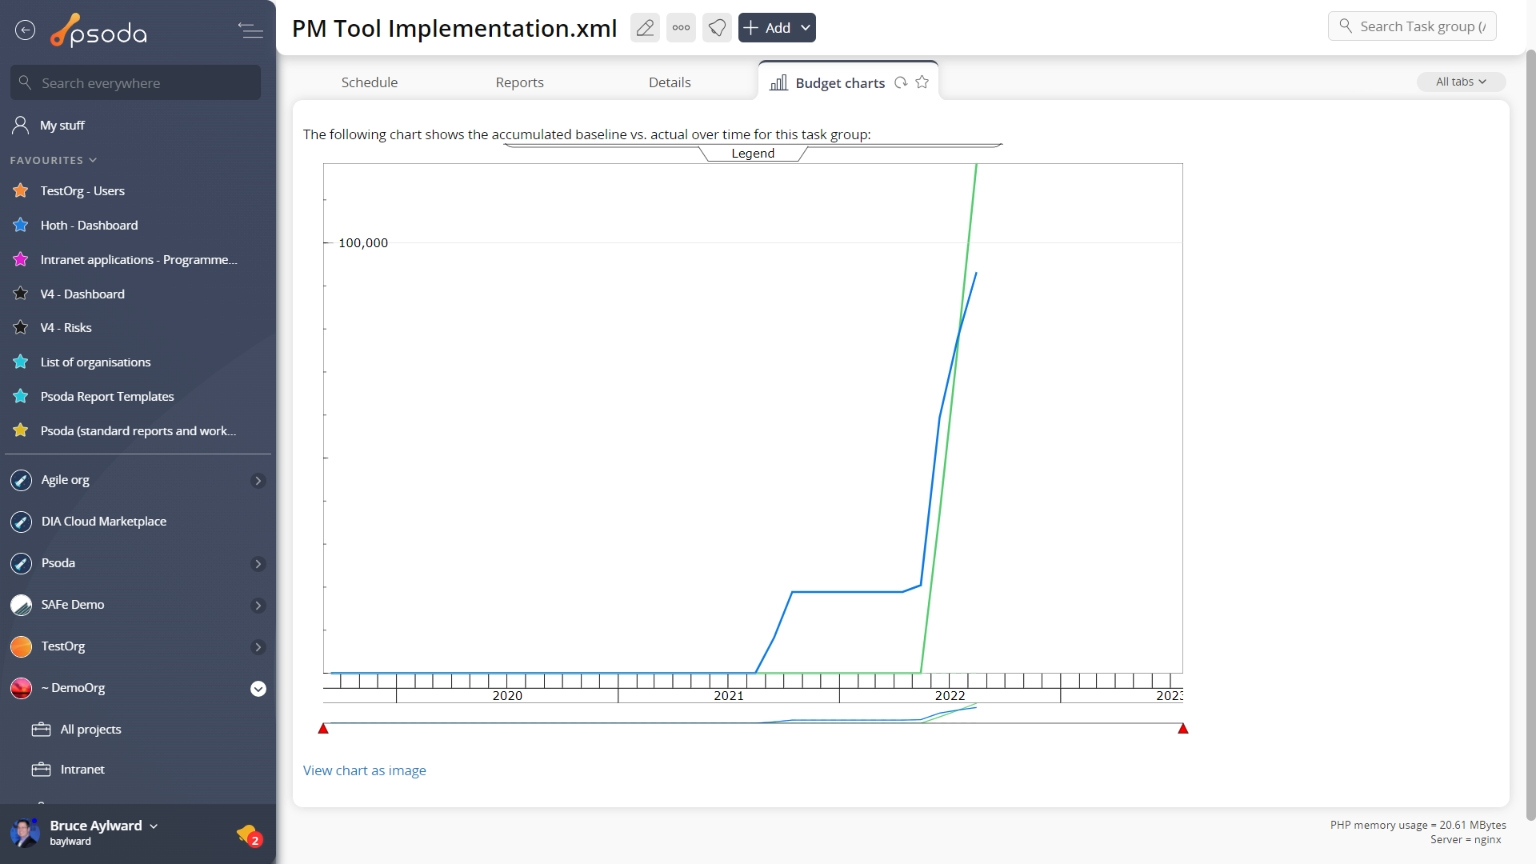
Figure 4 – Task group chart tab
Zoom in or out on certain times by using the red arrows at the bottom of the chart. Comments
This tab shows an asset listing of all of the comments that 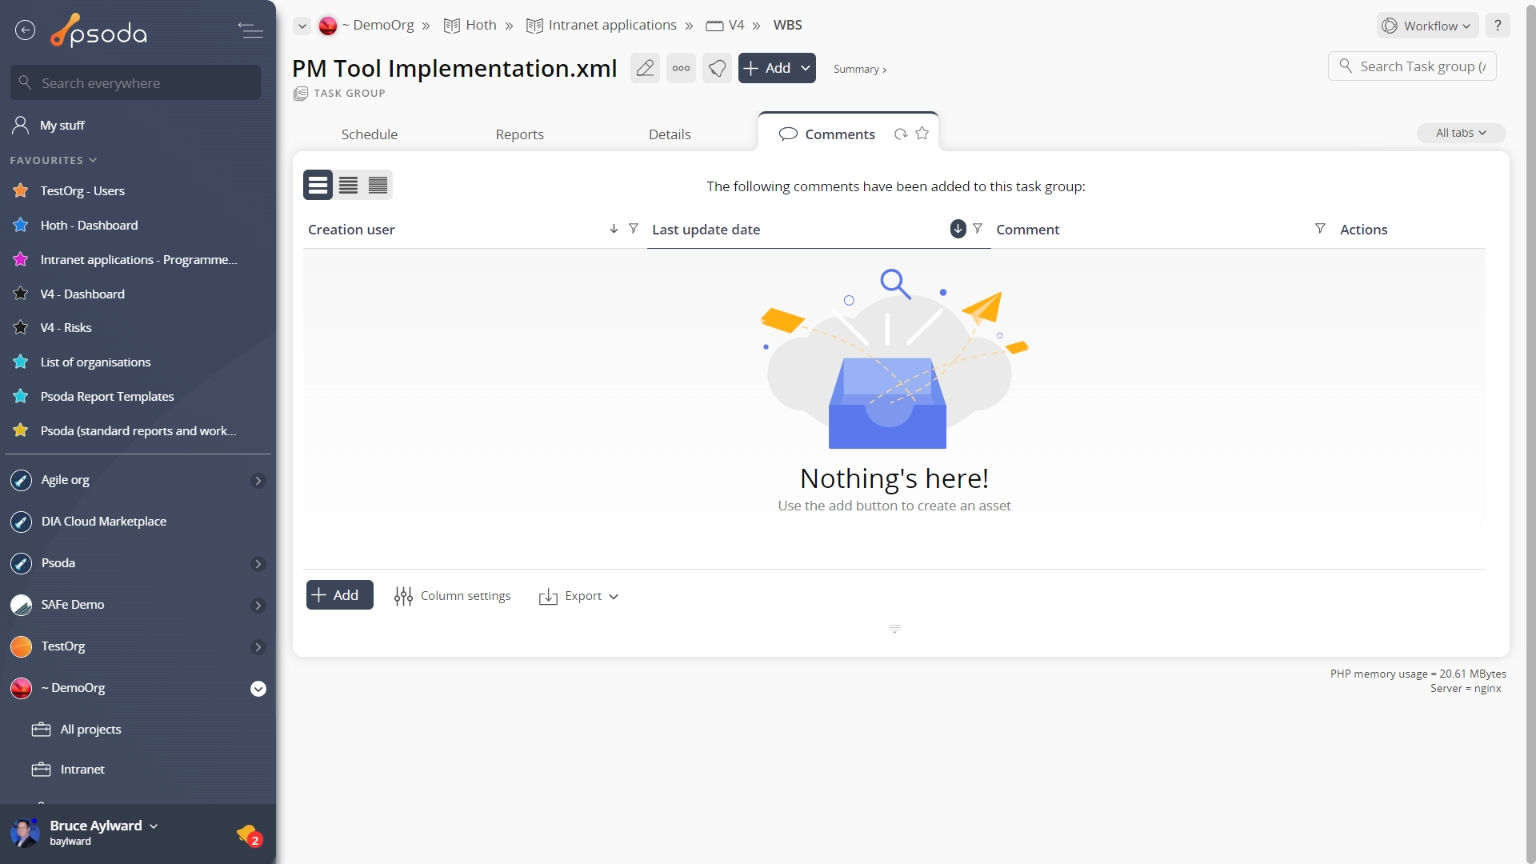
Figure 5 – Task group comments tab
Note that you can customise your table view by clicking the Details
This tab shows some additional details on the task group, for example the description, start date, end date, estimate information and forecast information, as shown in Figure 6.
Figure 6 – Task group details tab
Some fields may allow for inline editing although these permissions may be linked to your access rights. If you feel that you should have access to some of these permissions, contact your System Administrator. GANTT
GANTT
This tabbed view shows the GANTT chart shown in Figure 7, generated by the information in your Schedule tab. By default, this table shows the name of the task group, task or milestone and it’s start and end dates.
On the right-most side of the chart there is a breakdown of tasks in a visual format than will span across a monthly, weekly or daily scale (this is setting dependent). The users who are allocated to each asset will have their names written next to this asset’s timeline.
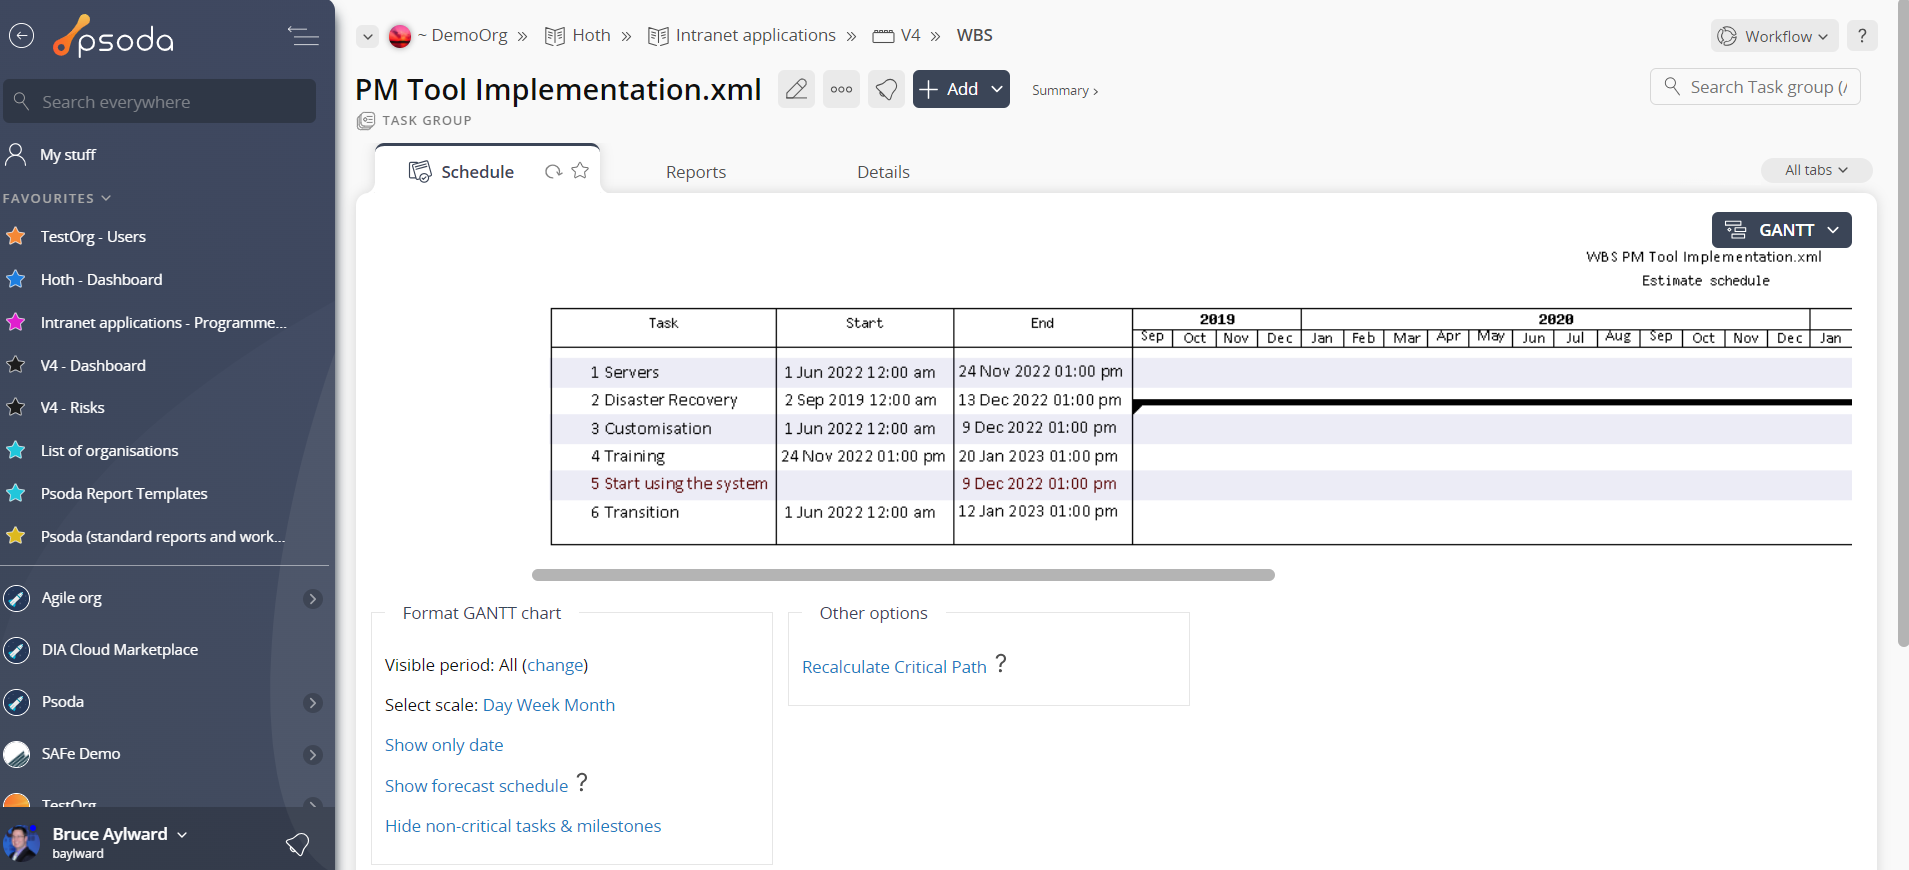
Figure 7 – Task group GANTT chart
At the very bottom of this tabbed view you are presented with a number of table information formatting options which will adjust the GANTT’s visible period, or scale, or whether it displays more than just task dates.In addition, the view tasks & milestones link will navigate to the Schedule tabbed view so that you can expand or contract the work breakdown structure viewed in the GANTT.
 History
This tab shows shows some basic history of the task group, as shown in Figure 8. By default, this tab will present you with a number of details about the task group’s history such as the creation date, creation user, last update date and last update user. If the task group has been changed then this section will also show a table of all the changes that has been made, including the date of each change, the field changed, the value before the change and the user who made the change.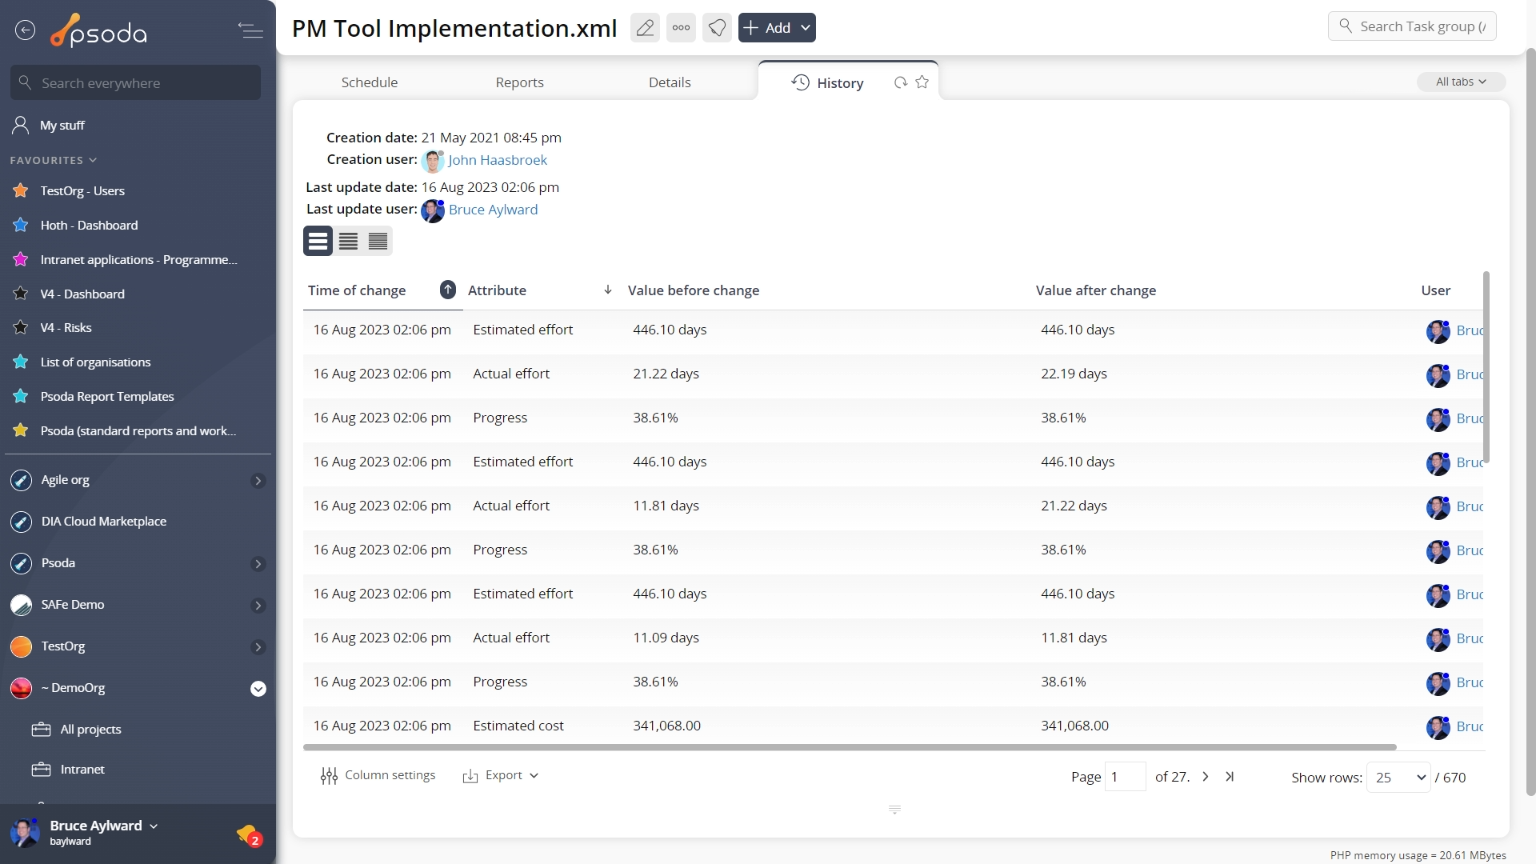
Figure 8 – Task group history tab
Note that you can customise your change table view by clicking the ![]() edit button at the bottom of the change table. Here, you can also export this list of changes to
edit button at the bottom of the change table. Here, you can also export this list of changes to ![]() Excel or
Excel or ![]() CSV files.
CSV files.
 Reports
This tabbed view shows a listing of the reports as seen in Figure 9, listing any reports available for this task group.
Figure 9 shows a portion of this alphabetical listing, and your specific list may vary slightly depending on if your System Administrator has created any new report templates that have been customised to be available to your task group only.
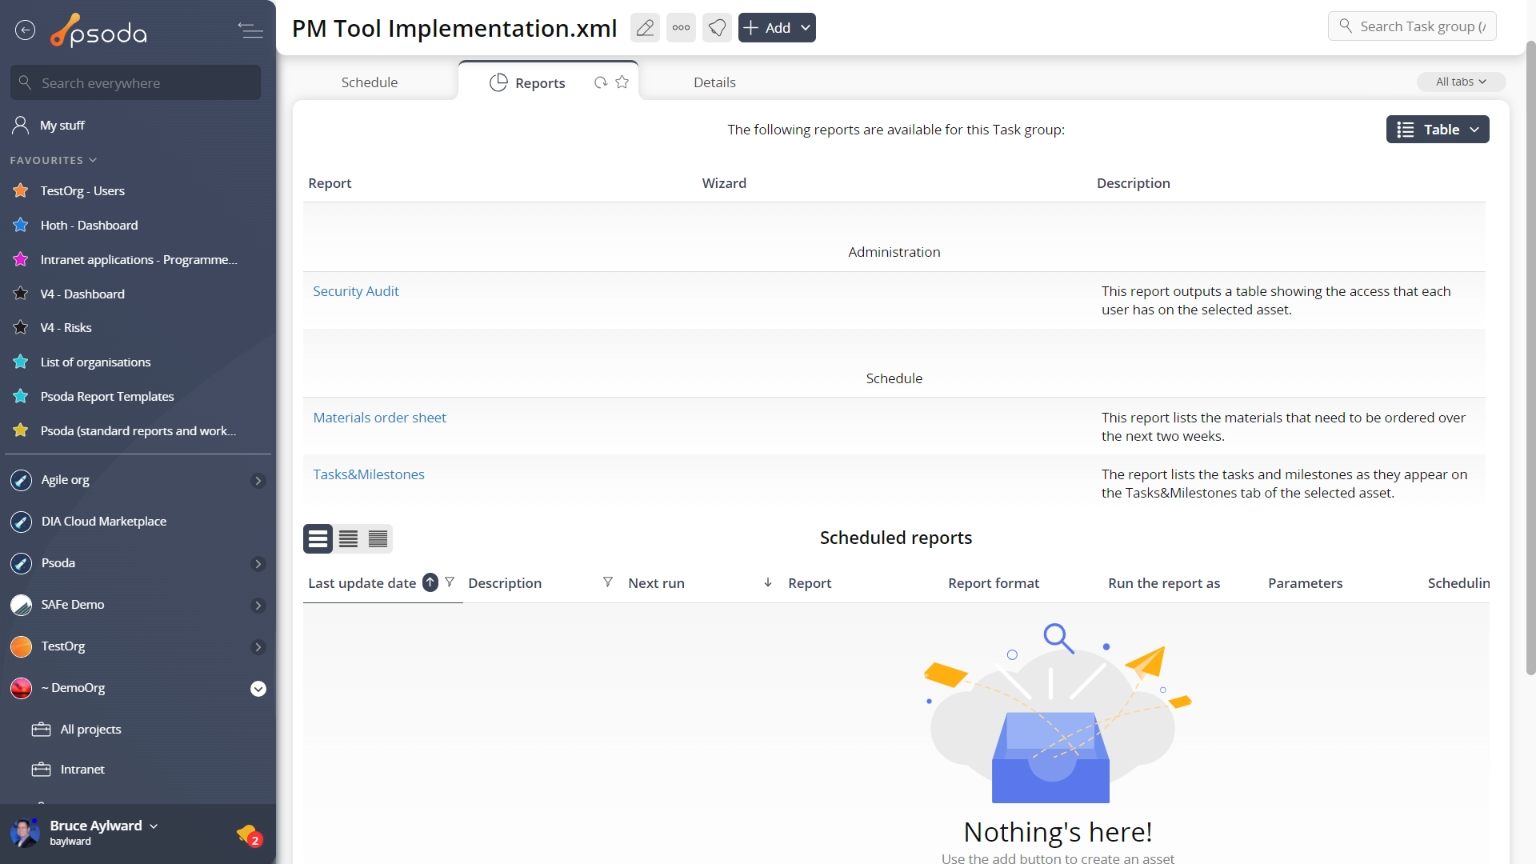
Figure 9 – Task group report tab
This listing is unable to be customised, but provides the name of the report and a more detailed description of what information this report is built for and how the report is grouped.
Once you click on a report’s name, the run report form will popup. These popup forms vary depending on the report being run.
Schedule
This tabbed view shows the tasks and milestones table as seen in Figure 10, listing any 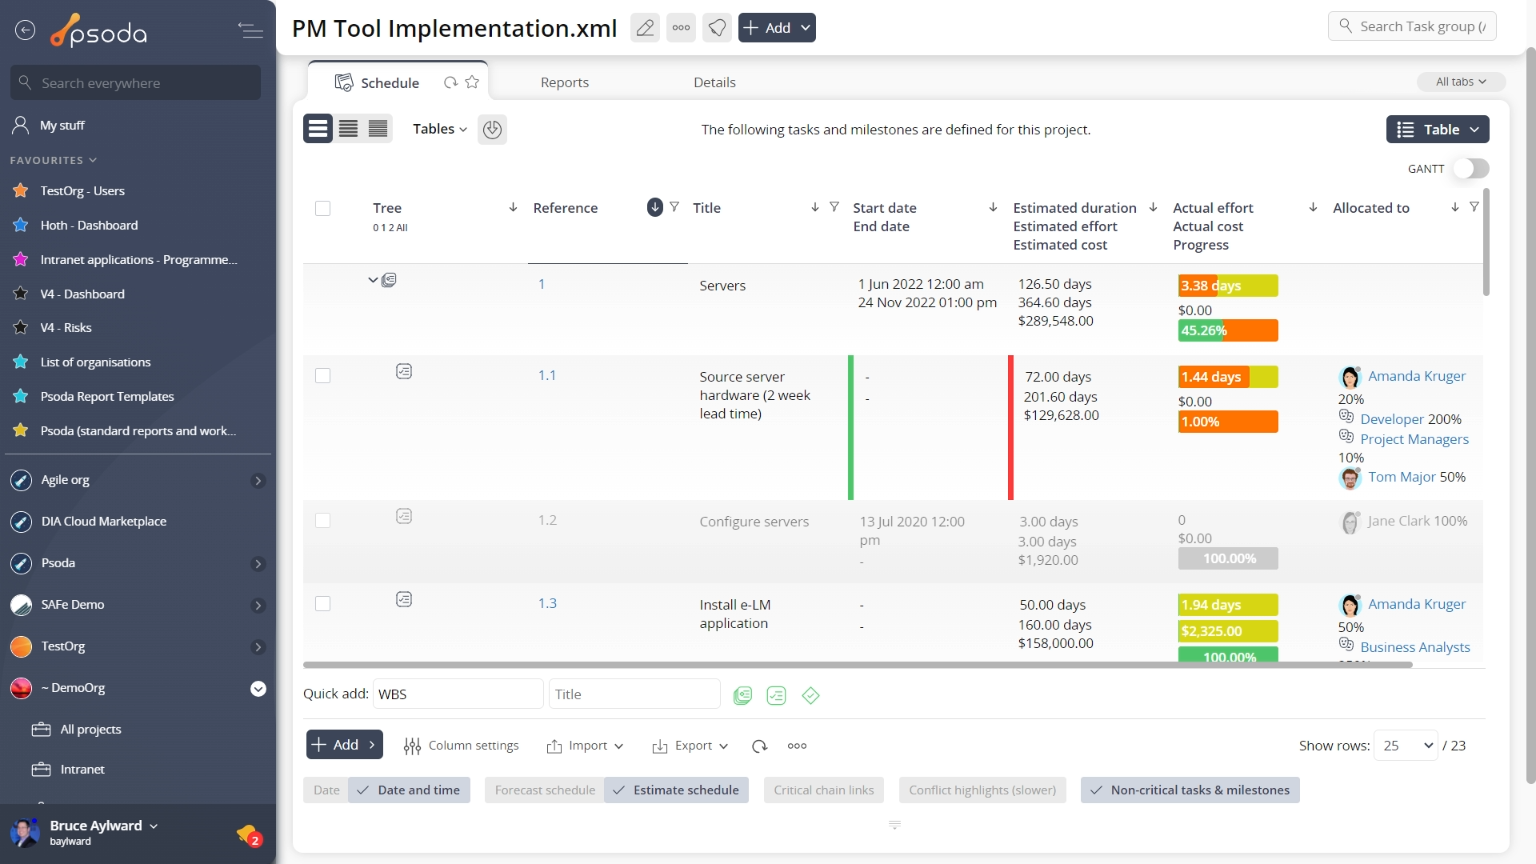
Figure 10 – Task group tasks and milestones table
Note that at the bottom of this table you can add another ![]() sub-group,
sub-group, ![]() task or
task or ![]() milestone,
milestone,![]() edit the table columns to show or hide asset information, or export this information to
edit the table columns to show or hide asset information, or export this information to ![]() Excel or
Excel or ![]() CSV files.
CSV files.
At the very bottom of this tabbed view you are presented with a number of table information formatting options which will increase/decrease the information you’re presented with, as well as other options to import task group/WBS information, view the information in a GANTT format or run a recalculation.
From this other options subsection at the bottom of this tabbed view, you may also have access to ![]() mass approve,
mass approve, ![]() mass complete or mass archive tasks.
mass complete or mass archive tasks.
 Time log
This tab shows an asset listing of all of the timesheets that have time logged against this task group.
This table supports inline editing.
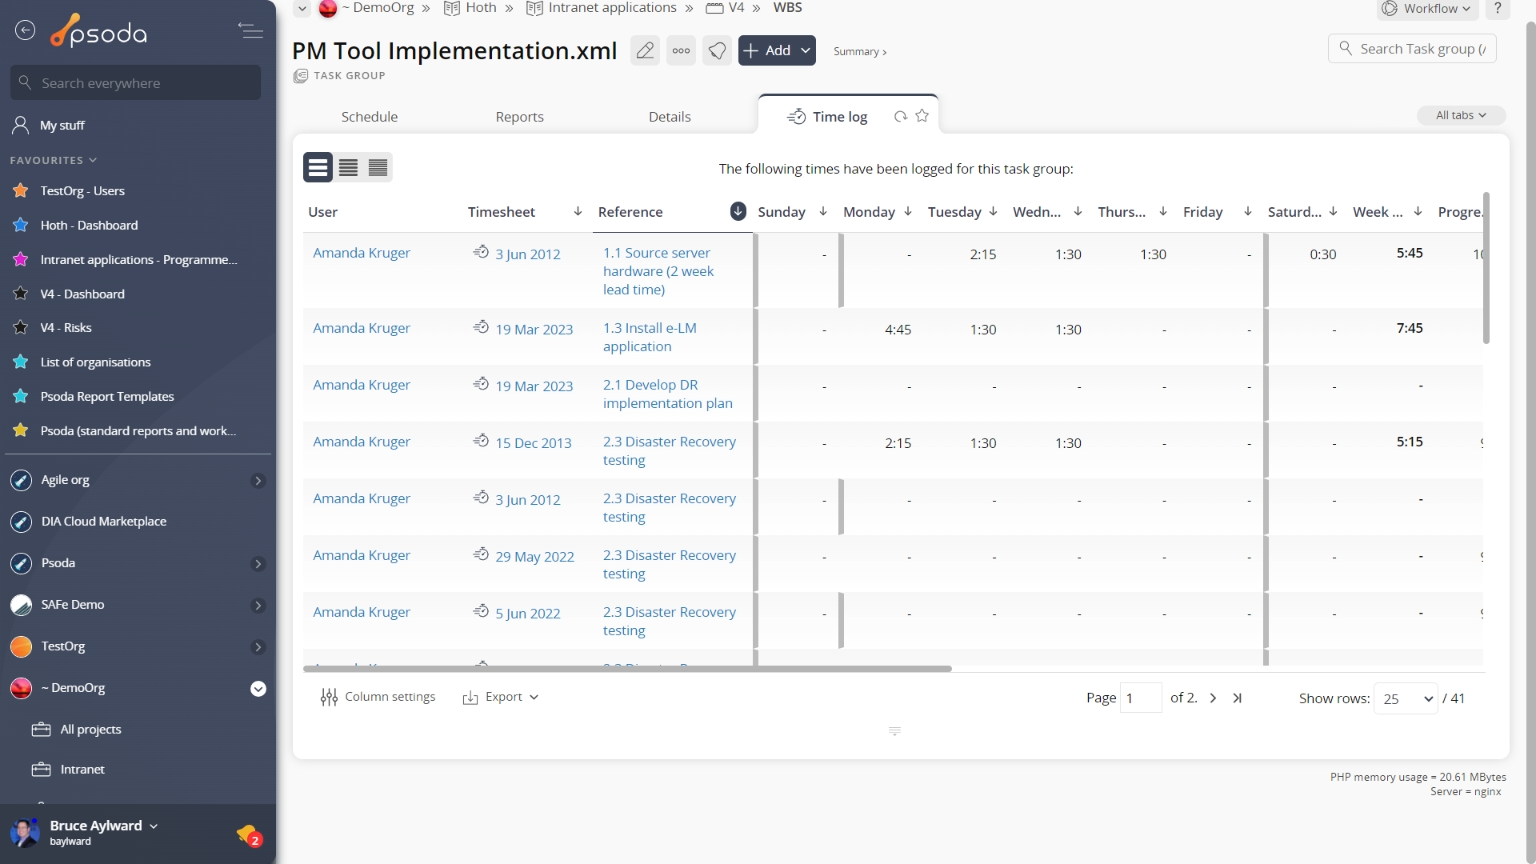
Figure 11 – Task group time log tab