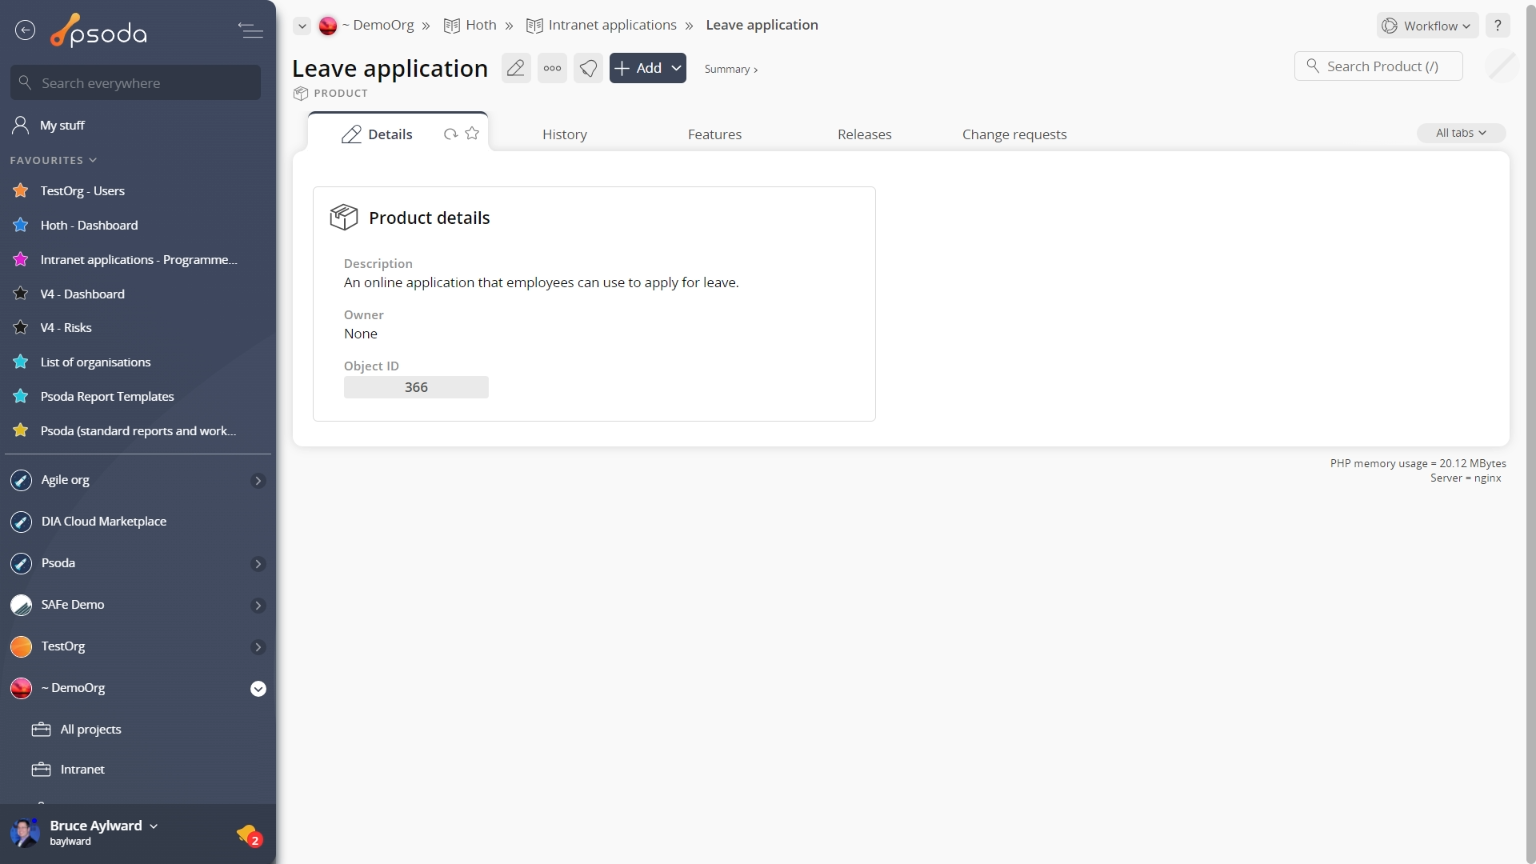
Figure 1 – Product view page
The top header area allows you to Change requests
This tabbed view provides the change requests table, as shown in Figure 2, listing any change requests that have been added to this product.
By default you will be presented with the link to view the change request itself, title, category, description, scheduling information, the user who initiated this request, the owner of the request, it’s current state and any actions or workflow transitions that are available.
From this change request listing, you can utilise any of the functions in the Actions column to act on a specific request. These functions may include 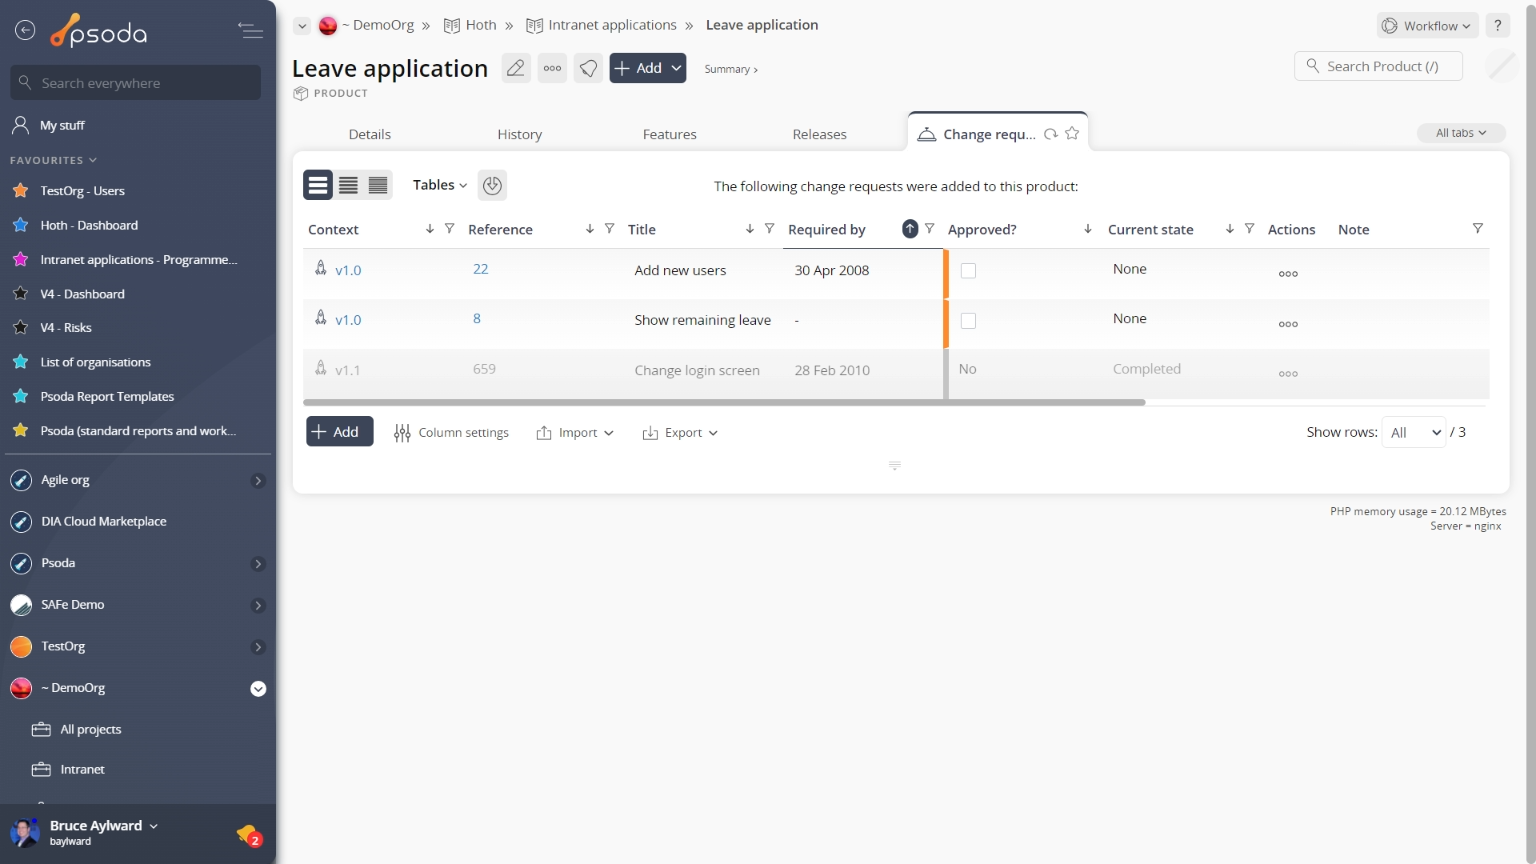
Figure 2 – Product change requests table
Note that at the bottom of the table you can ![]() add more change requests,
add more change requests, ![]() edit the table columns to show or hide request information, or export this list to
edit the table columns to show or hide request information, or export this list to ![]() Excel or
Excel or ![]() CSV files.
CSV files.
 Defects
This tab shows an asset listing of all of the defects that have been logged for this product, as shown in Figure 3. By default, this table will present you with a number of details about the defects such as the defect’s number, type, title, severity, priority, current state, date raised, resolve by date and which user this defect is allocated to, to name a few details.
From the Actions column of this defects table, you can act on individual defects by 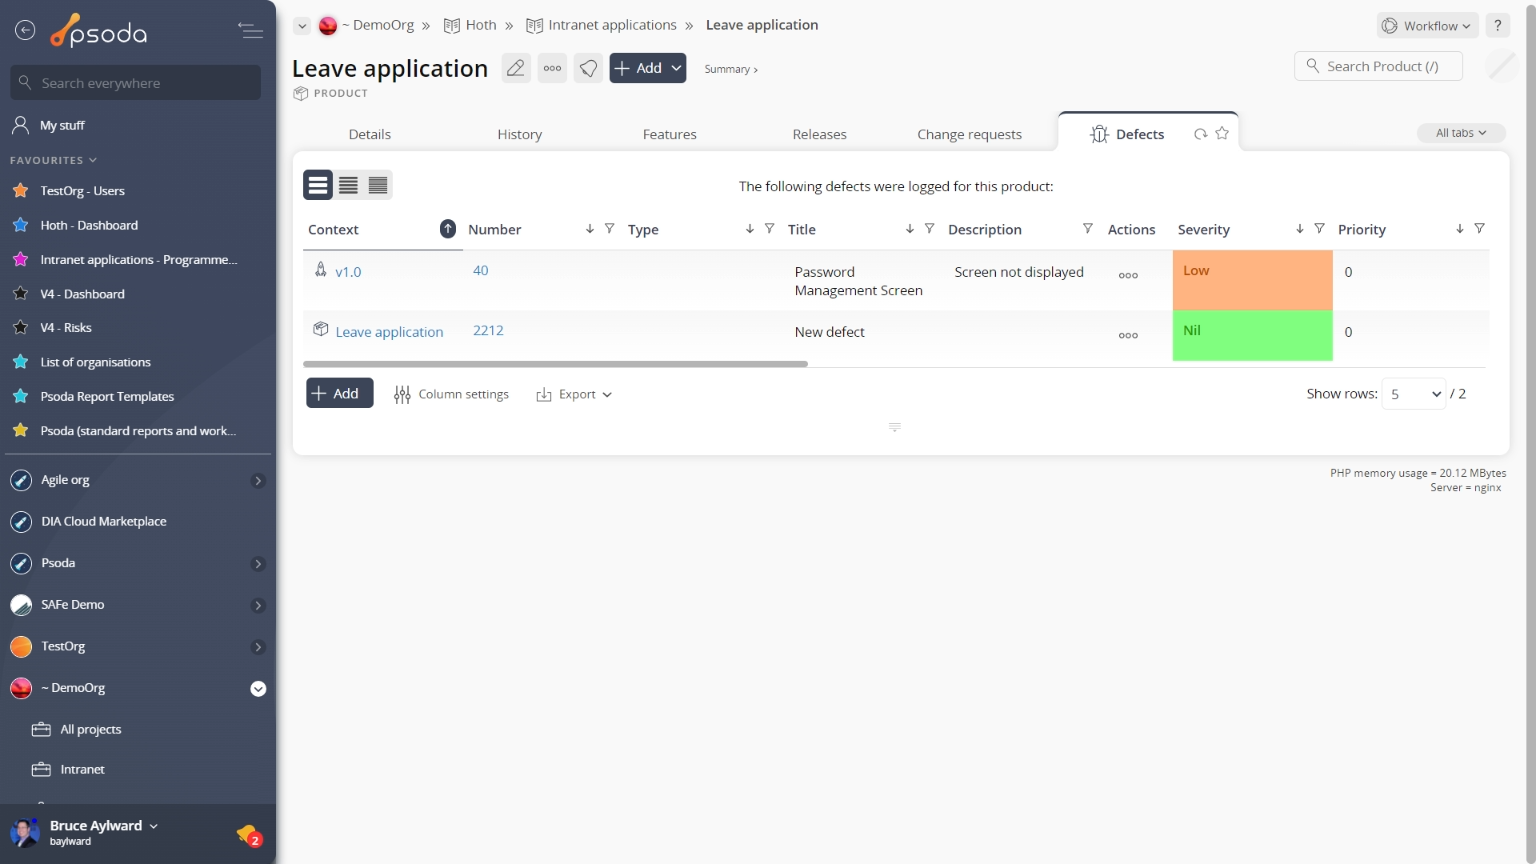
Figure 3 – Product defects tab
Note that you can customise your table view by clicking the ![]() edit button at the bottom of the defect table or navigate to this same spot to
edit button at the bottom of the defect table or navigate to this same spot to ![]() add more defects to this product. Here, you can also export this list to
add more defects to this product. Here, you can also export this list to ![]() Excel or
Excel or ![]() CSV files.
CSV files.
At the very bottom of this tab you may also be presented with the option to reduce the number of defects listed by selecting the hide defects for children of this folder link.
 Deleted assets
This tab shows an asset listing of all of the assets that 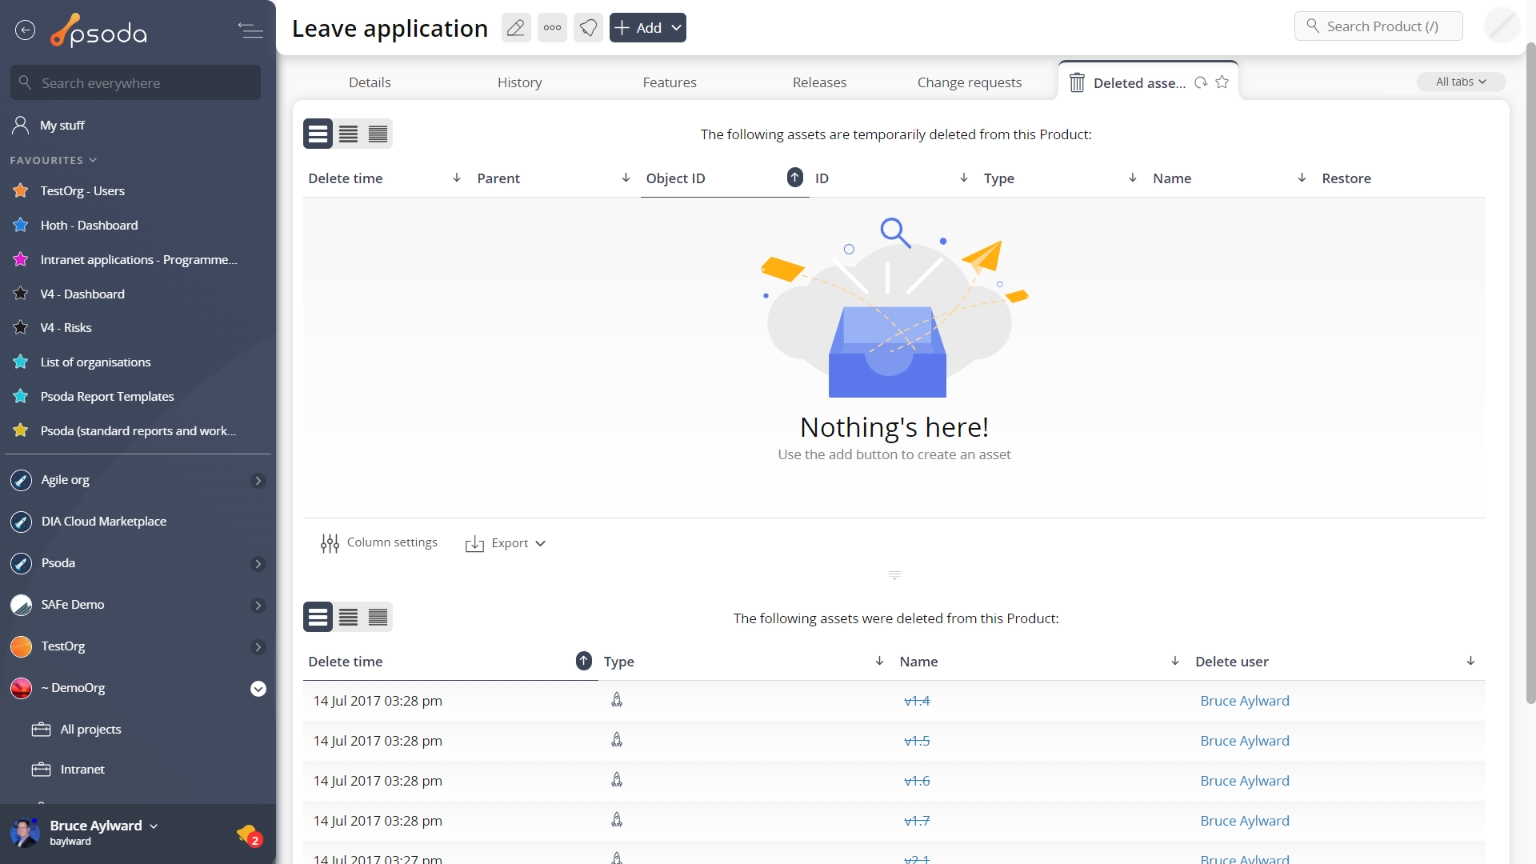
Figure 4 – Product deleted assets tab
Note that you can customise your table view by clicking the ![]() edit button at the bottom of the tables. Here, you can also export the list to
edit button at the bottom of the tables. Here, you can also export the list to ![]() Excel or
Excel or ![]() CSV files.
CSV files.
 Features
This tab shows an asset listing of all of the features allocated to this product, as shown in Figure 5. By default, this table will present you with a number of details about the features such as the it’s context, reference, description, estimate information, priority and it’s current state.
If you have set up release pools for this release then the feature table will show additional columns for those resource pools. The headings will show the pool name as well as the size of the pool in mandays. The columns will show the resource estimates set for each feature.
If the feature will fit into all the resource pools then it is coloured green and the pools are reduced by the corresponding estimates. If a feature does not fit then the pools where it does not fit are highlighted in red and that feature is skipped.
If you click on the link beneath the reference column, you will navigate to the selected feature’s view page.
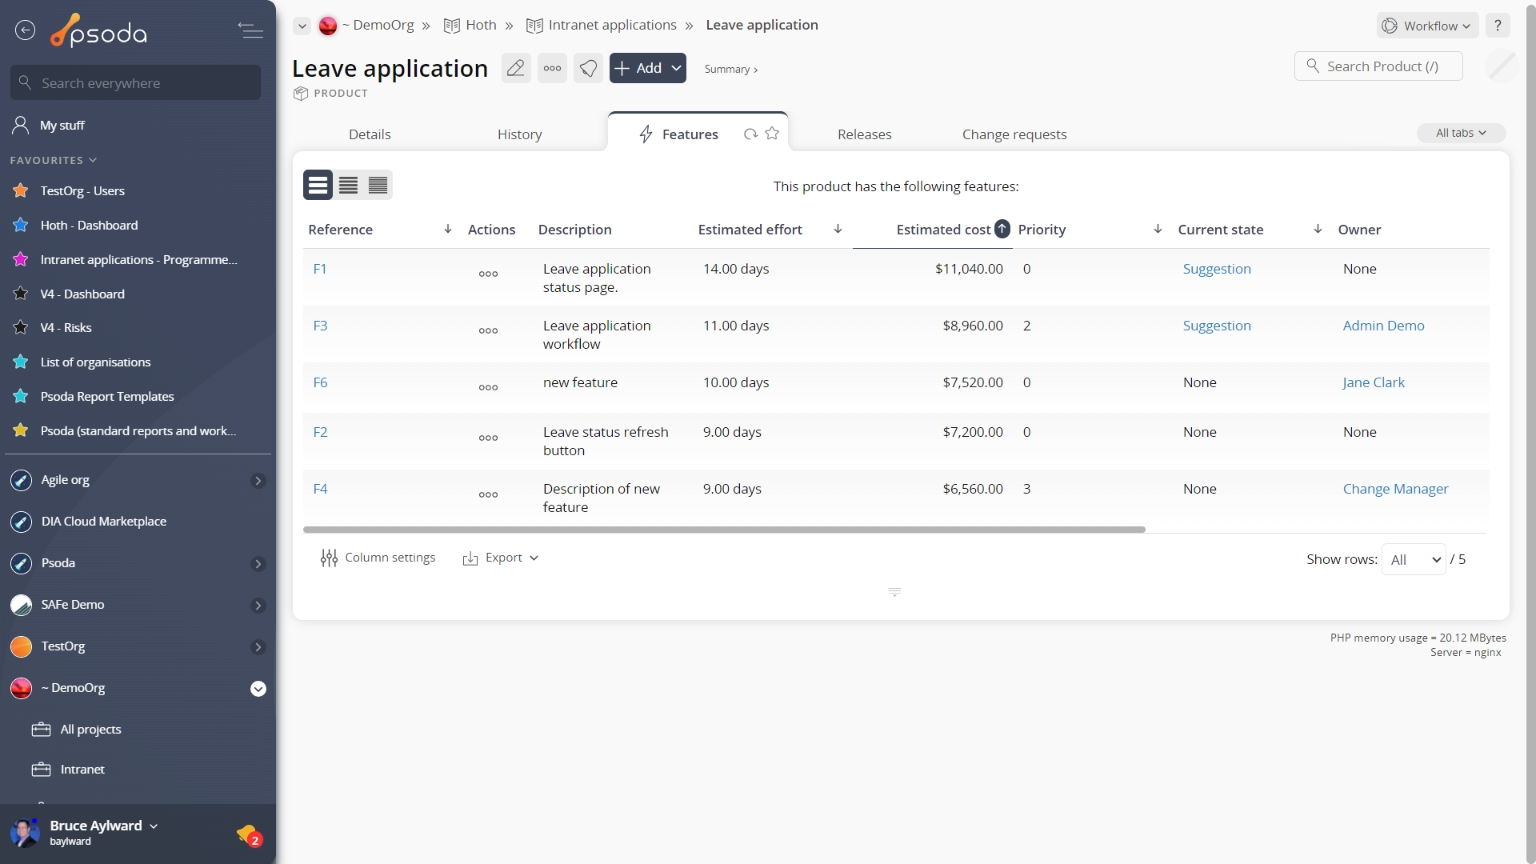
Figure 5 – Product features tab
Note: if you resort the feature table then the algorithm will be applied against the new sorting order, indicating which features will fit based on that order. Note that you can customise your table view by clicking the History
This tab shows shows some basic history of the product, as shown in Figure 6. By default, this tab will present you with a number of details about the product’s history such as the creation date, creation user, last update date and last update user. If the product has been changed then this section will also show a table of all the changes that has been made, including the date of each change, the field changed, the value before the change and the user who made the change.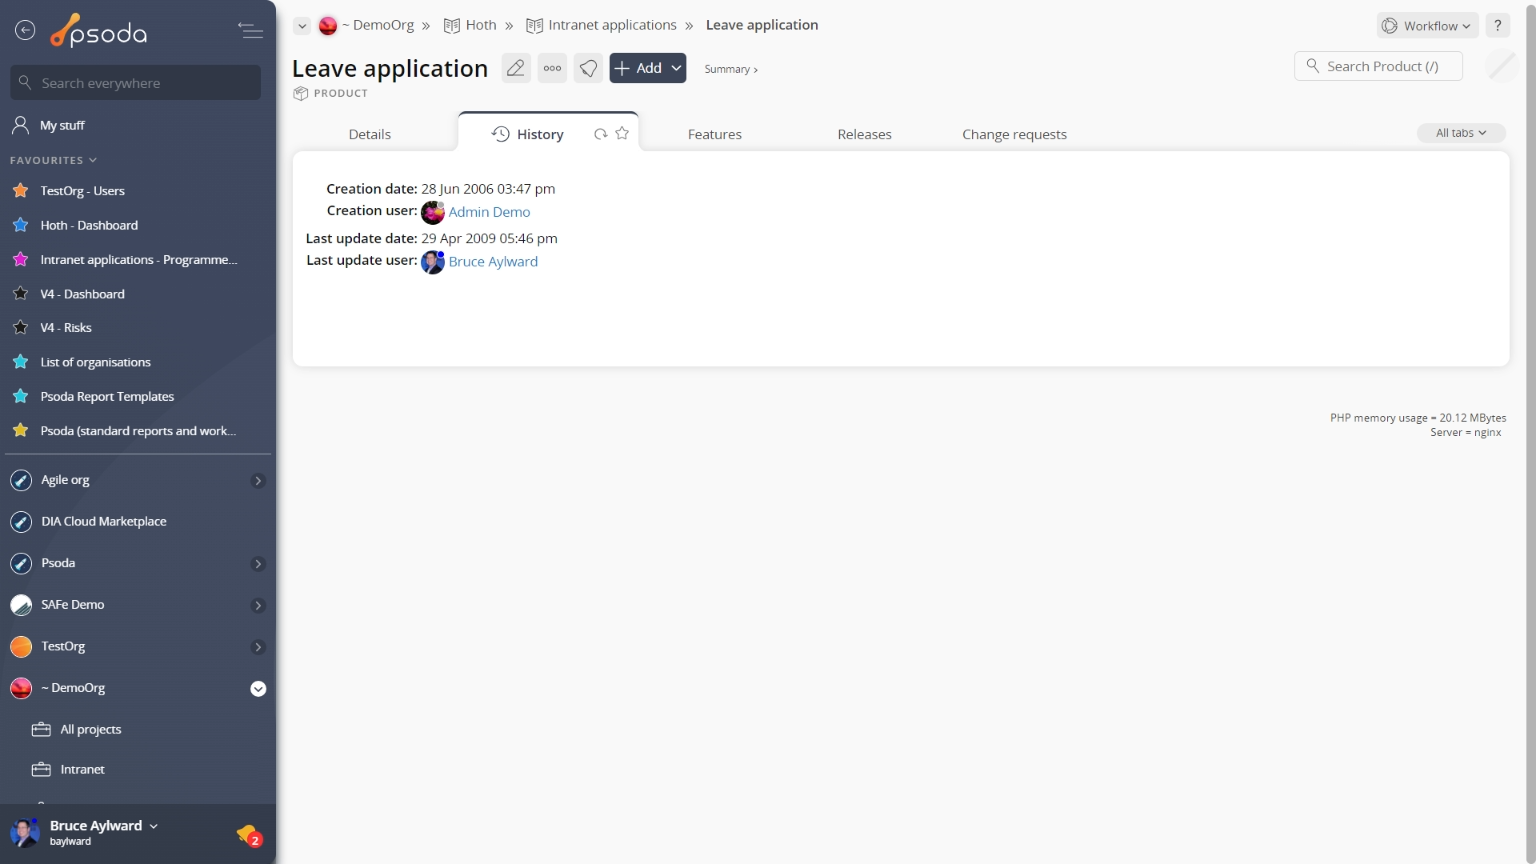
Figure 6 – Product history tab
Note that you can customise your change table view by clicking the ![]() edit button at the bottom of the change table. Here, you can also export this list of changes to
edit button at the bottom of the change table. Here, you can also export this list of changes to ![]() Excel or
Excel or ![]() CSV files.
CSV files.
 Issues
This tabbed view shows the issues table as seen in Figure 7, listing any issues that have been logged for this product. By default, this table provides impact and priority information, plan progress and resolution dates for the issues listed, as well as any actions that can be taken. The workflow column also provides information as to the next workflow transitions available.
The Actions column of the issues table provides accessible functions to act on a chosen issue. These functions include 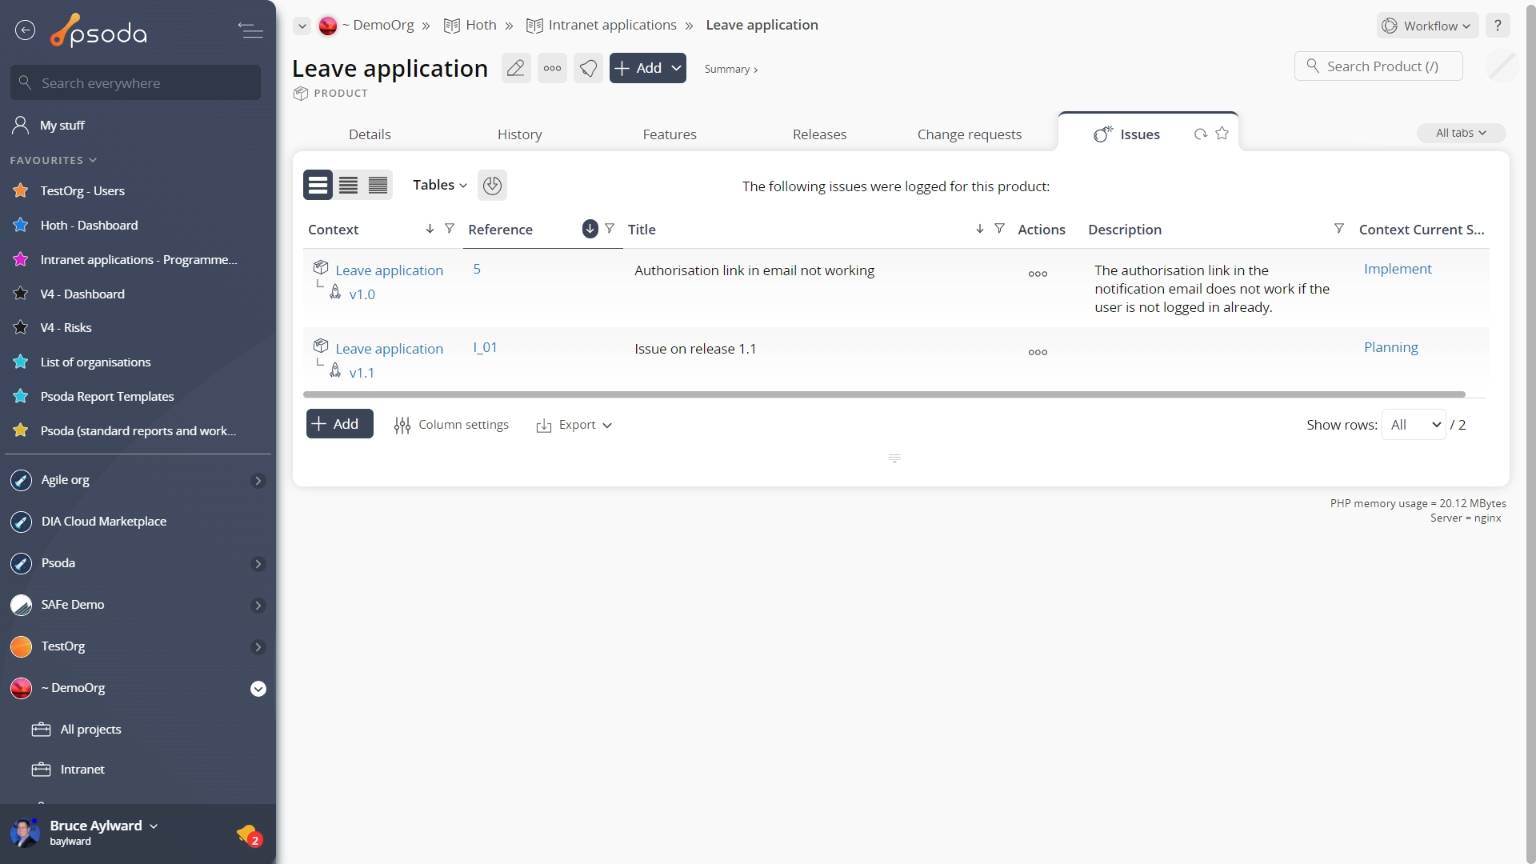
Figure 7 – Product issues tab
Note that at the bottom of the table you can Releases
This tab shows an asset listing of all of the releases defined for this product, as shown in Figure 8. By default, this table will present you with a number of details about the releases such as the release number, description, estimate information, planned release date and it’s current state. If you click on the link under the release column, you will navigate into the selected release’s view page.
From the Actions column of this releases table, you can act on individual releases by 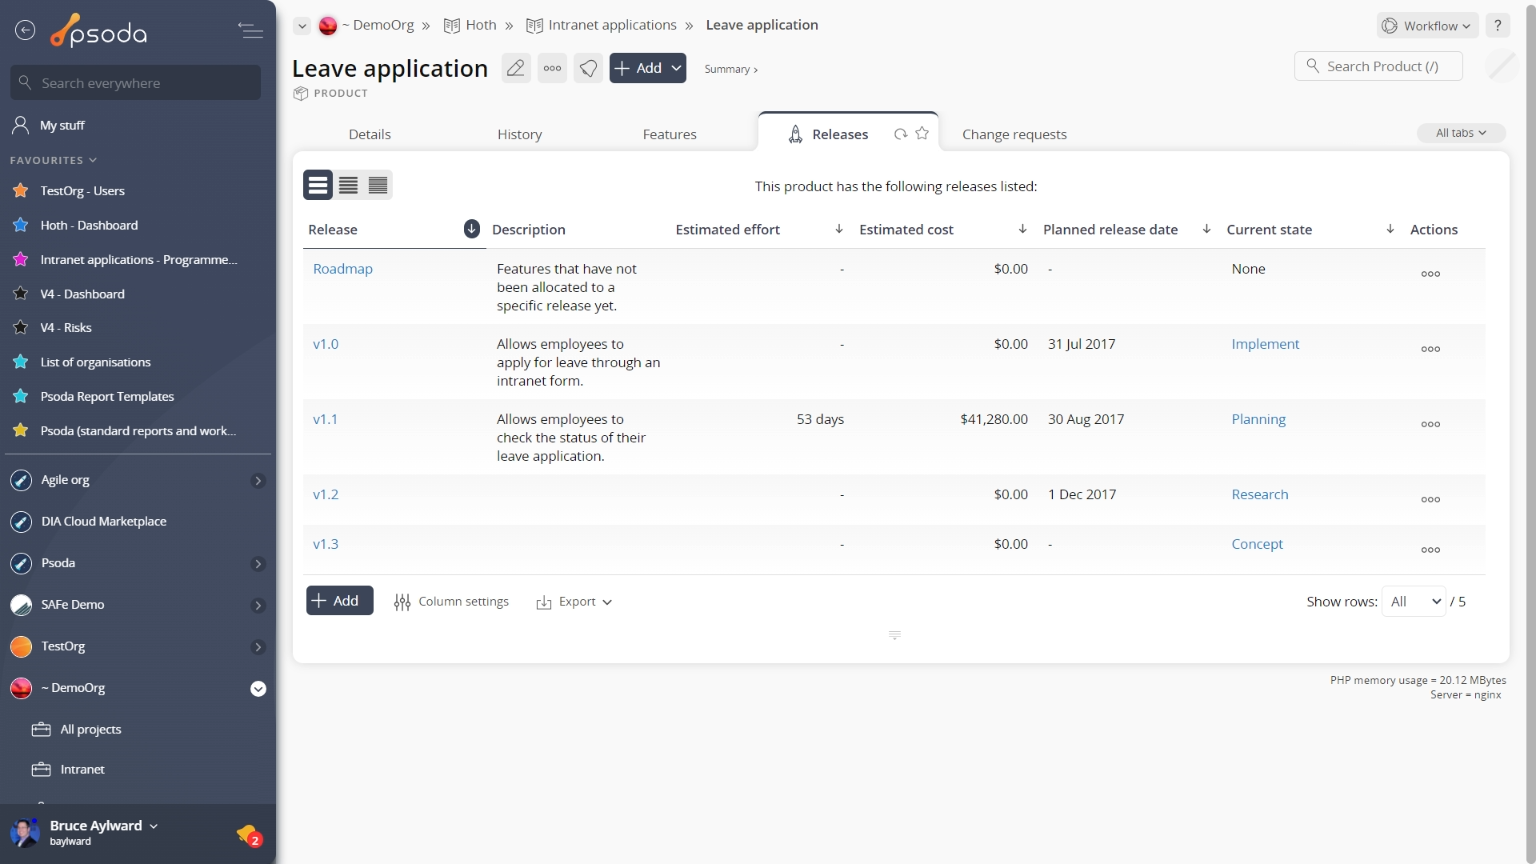
Figure 8 – Product releases tab
Note that you can customise your table view by clicking the ![]() edit button at the bottom of the release table or navigate to this same spot to
edit button at the bottom of the release table or navigate to this same spot to ![]() add more releases to this product. Here, you can also export this list to
add more releases to this product. Here, you can also export this list to ![]() Excel or
Excel or ![]() CSV files.
CSV files.
 Roles
Roles
This tabbed view shows the roles table as seen in Figure 9, listing any roles that have been defined for this product. By default, you will be shown the role’s name, description and editable daily and hourly rates for members of this role, along with a list of users who are members of this role.
The Actions column of this table provides accessible functions to act on a chosen role. These functions include 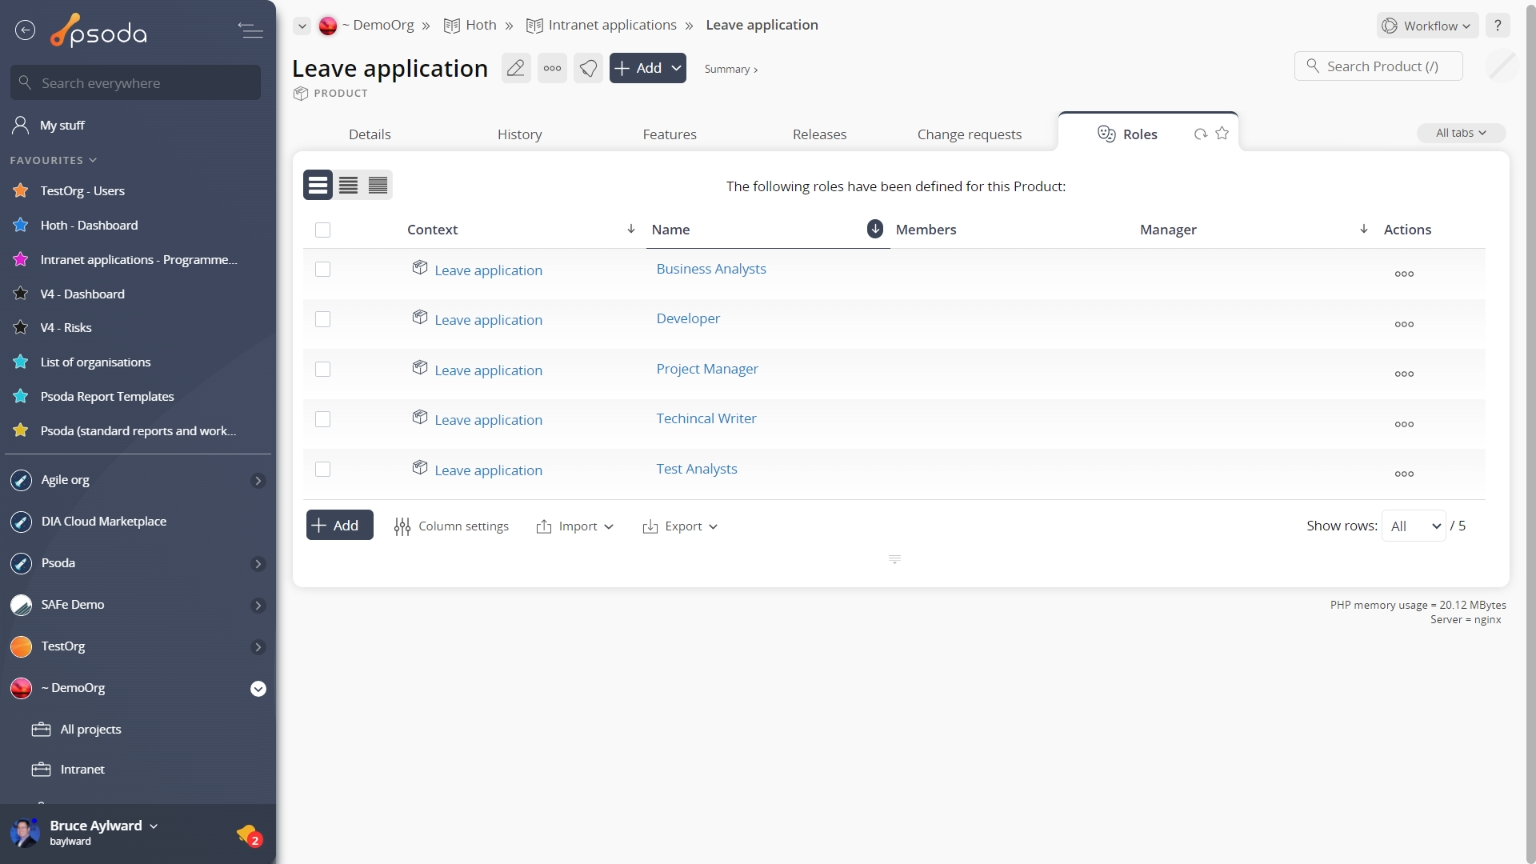
Figure 9 – Product roles table
Note that at the bottom of this table you can ![]() add another single role,
add another single role, ![]() edit the table columns to show or hide role information, or export this role list to
edit the table columns to show or hide role information, or export this role list to ![]() Excel or
Excel or ![]() CSV files.
CSV files.
 Report templates
This tabbed view shows the report templates table as seen in Figure 10, listing any report templates that have been added to this product. By default, this table shows the last time the template was updated, the title, description, status and classes (areas in Psoda that this report template will be available) of each template.
The Actions column of the report template table provides accessible functions to act on a chosen template. These functions include 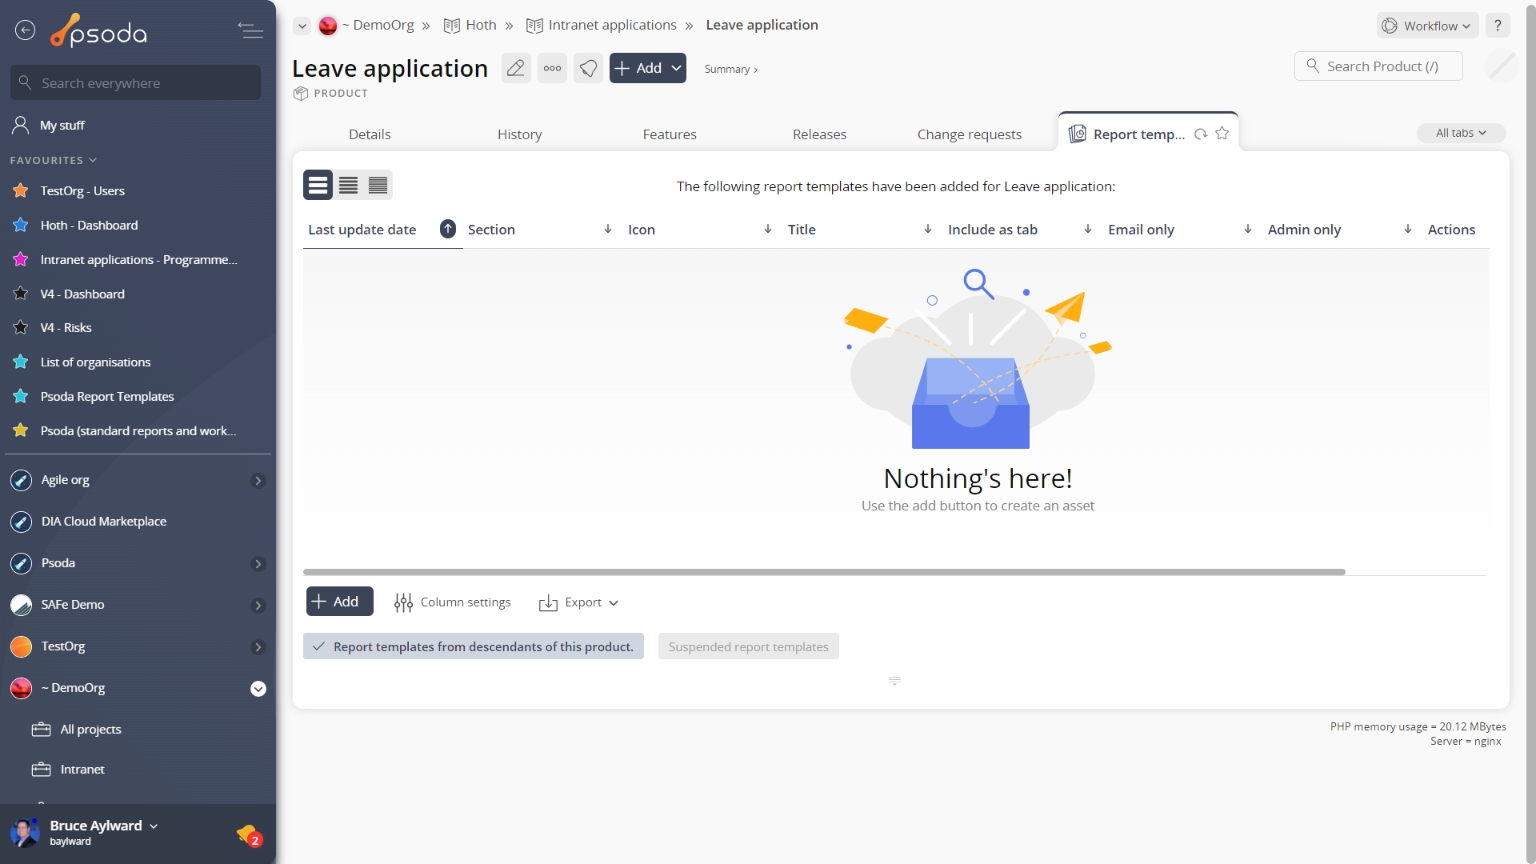
Figure 10- Product report templates table
Note that at the bottom of the table you can ![]() add another single template,
add another single template, ![]() edit the table columns to show or hide certain template information, or export this template list to
edit the table columns to show or hide certain template information, or export this template list to ![]() Excel or
Excel or ![]() CSV files.
CSV files.
Reports
This tabbed view shows a listing of the reports as seen in Figure 11, listing any reports available for this product.
Figure 21 shows a portion of this alphabetical listing, and your specific list may vary slightly depending on if your System Administrator has created any new report templates that have been customised to be available to your product only.
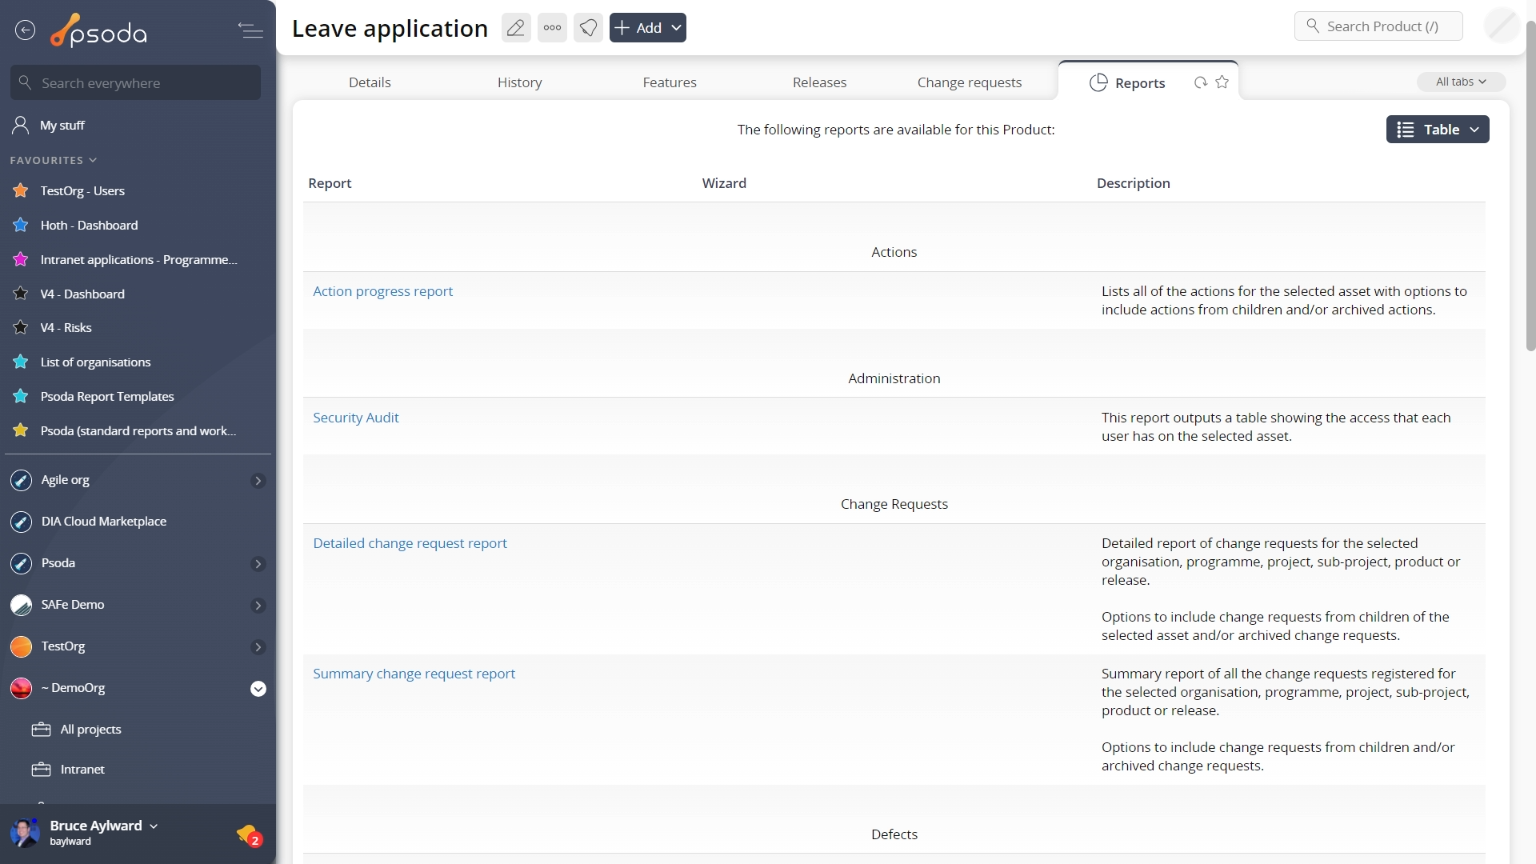
Figure 11 – Product report table
This listing is unable to be customised, but provides the name of the report and a more detailed description of what information this report is built for and how the report is grouped.
Once you click on a report’s name, the run report form will popup. These popup forms vary depending on the report being run.
 Traceability matrix
This tab shows the traceability matrix for this product, as shown in Figure 12. The traceability matrix tool is used to visualise the relationships between requirements and requirements, requirements and test cases and other product entities. It can also be used to add new relationships or to toggle the relationship flags.
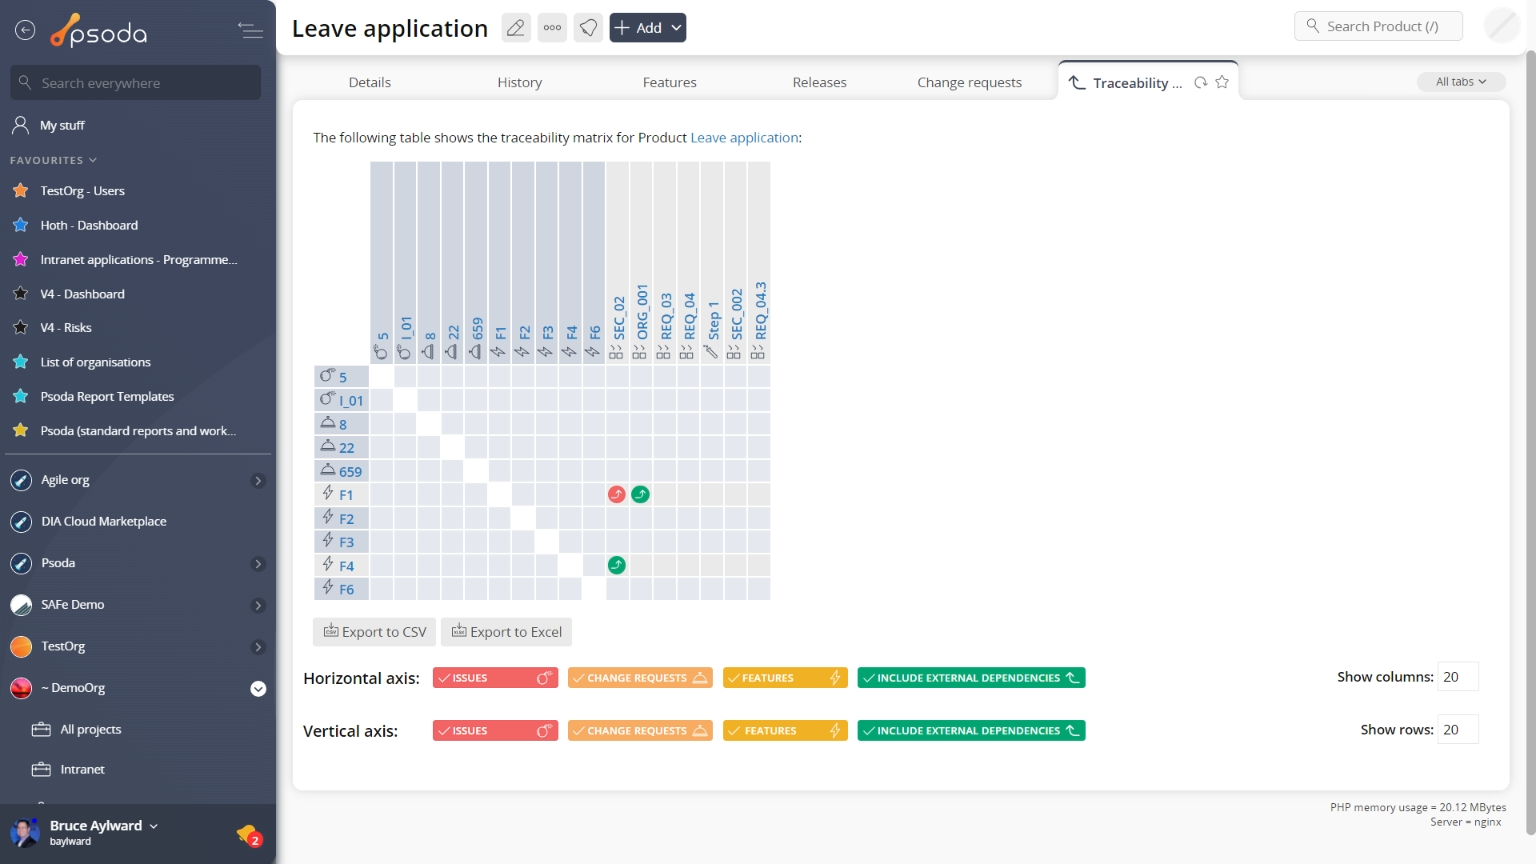
Figure 12 – Product traceability matrix tab
Below the matrix itself, you can edit which assets you want to include on the horizontal and vertical axes by selecting or de-selecting the associated check boxes and selecting the Update matrix button. Workflows
This tabbed view shows the workflows table as seen in Figure 13, listing any workflows that have been added to this product By default, this table shows the title, the description and the status, class and default of each workflow.
The Actions column of the workflow table provides accessible functions to act on a chosen workflow. These functions include 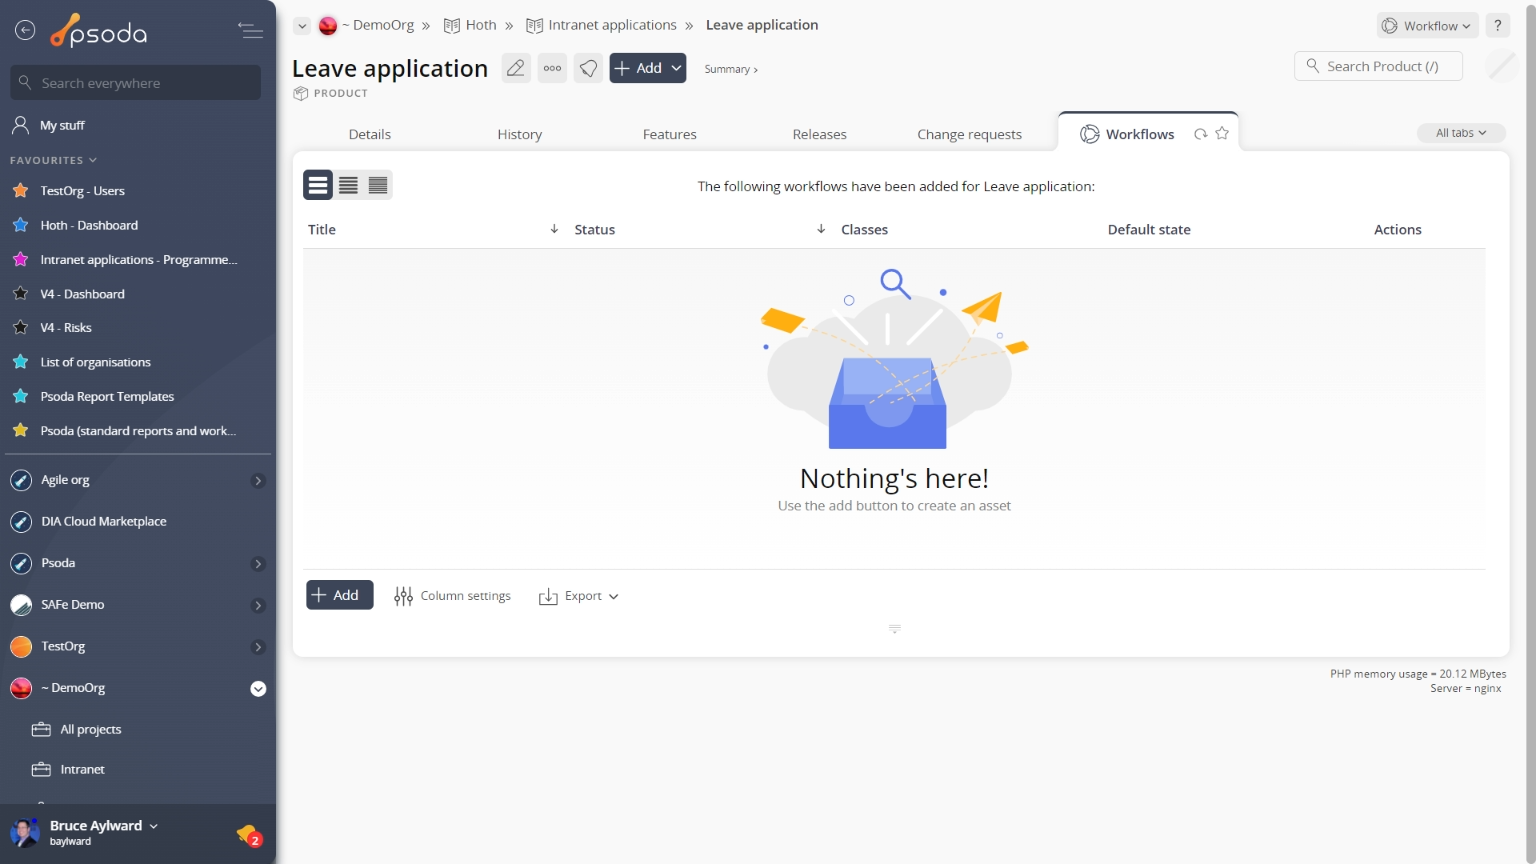
Figure 13- Product workflow table
Note that at the bottom of the table you can ![]() add another workflow,
add another workflow, ![]() edit the table columns to show or hide certain workflow information, or export this workflow list to
edit the table columns to show or hide certain workflow information, or export this workflow list to ![]() Excel or
Excel or ![]() CSV files.
CSV files.