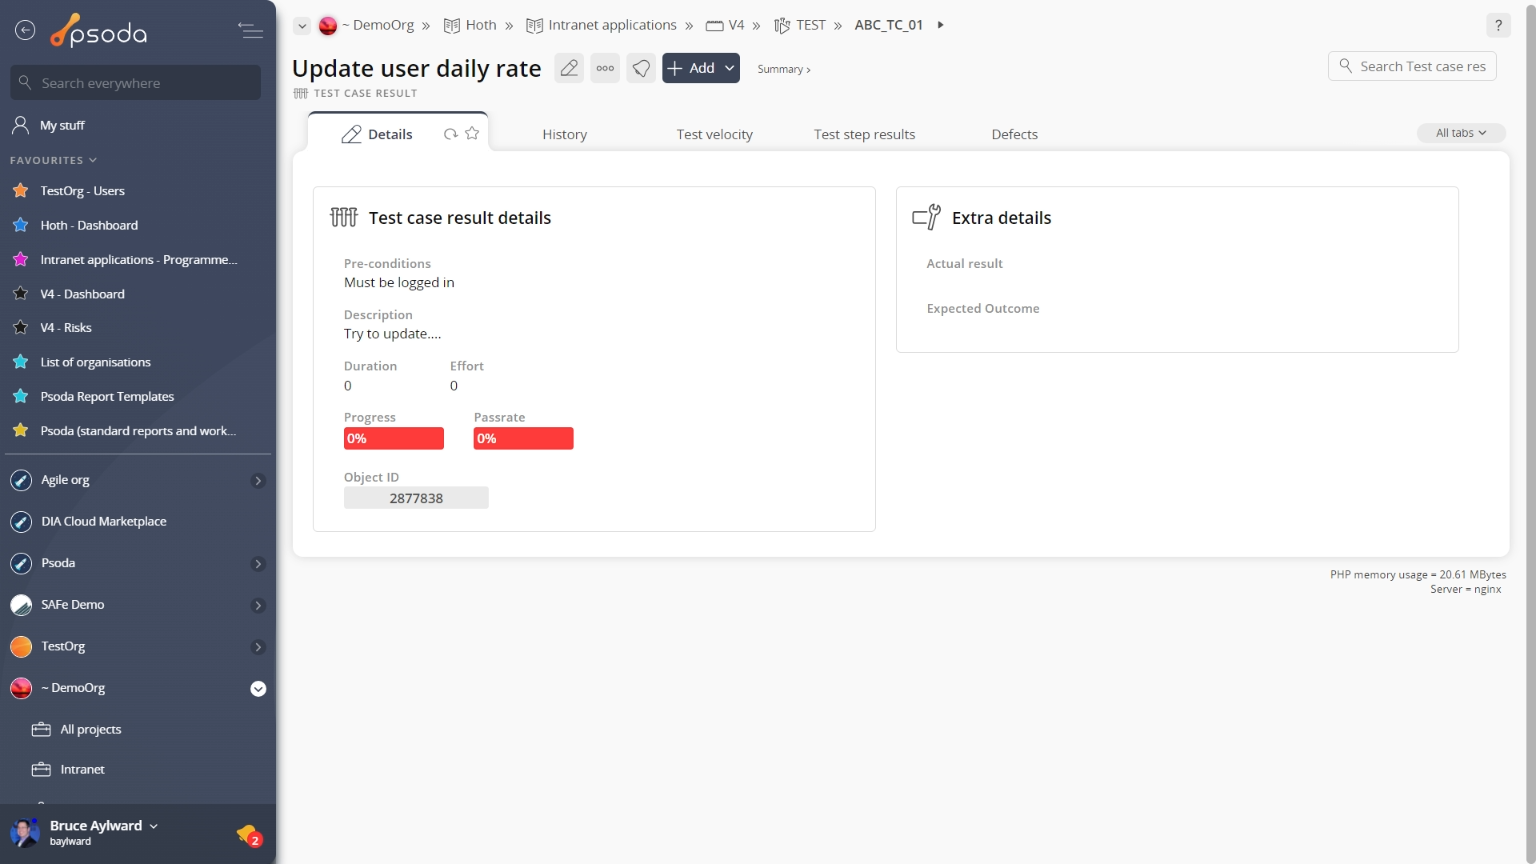
Figure 1 – Test case result view page
The top header area allows you to![]()
Figure 2 – ‘New’ test run
![]()
Figure 3 – ‘Started’ test run
![]()
Figure 4 – ‘Paused’ test run
Note: If the selected test run has been passed, conditionally passed, failed, cancelled or blocked, no further changes can be made to it’s workflow. Some details of the test case result are displayed in subsections just below the top header area, such as the test case result’s location within Psoda, and it’s associated test case, title, status and progress and pass-rate as indicated by progress bars. The rest of the page is made up of a number of tabs or sections (depending on your selected view): Attachments
This tab shows an asset listing of all of the attachments that have been added to this test case result, as shown in Figure 5. By default, this table will present you with a number of details about the attachments such as the file’s name, attachment type, view the version and access a download link.
From the Actions column of this attachments table, you can act on individual attachments by 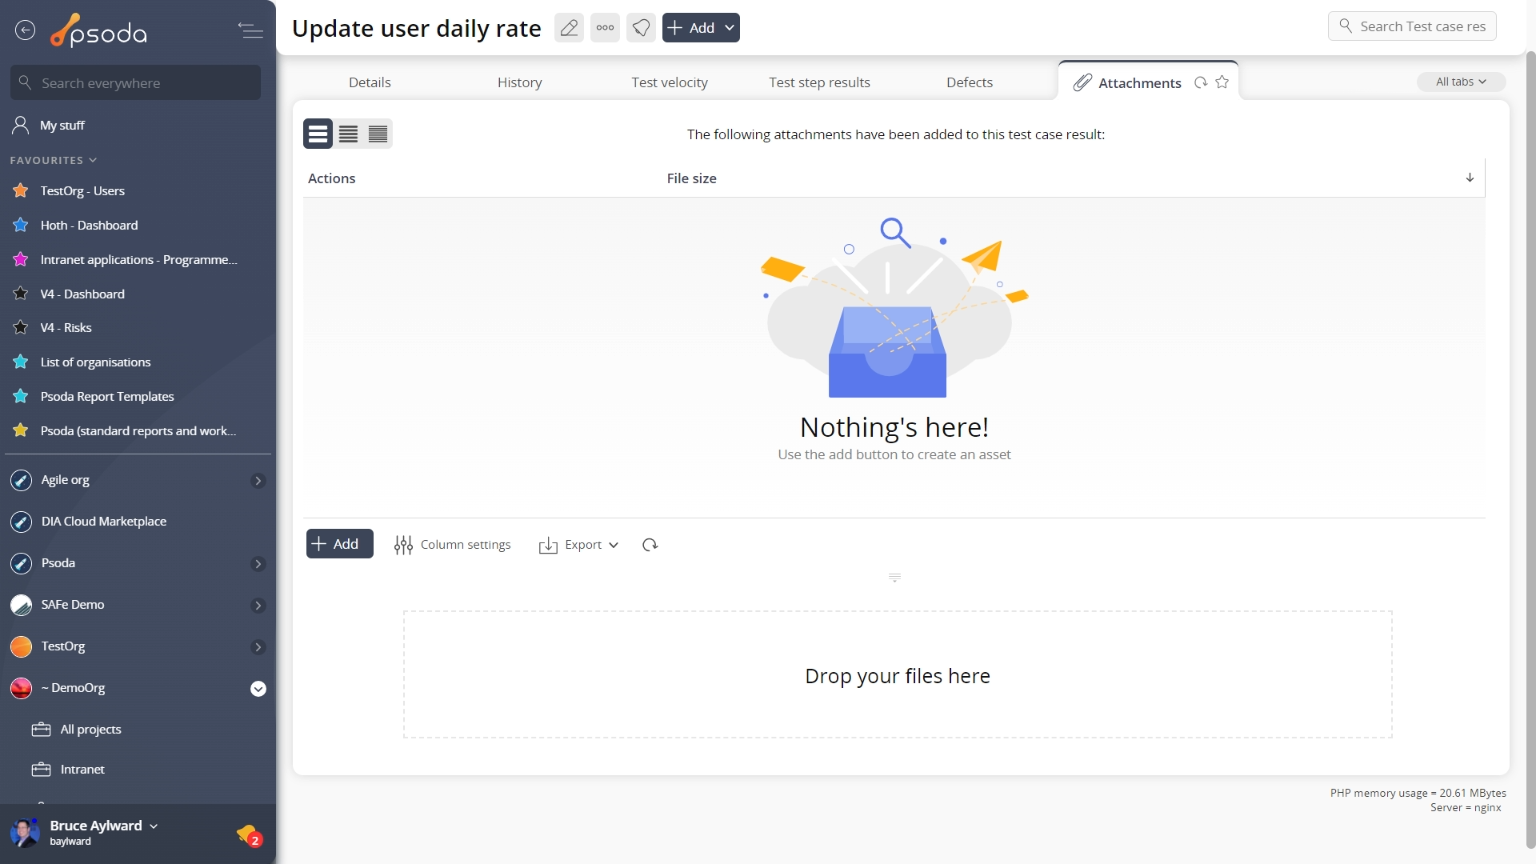
Figure 5 – Test case result attachments tab
Note that you can customise your table view by clicking the Comments
This tab shows an asset listing of all of the comments that 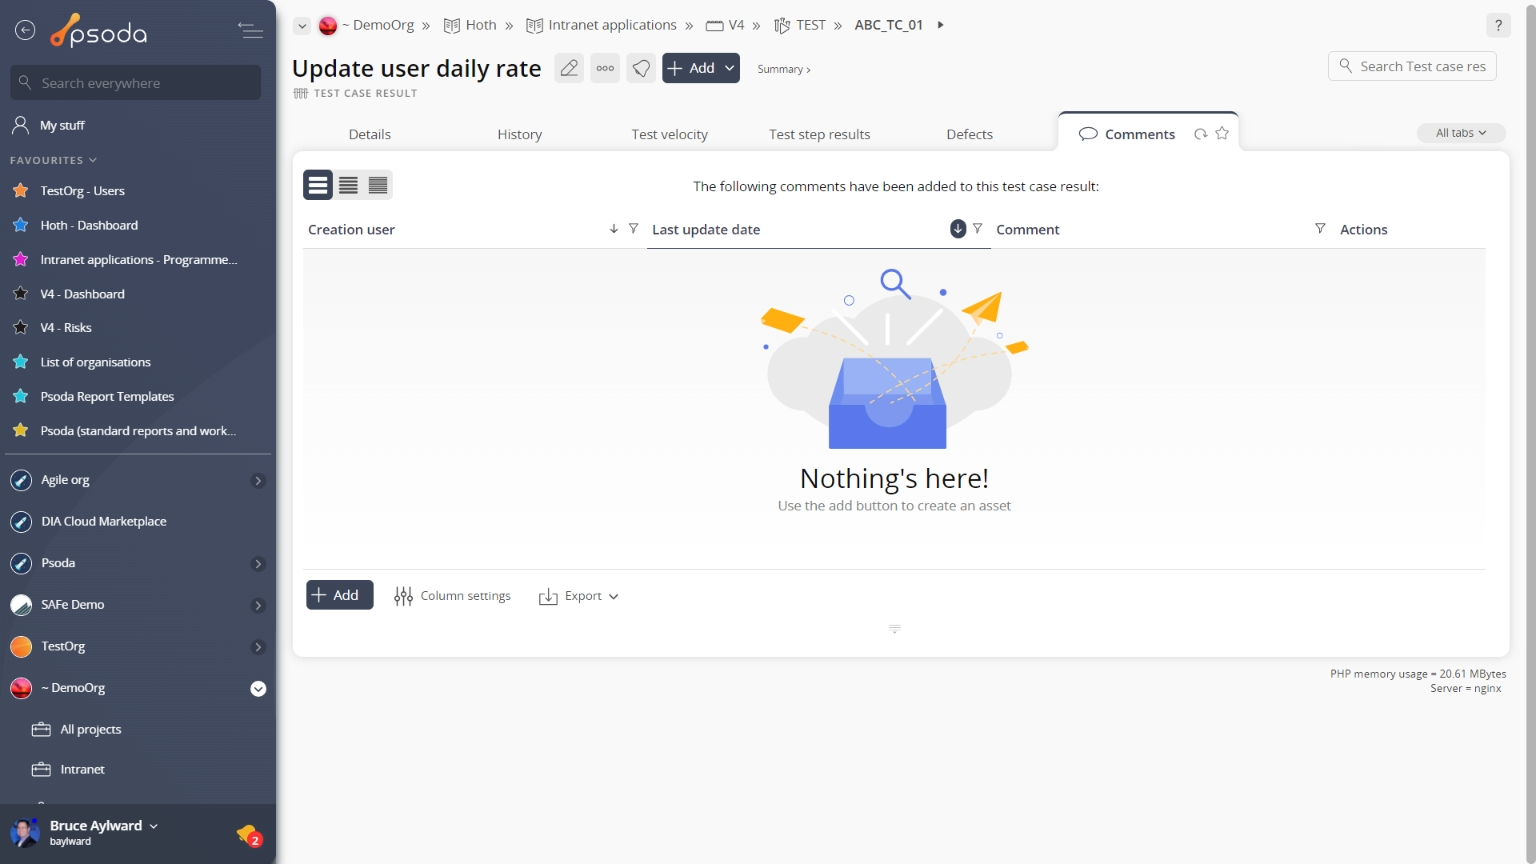
Figure 6 – Test case result comments tab
Note that you can customise your table view by clicking the Defects
This tab shows an asset listing of all of the defects that have been logged for this test case result, as shown in Figure 7. By default, this table will present you with a number of details about the defects such as the defect’s number, type, title, severity, priority, current state, date raised, resolve by date and which user this defect is allocated to, to name a few details.
From the Actions column of this defects table, you can act on individual defects by 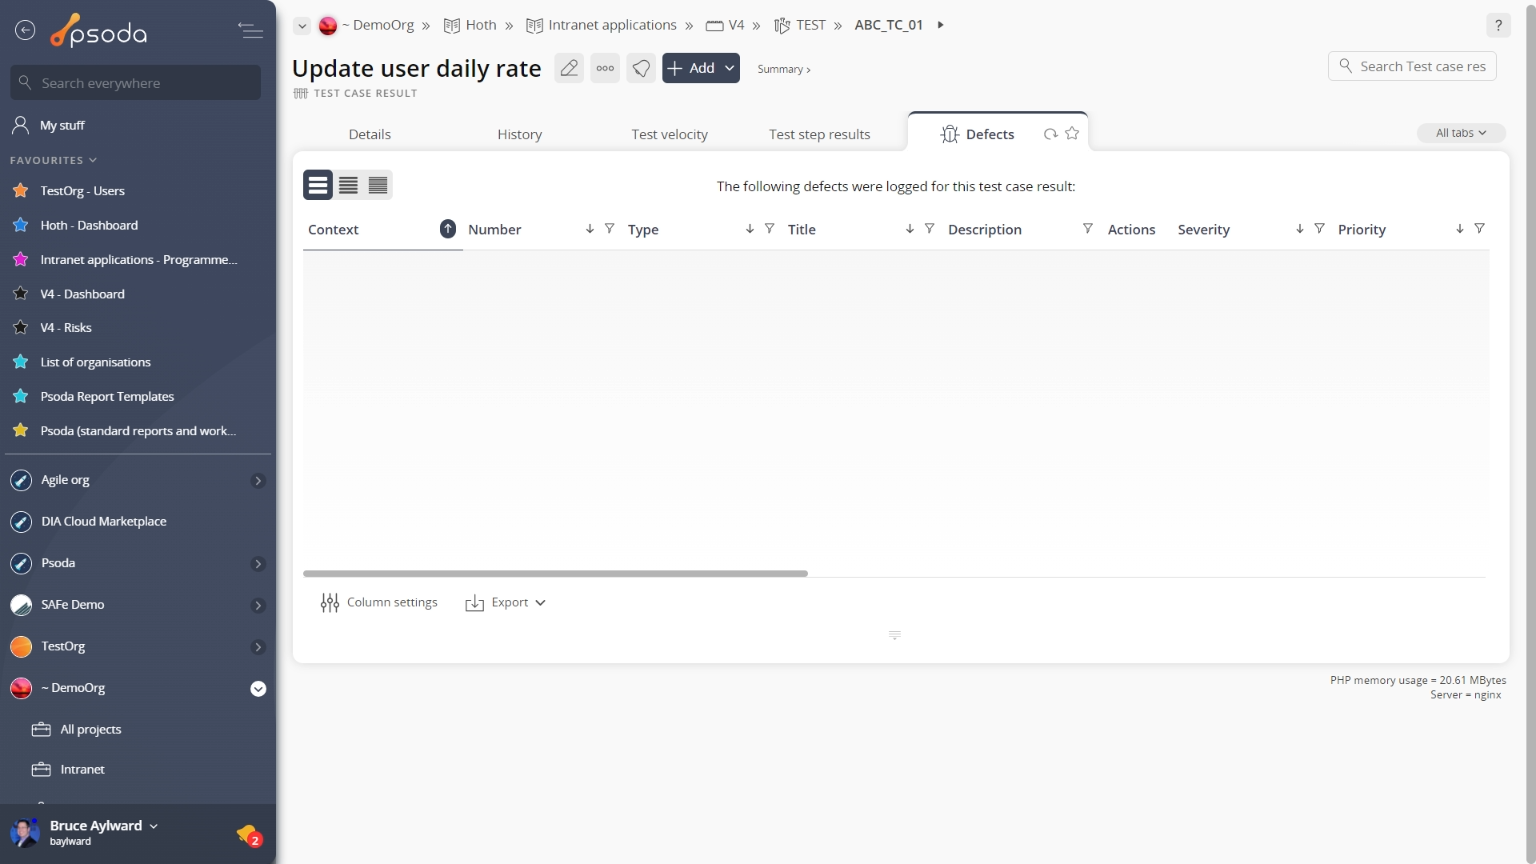
Figure 7 – Test case result defects tab
Note that you can customise your table view by clicking the ![]() edit button at the bottom of the defect table. Here, you can also export this list to
edit button at the bottom of the defect table. Here, you can also export this list to ![]() Excel or
Excel or ![]() CSV files.
CSV files.
 Details
This tab shows some additional details on the test case result such as it’s pre-conditions, description, duration and effort, as shown in Figure 8.
Figure 8 – Test case result details tab
Some fields may allow for inline editing although these permissions may be linked to your access rights. If you feel that you should have access to some of these permissions, contact your System Administrator. History
This tab shows shows some basic history of the test case result, as shown in Figure 9. By default, this tab will present you with a number of details about the test case result’s history such as the creation date, creation user, last update date and last update user. If the test case result has been changed then this section will also show a table of all the changes that has been made, including the date of each change, the field changed, the value before the change and the user who made the change.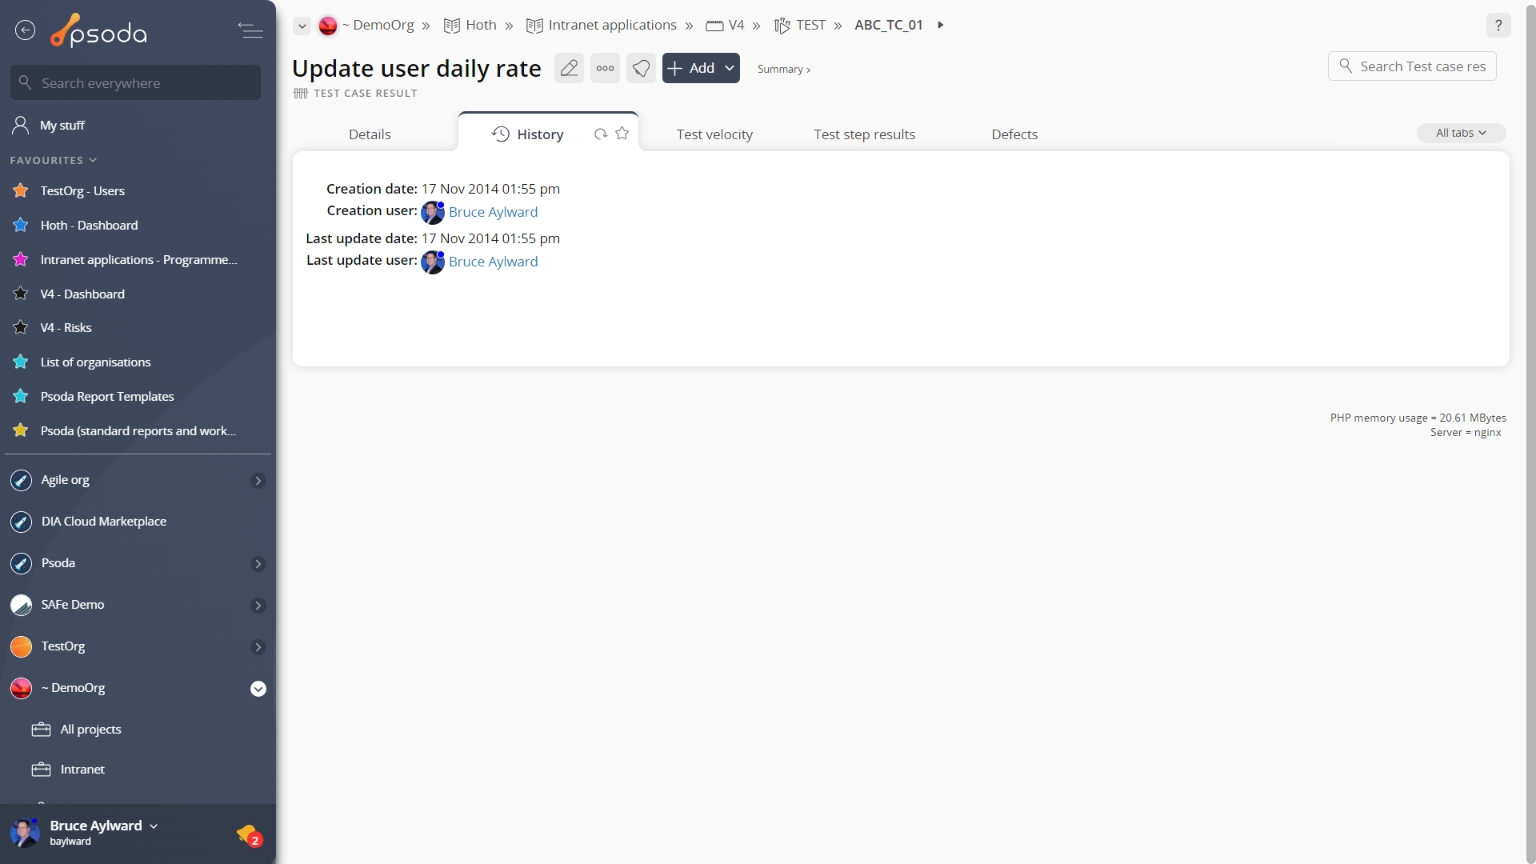
Figure 9 – Test case result history tab
Note that you can customise your change table view by clicking the ![]() edit button at the bottom of the change table. Here, you can also export this list of changes to
edit button at the bottom of the change table. Here, you can also export this list of changes to ![]() Excel or
Excel or ![]() CSV files.
CSV files.
Test velocity
This tab visually shows the progress of this test case result over time, as shown in Figure 10.
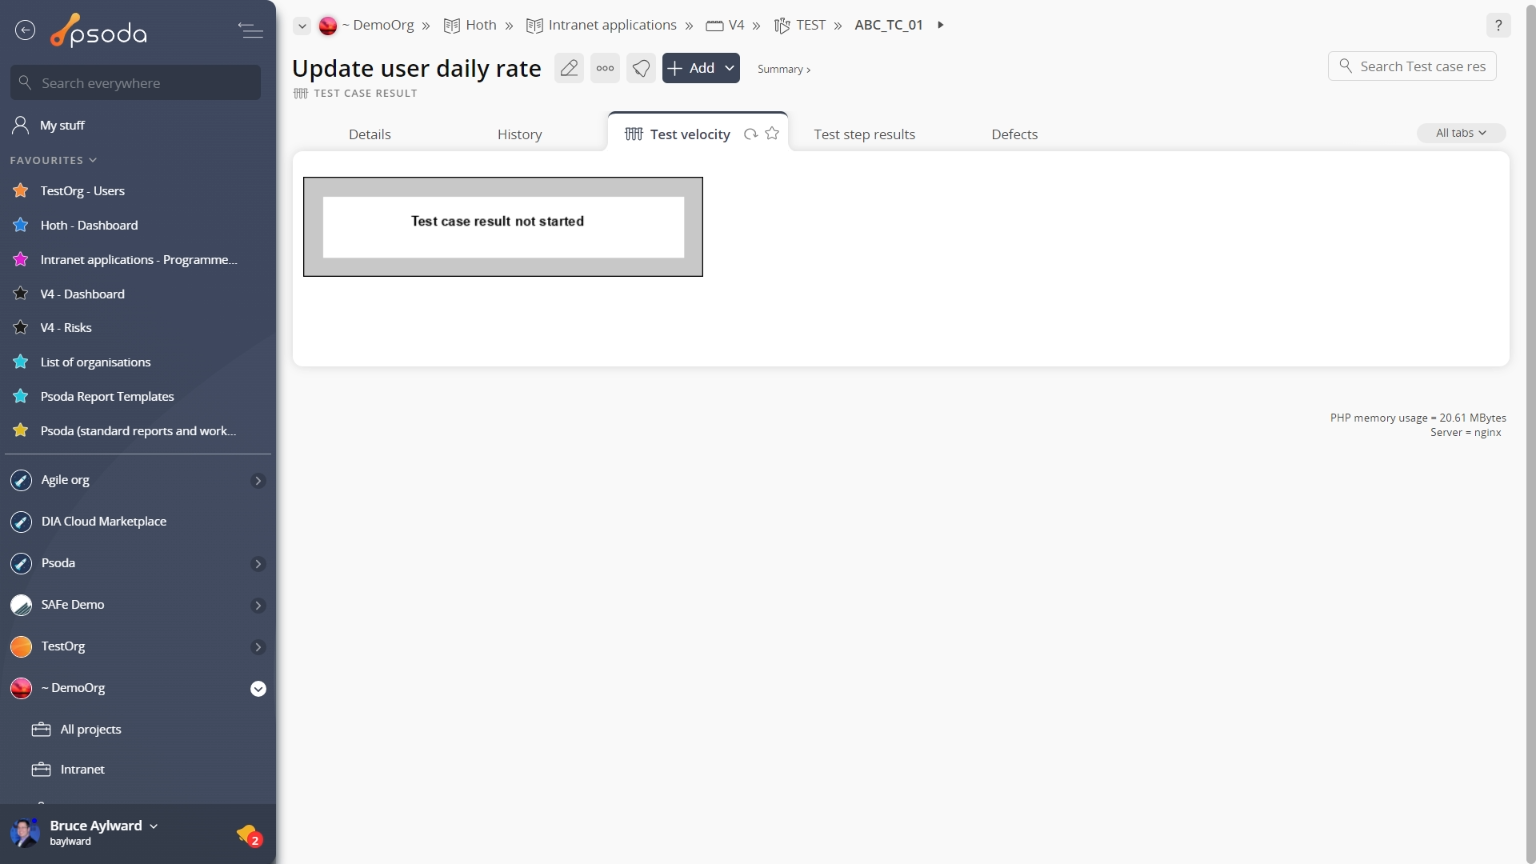
Figure 10 – Test case result test velocity tab
Areas of the chart with a gray background shows the times during which the test case result was in the Started state. The area with a red background shows the progress of test cases completed and the area with the green background shows the percentage of tests that passed. Test step results
This tab shows an asset listing of all of the test step results that have been captured for this test case result, as shown in Figure 11. By default, this table will present you with the test step result’s description, status, duration and effort as well as the number of attachments and defects that are associated with the test step result. If you click on the link under the step column, you will navigate into the selected test step result’s view page.
From the Actions column of this test step results table, you can act on individual results by 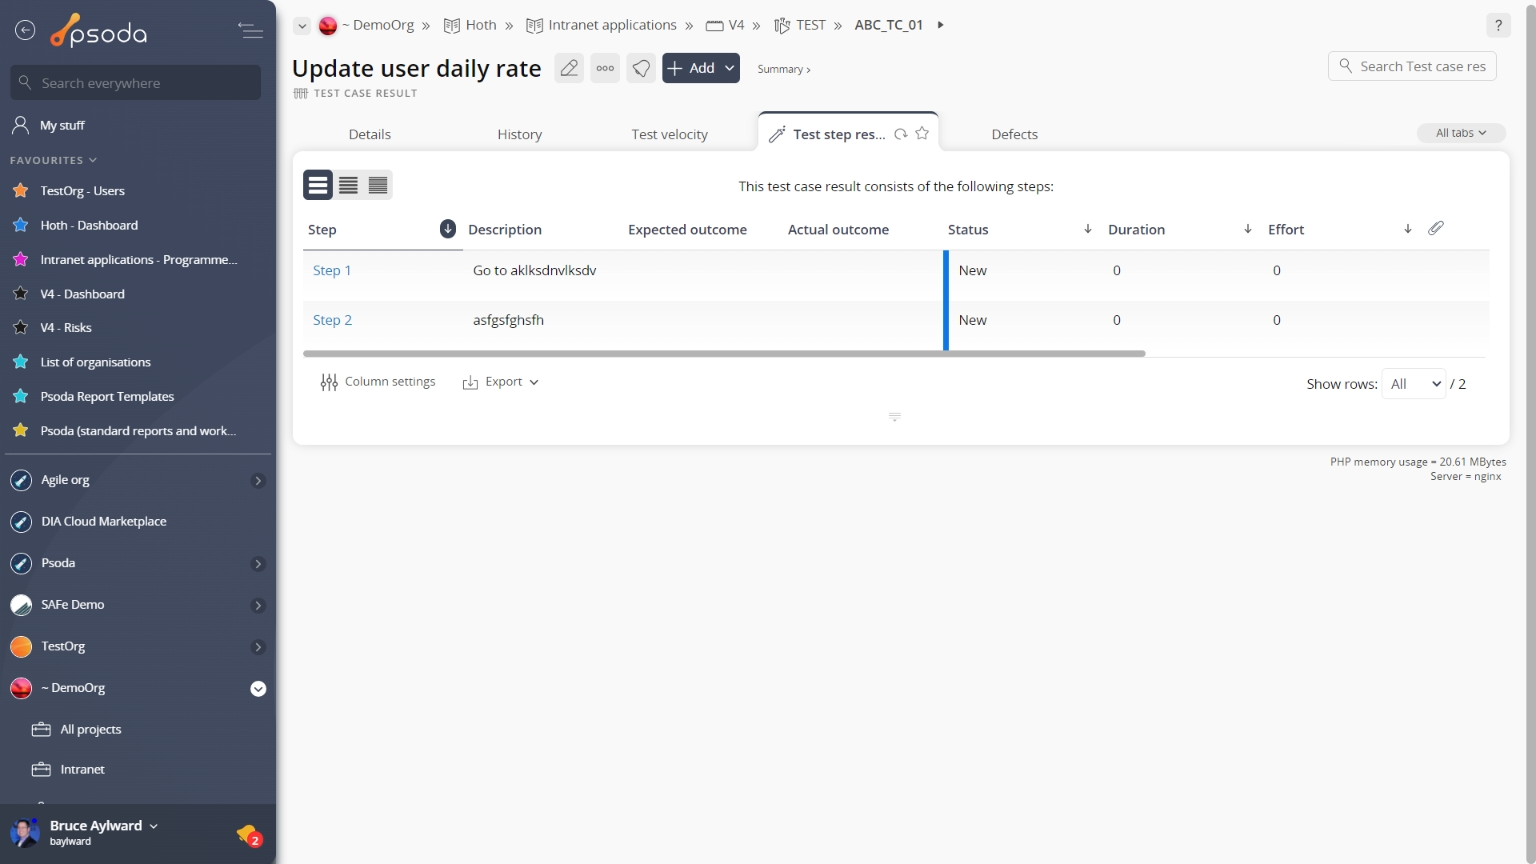
Figure 11 – Test case test step results tab
Note that you can customise your table view by clicking the ![]() edit button at the bottom of the test step results table. Here, you can also export this list to
edit button at the bottom of the test step results table. Here, you can also export this list to ![]() Excel or
Excel or ![]() CSV files.
CSV files.