This page is shown in Figure 1 and shows all the information relating to the selected  risk.
risk.

 edit,
edit,  escalate,
  delete,
  move or
  copy the risk; or to add a new
  issue,
  action,
  lesson,
  attachment or
  comment to this risk.
Some details of the risk are displayed in subsections just below the top header area, such as the risk’s location within Psoda, and it’s category, title, description and owner. In another subsection, you will be presented with information about the risk’s workflow information. From this workflow subsection you may be able to
comment to this risk.
Some details of the risk are displayed in subsections just below the top header area, such as the risk’s location within Psoda, and it’s category, title, description and owner. In another subsection, you will be presented with information about the risk’s workflow information. From this workflow subsection you may be able to  request or
  authorise a state transition. The rest of the page is made up of a number of tabs or sections (depending on your selected view):
This tab shows an asset listing of all of the actions registered for this risk, as shown in Figure 2. By default, this table will present you with a number of details about the actions such as it’s context, reference, description, priority and due date to name a few. If you click on the reference link of the listed action, you will navigate to that action’s view page.
From the Actions column of this actions table, you can act on individual actions by editing, deleting, escalating or moving the chosen action. edit button at the bottom of the action table. Here, you can also export this list to
  Excel or
  CSV files.
This tab shows an asset listing of all of the attachments that have been added to this risk, as shown in Figure 3. By default, this table will present you with a number of details about the attachments such as the file’s name, attachment type, view the version and access a download link.
From the Actions column of this attachments table, you can act on individual attachments by editing, deleting, moving or locking/ unlocking the selected attachment.
 edit button at the bottom of the attachment table or navigate to this same spot to
  add more attachments to this risk. Here, you can also export this list to Excel or CSV files.
At the very bottom of this tabbed view, you have the option to add more attachments by utilising the drag and drop functionality to drag the files you wish to upload into the drop box (note that this function works in HTML5 compliant browsers only).
add more attachments to this risk. Here, you can also export this list to Excel or CSV files.
At the very bottom of this tabbed view, you have the option to add more attachments by utilising the drag and drop functionality to drag the files you wish to upload into the drop box (note that this function works in HTML5 compliant browsers only).
This tab shows an asset listing of all of the comments that  users have made on this risk, as shown in Figure 4. By default, this table will present you with a number of details about the comments such as, the date that this comment was last updated, who created the comment, the comment itself and any associated tags to name a few.
From the Actions column of this comments table, you can act on individual comments by editing or deleting the selected comment.
users have made on this risk, as shown in Figure 4. By default, this table will present you with a number of details about the comments such as, the date that this comment was last updated, who created the comment, the comment itself and any associated tags to name a few.
From the Actions column of this comments table, you can act on individual comments by editing or deleting the selected comment.
 edit button at the bottom of the comment table or navigate to this same spot to add more comments to this risk. Here, you can also export this list to Excel or CSV files.
This tab shows some additional details on the risk, for example the pre and post mitigation probability,proximity, level of risk as visually represented in radar charts as well as the implications and treatment plan, as shown in Figure 5.

This tab shows an asset listing of the asset that this risk has been escalated to, as shown in Figure 6. By default, this table will present you with a number of details about the escalated asset such as the type and name.
You can de-escalate the selected risk from the Actions column of this asset listing.

This tab shows shows some basic history of the risk, as shown in Figure 7. By default, this tab will present you with a number of details about the risk’s history such as the creation date, creation user, last update date and last update user. If the risk has been changed then this section will also show a table of all the changes that has been made, including the date of each change, the field changed, the value before the change and the user who made the change.
This tabbed view shows the issues table as seen in Figure 8, listing any issues that have been logged for this risk. By default, this table provides impact and priority information, plan progress and resolution dates for the issues listed, as well as any actions that can be taken. The workflow column also provides information as to the next workflow transitions available.
The Actions column of the issues table provides accessible functions to act on a chosen issue. These functions include editing, escalating, deleting, moving or adding a comment or attachment to that indicator. add more issues, edit the table columns to show or hide issue information, or export this issue list to Excel or CSV files.
This tabbed view shows the issues table as seen in Figure 9, listing any lessons that have been added for this risk. By default, this table provides a link into a selected lesson itself, as well as providing other information such as the lesson title, description and context. The workflow column also provides information as to the next workflow transitions available, if a workflow has been selected upon lesson creation.
The Actions column of the lessons table provides accessible functions to act on a chosen issue. These functions include editing, escalating, deleting, moving or adding comments or attachments to that lesson.
add another lesson, or  import a number of lessons from a CSV file, edit the table columns to show or hide lesson information, or export this lesson list to Excel or CSV files.
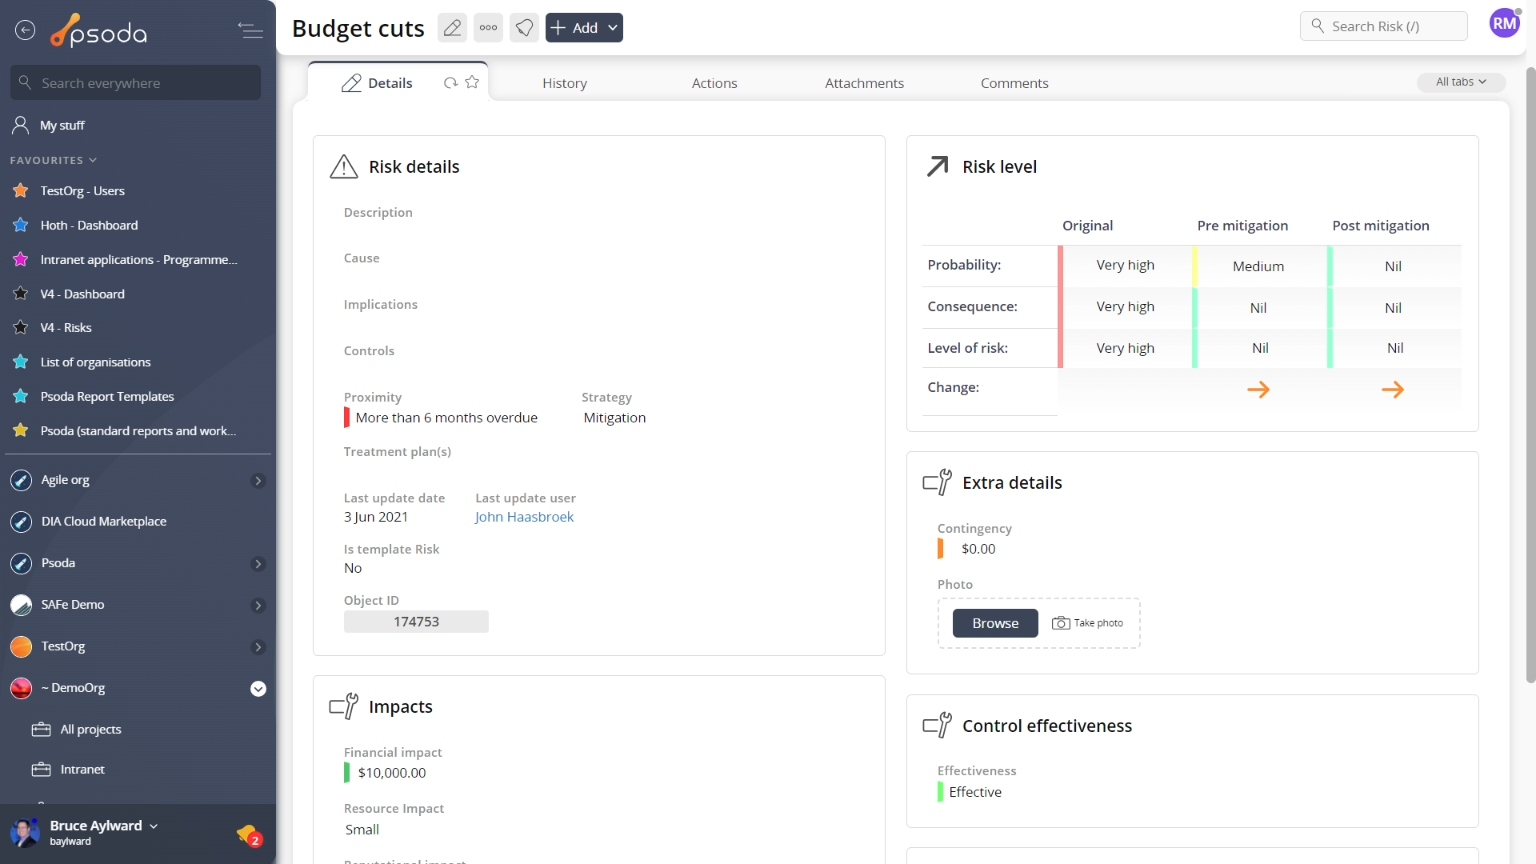
Figure 1 – Risk view page
The top header area allows you to Actions
This tab shows an asset listing of all of the actions registered for this risk, as shown in Figure 2. By default, this table will present you with a number of details about the actions such as it’s context, reference, description, priority and due date to name a few. If you click on the reference link of the listed action, you will navigate to that action’s view page.
From the Actions column of this actions table, you can act on individual actions by 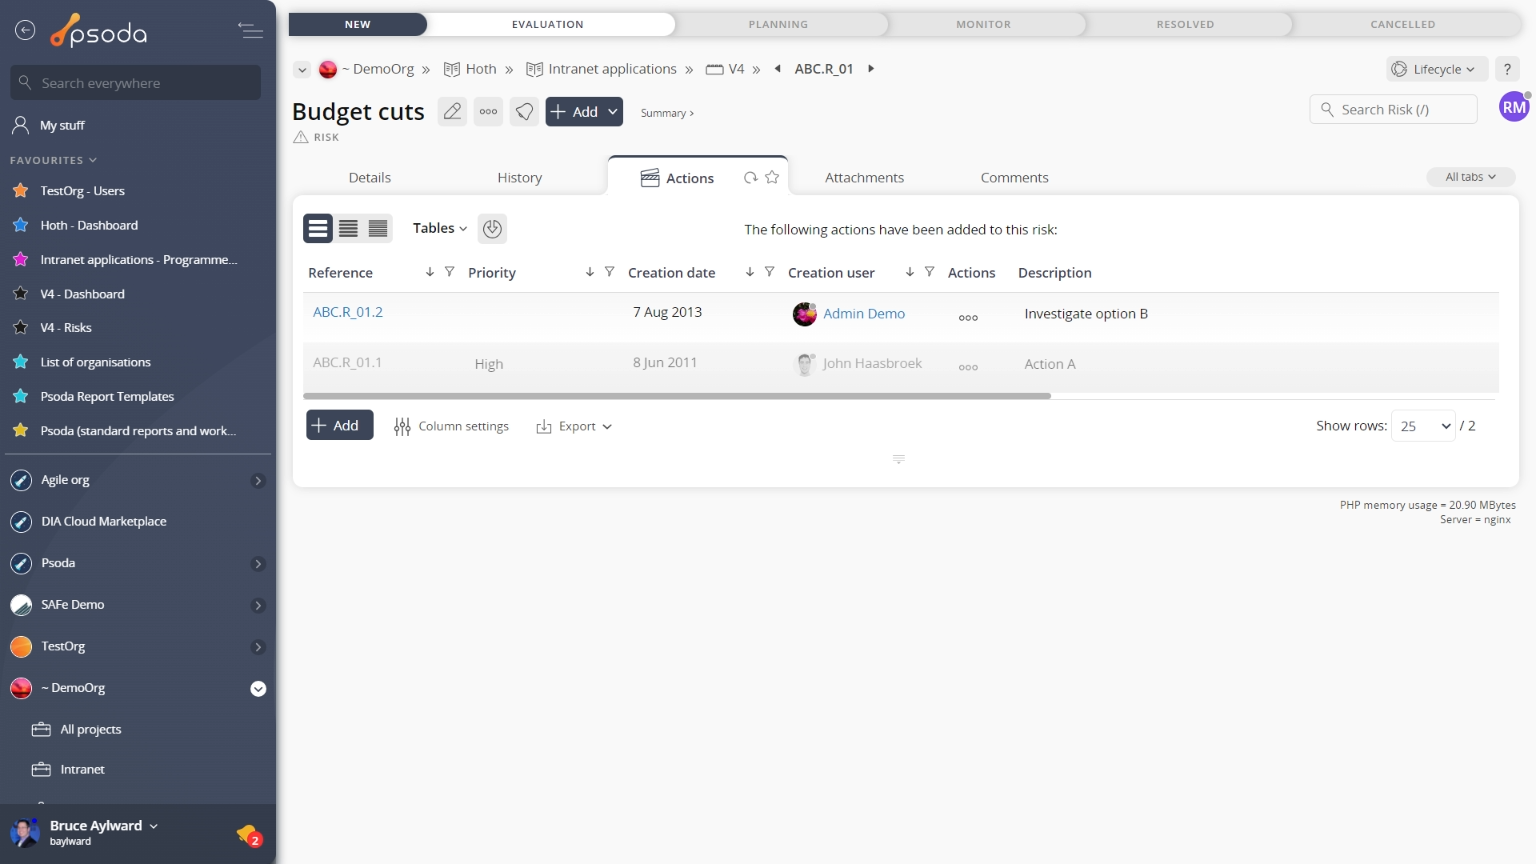
Figure 2 – Risk actions tab
Note that you can customise your table view by clicking the Attachments
This tab shows an asset listing of all of the attachments that have been added to this risk, as shown in Figure 3. By default, this table will present you with a number of details about the attachments such as the file’s name, attachment type, view the version and access a download link.
From the Actions column of this attachments table, you can act on individual attachments by 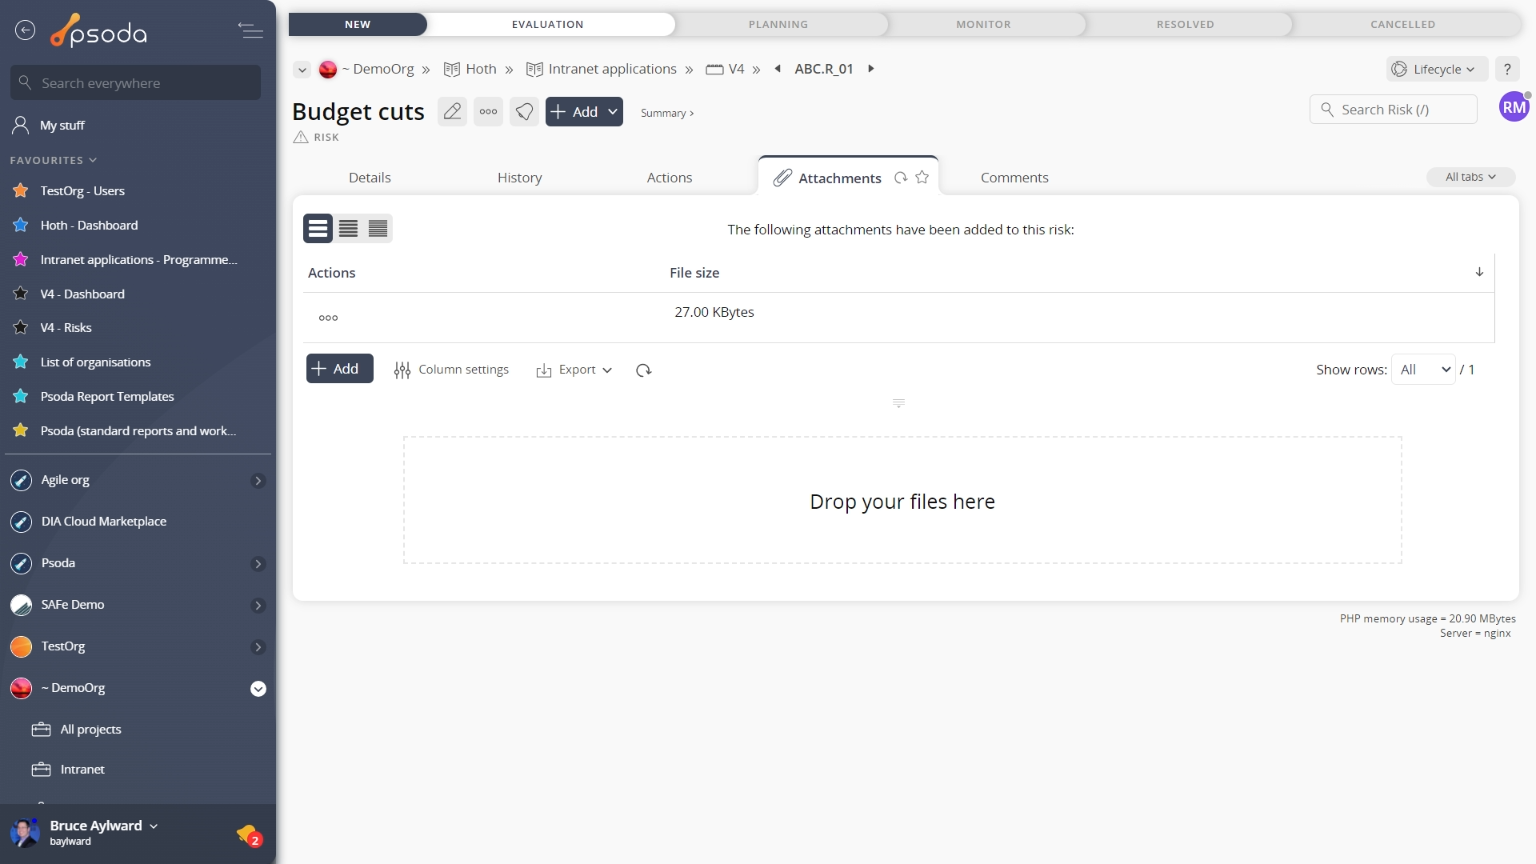
Figure 3 – Risk attachments tab
Note that you can customise your table view by clicking the Comments
This tab shows an asset listing of all of the comments that 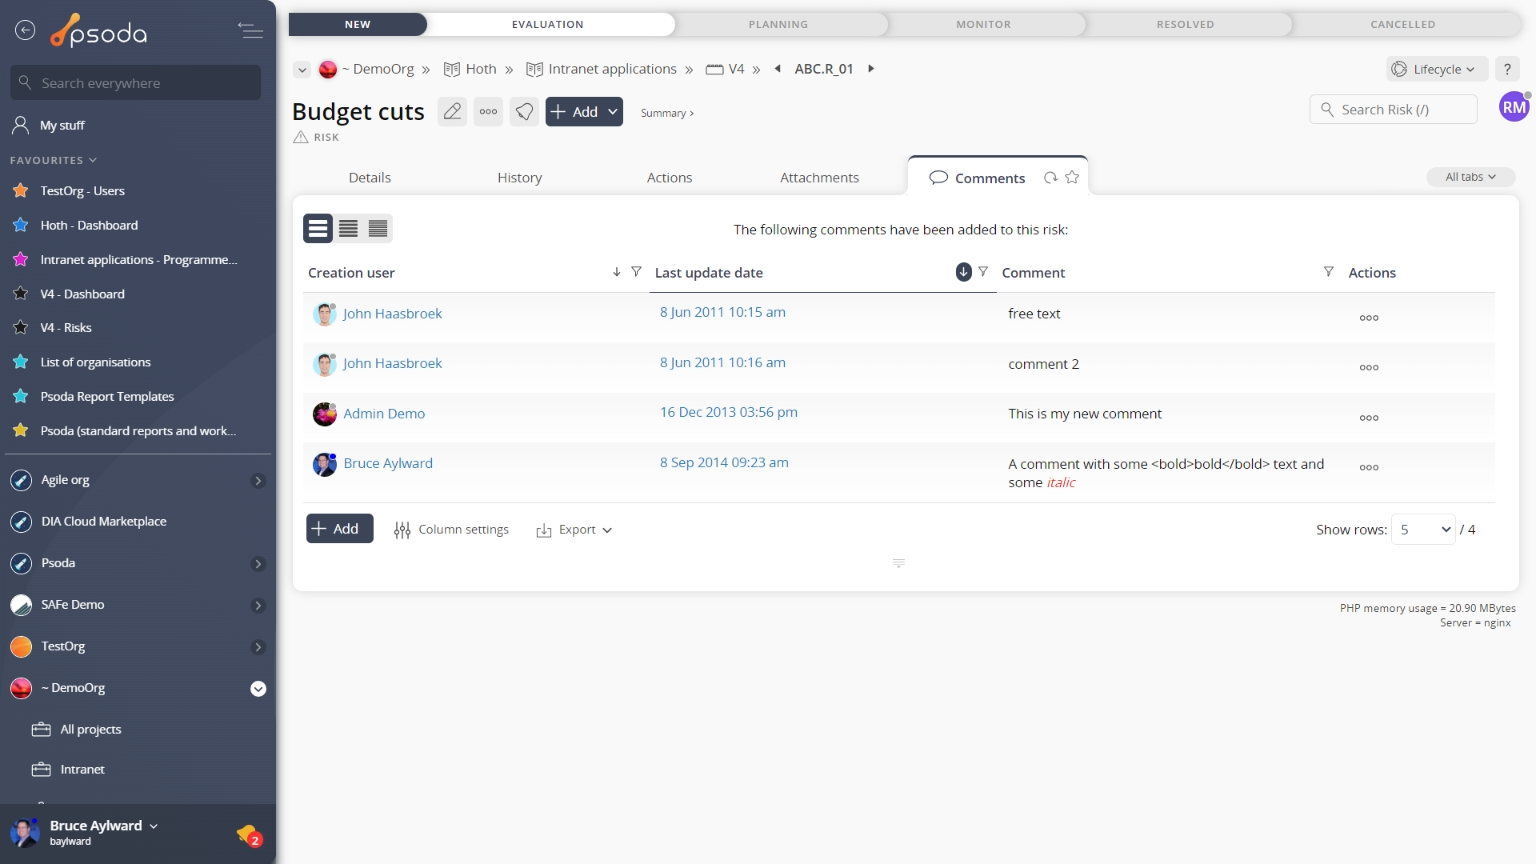
Figure 4 – Risk comments tab
Note that you can customise your table view by clicking the Details
This tab shows some additional details on the risk, for example the pre and post mitigation probability,proximity, level of risk as visually represented in radar charts as well as the implications and treatment plan, as shown in Figure 5.
Figure 5 – Risk details tab
Some fields may allow for inline editing although these permissions may be linked to your access rights. If you feel that you should have access to some of these permissions, contact your System Administrator. Escalated
This tab shows an asset listing of the asset that this risk has been escalated to, as shown in Figure 6. By default, this table will present you with a number of details about the escalated asset such as the type and name.
You can de-escalate the selected risk from the Actions column of this asset listing.
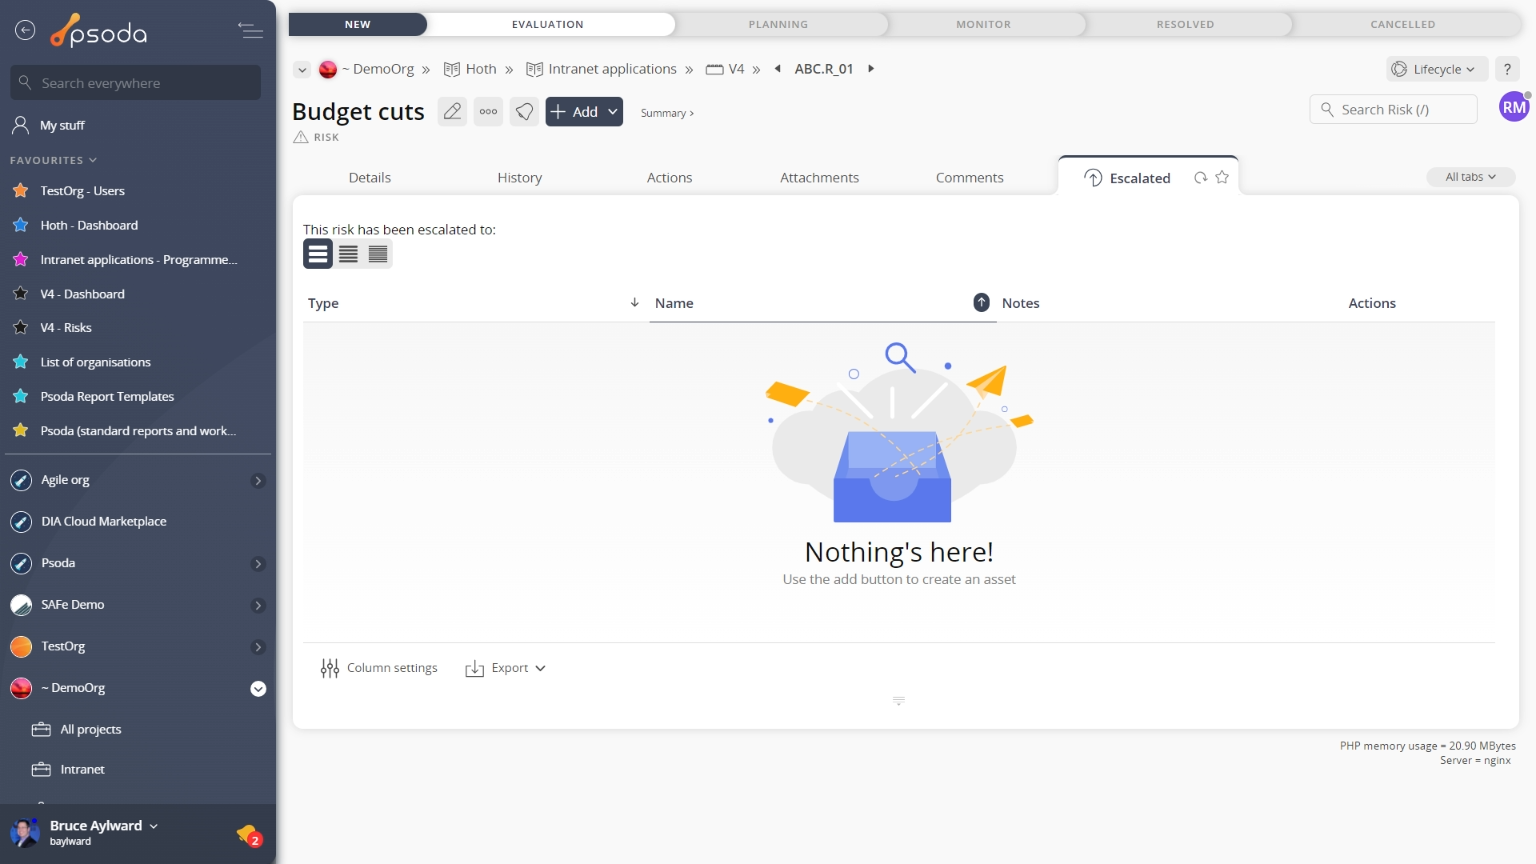
Figure 6 – Risk escalated tab
Note that you can customise your table view by clicking the ![]() edit button at the bottom of the escalated table. Here, you can also export this list to
edit button at the bottom of the escalated table. Here, you can also export this list to ![]() Excel or
Excel or ![]() CSV files.
CSV files.
 History
This tab shows shows some basic history of the risk, as shown in Figure 7. By default, this tab will present you with a number of details about the risk’s history such as the creation date, creation user, last update date and last update user. If the risk has been changed then this section will also show a table of all the changes that has been made, including the date of each change, the field changed, the value before the change and the user who made the change.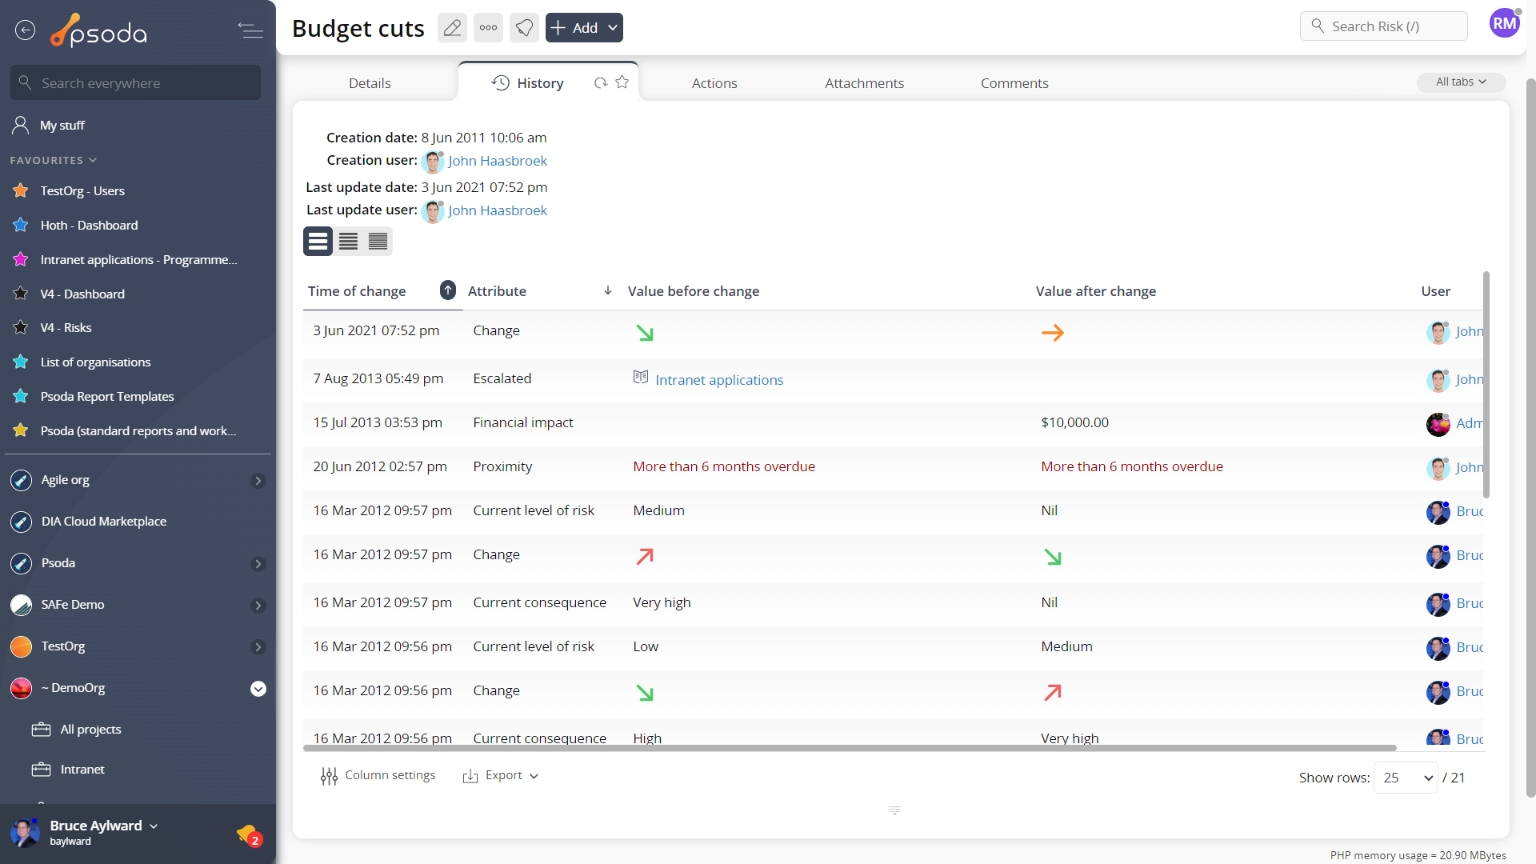
Figure 7 – Risk history tab
Note that you can customise your change table view by clicking the ![]() edit button at the bottom of the change table. Here, you can also export this list of changes to
edit button at the bottom of the change table. Here, you can also export this list of changes to ![]() Excel or
Excel or ![]() CSV files.
CSV files.
Issues
This tabbed view shows the issues table as seen in Figure 8, listing any issues that have been logged for this risk. By default, this table provides impact and priority information, plan progress and resolution dates for the issues listed, as well as any actions that can be taken. The workflow column also provides information as to the next workflow transitions available.
The Actions column of the issues table provides accessible functions to act on a chosen issue. These functions include 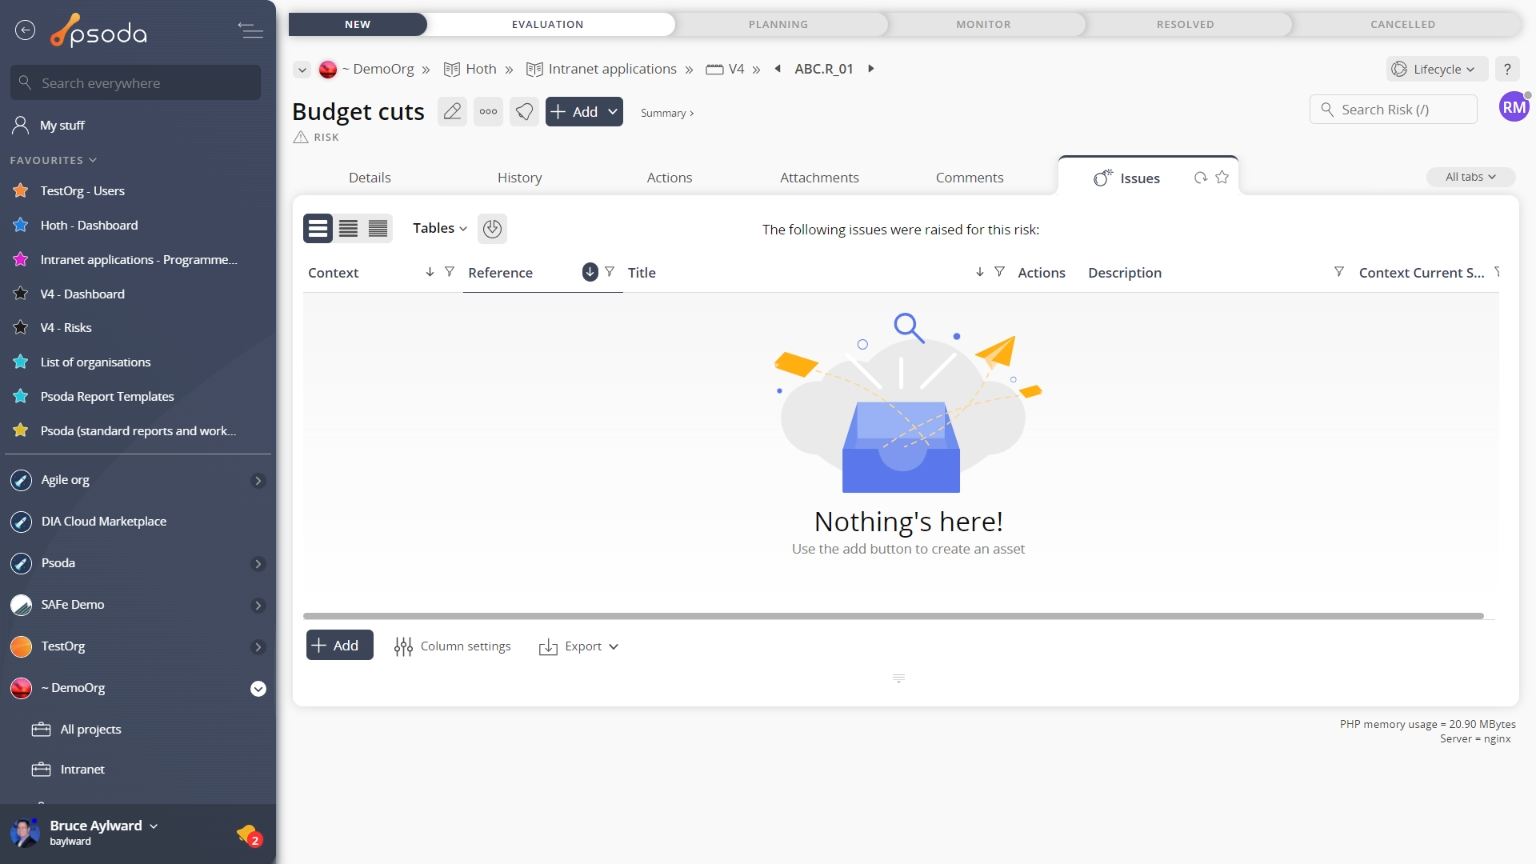
Figure 8 – Risk issues tab
Note that at the bottom of the table you can Lessons
This tabbed view shows the issues table as seen in Figure 9, listing any lessons that have been added for this risk. By default, this table provides a link into a selected lesson itself, as well as providing other information such as the lesson title, description and context. The workflow column also provides information as to the next workflow transitions available, if a workflow has been selected upon lesson creation.
The Actions column of the lessons table provides accessible functions to act on a chosen issue. These functions include 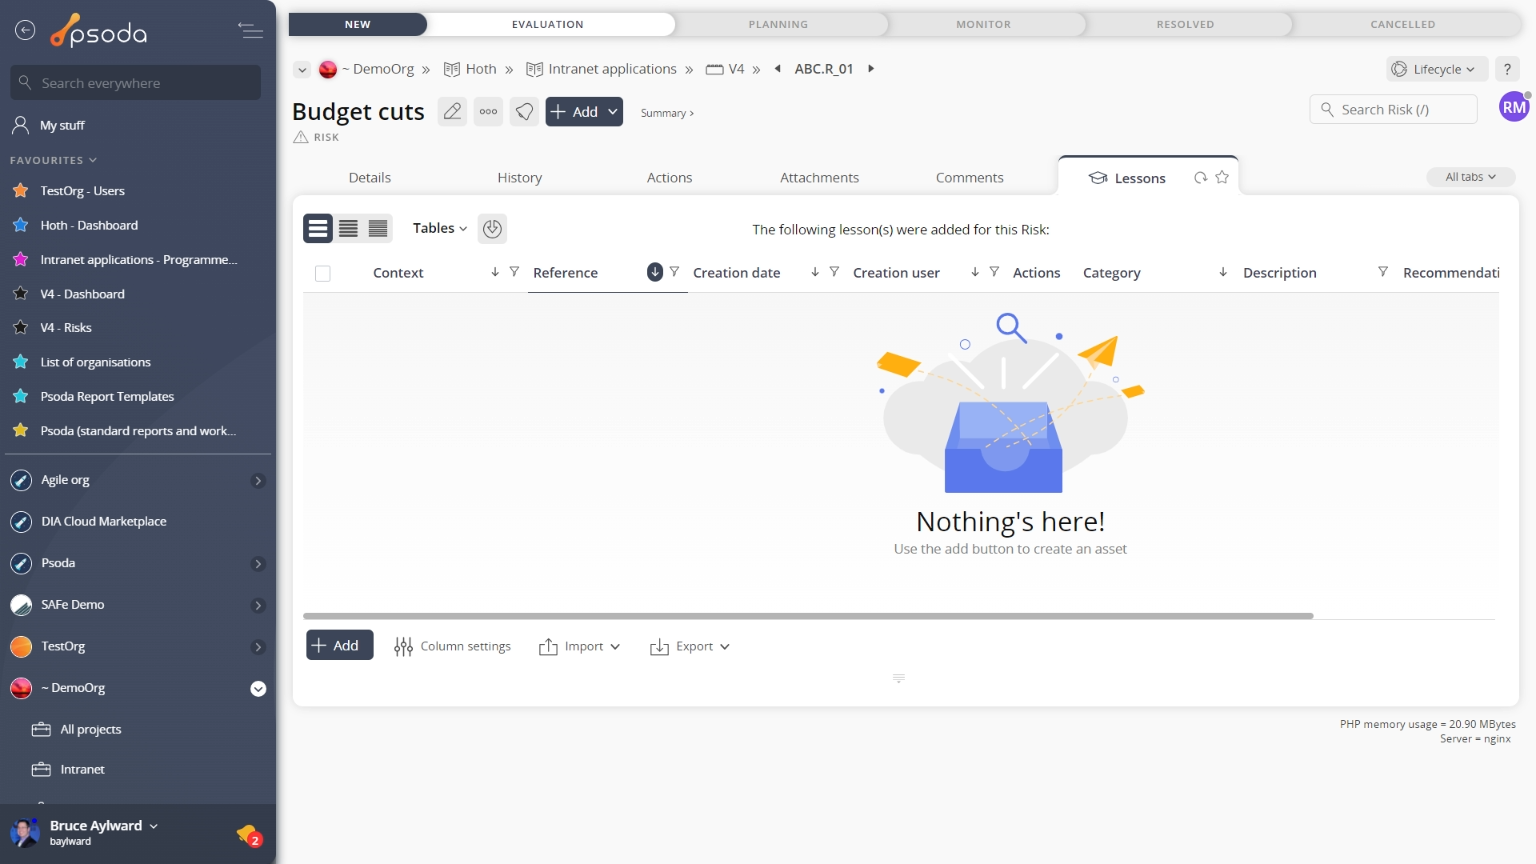 Figure 9 – Risk lessons tab