Figure 1 – Test run view page
The top header area allows you to![]()
Figure 2 – ‘New’ test run
![]()
Figure 3 – ‘Started’ test run
![]()
Figure 4 – ‘Paused’ test run
Note: If the selected test run has been passed, failed or cancelled, no further changes can be made to it’s workflow. Some details of the test run are displayed in subsections just below the top header area, such as the test run’s location within Psoda, and it’s description, status, progress and pass-rate as indicated by progress bars and scheduling information. The rest of the page is made up of a number of tabs or sections (depending on your selected view): Attachments
This tab shows an asset listing of all of the attachments that have been added to this test run, as shown in Figure 5. By default, this table will present you with a number of details about the attachments such as the file’s name, attachment type, view the version and access a download link.
From the Actions column of this attachments table, you can act on individual attachments by 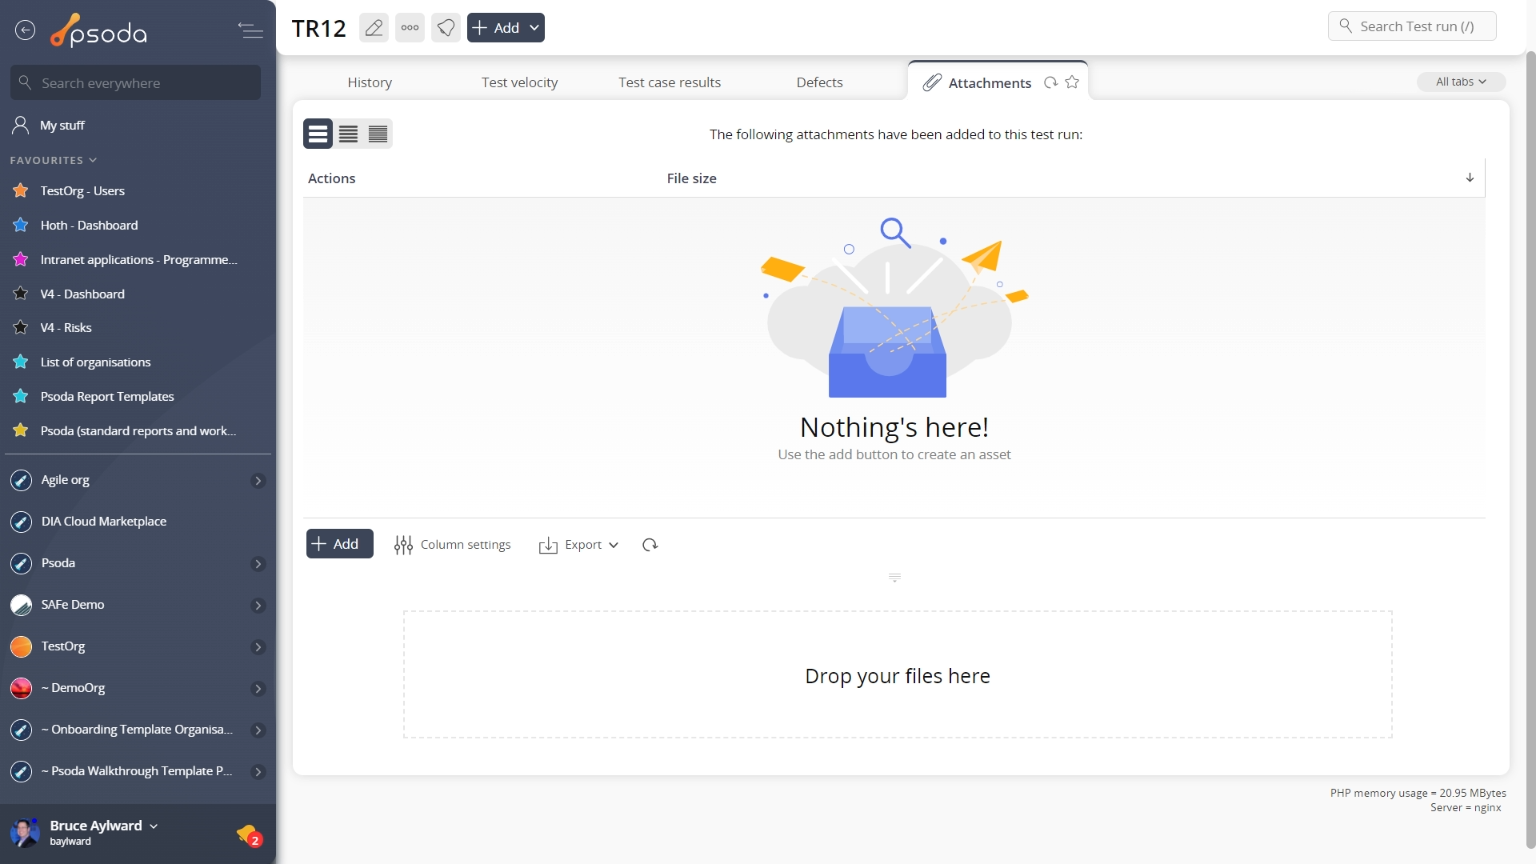
Figure 5 – Test run attachments tab
Note that you can customise your table view by clicking the Comments
This tab shows an asset listing of all of the comments that 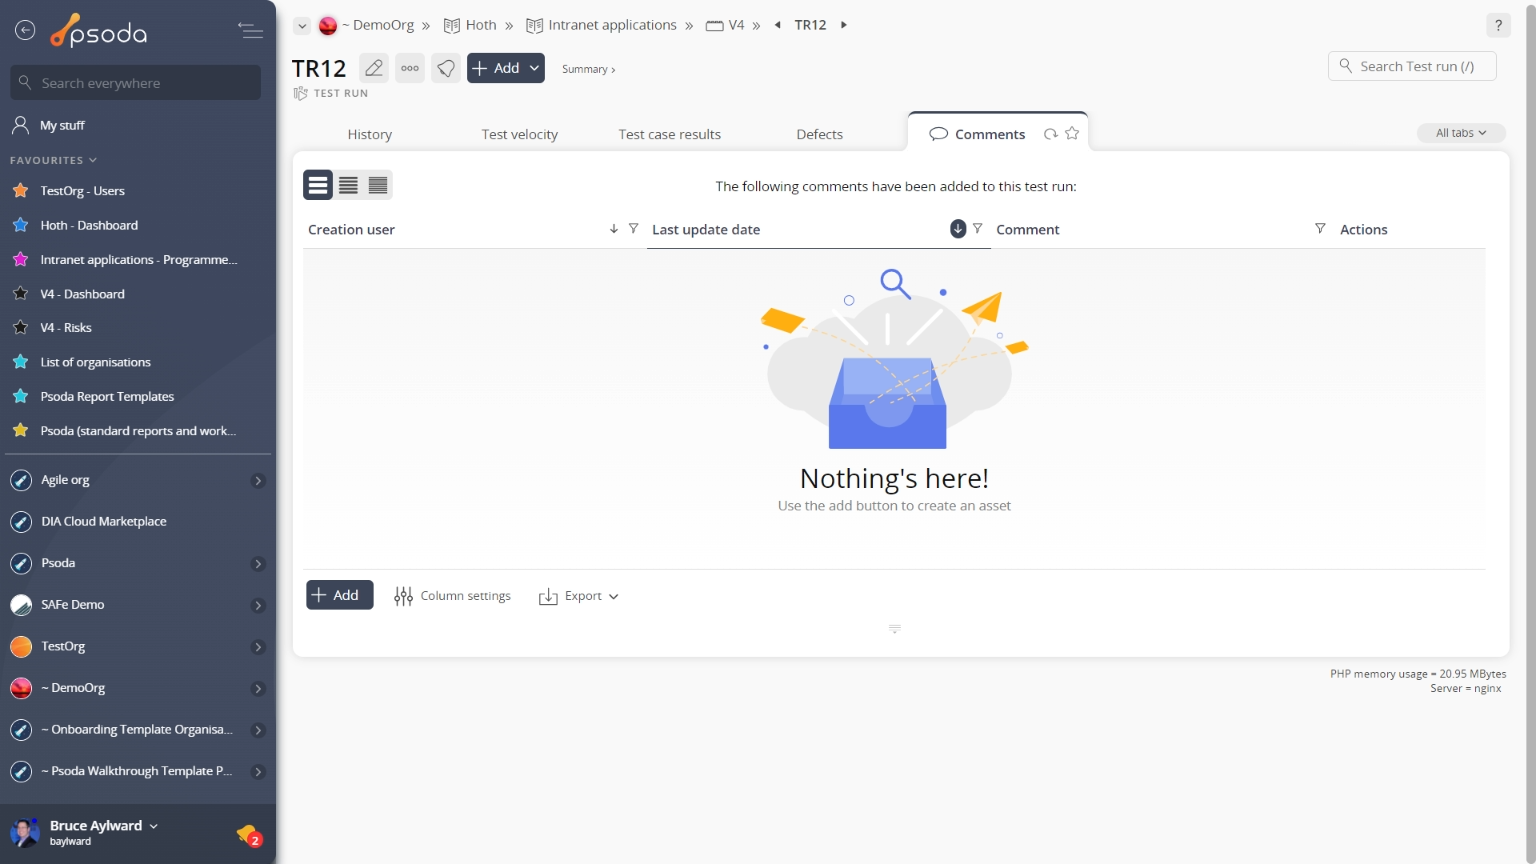
Figure 6 – Test run comments tab
Note that you can customise your table view by clicking the  Dashboard
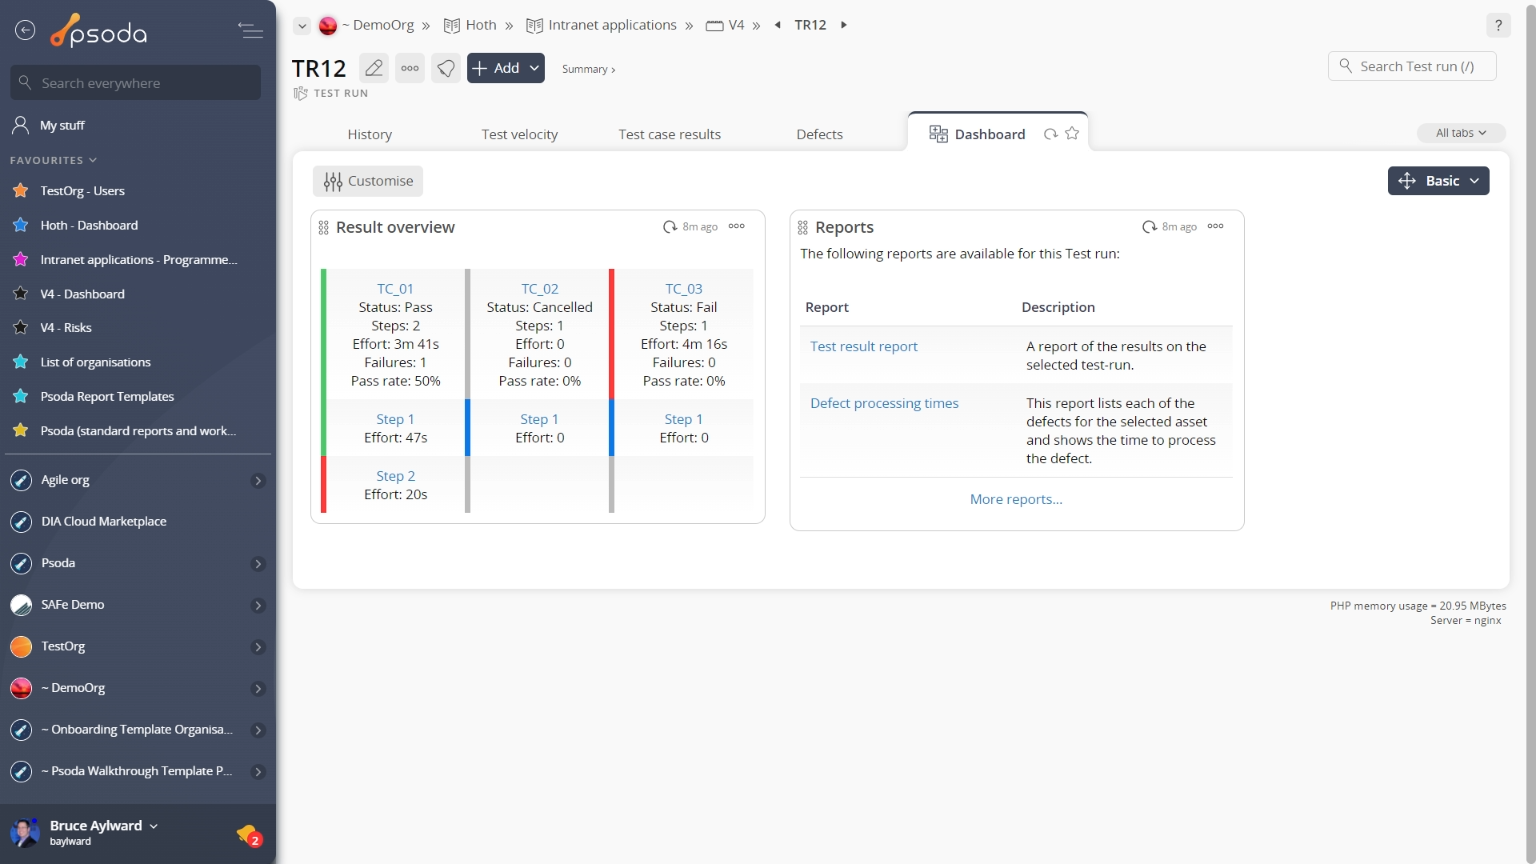
This tabbed view will display a collection of customisable dashlets, related to the test run you are currently viewing. In Figure 7 below, our “example test run” has the Result overview dashlet readily available, to show asset listings of the assets at this project level.
Figure 7 – Test run dashboard tab
You can rearrange the order of you dashboard dashlets by utilising the drag-n-drop function, selecting the title of the dashlet to be moved and dragging it to it’s new position.
You may show or hide any dashlets that you need at a given point in time by selecting the ![]() Customise dashboard link at the very bottom of this tabbed view.
Customise dashboard link at the very bottom of this tabbed view.
 Defects
This tab shows an asset listing of all of the defects that have been logged for this test run, as shown in Figure 8. By default, this table will present you with a number of details about the defects such as the defect’s number, type, title, severity, priority, current state, date raised, resolve by date and which user this defect is allocated to, to name a few details.
From the Actions column of this defects table, you can act on individual defects by 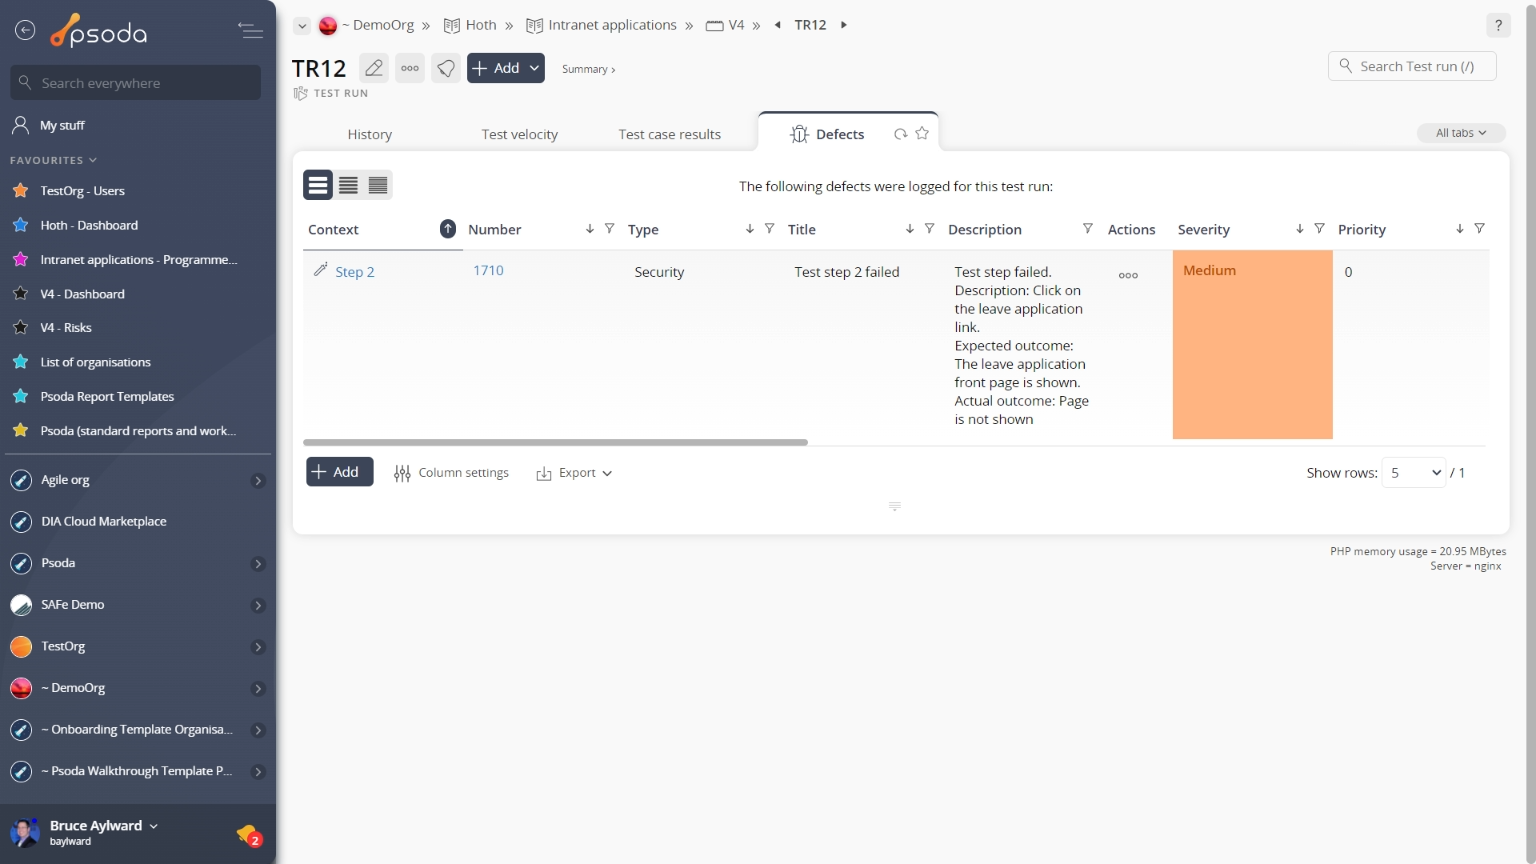
Figure 8 – Test run defects tab
Note that you can customise your table view by clicking the ![]() edit button at the bottom of the defect table. Here, you can also export this list to
edit button at the bottom of the defect table. Here, you can also export this list to ![]() Excel or
Excel or ![]() CSV files.
CSV files.
 History
This tab shows shows some basic history of the test run, as shown in Figure 9. By default, this tab will present you with a number of details about the test run’s history such as the creation date, creation user, last update date and last update user. If the test run has been changed then this section will also show a table of all the changes that has been made, including the date of each change, the field changed, the value before the change and the user who made the change.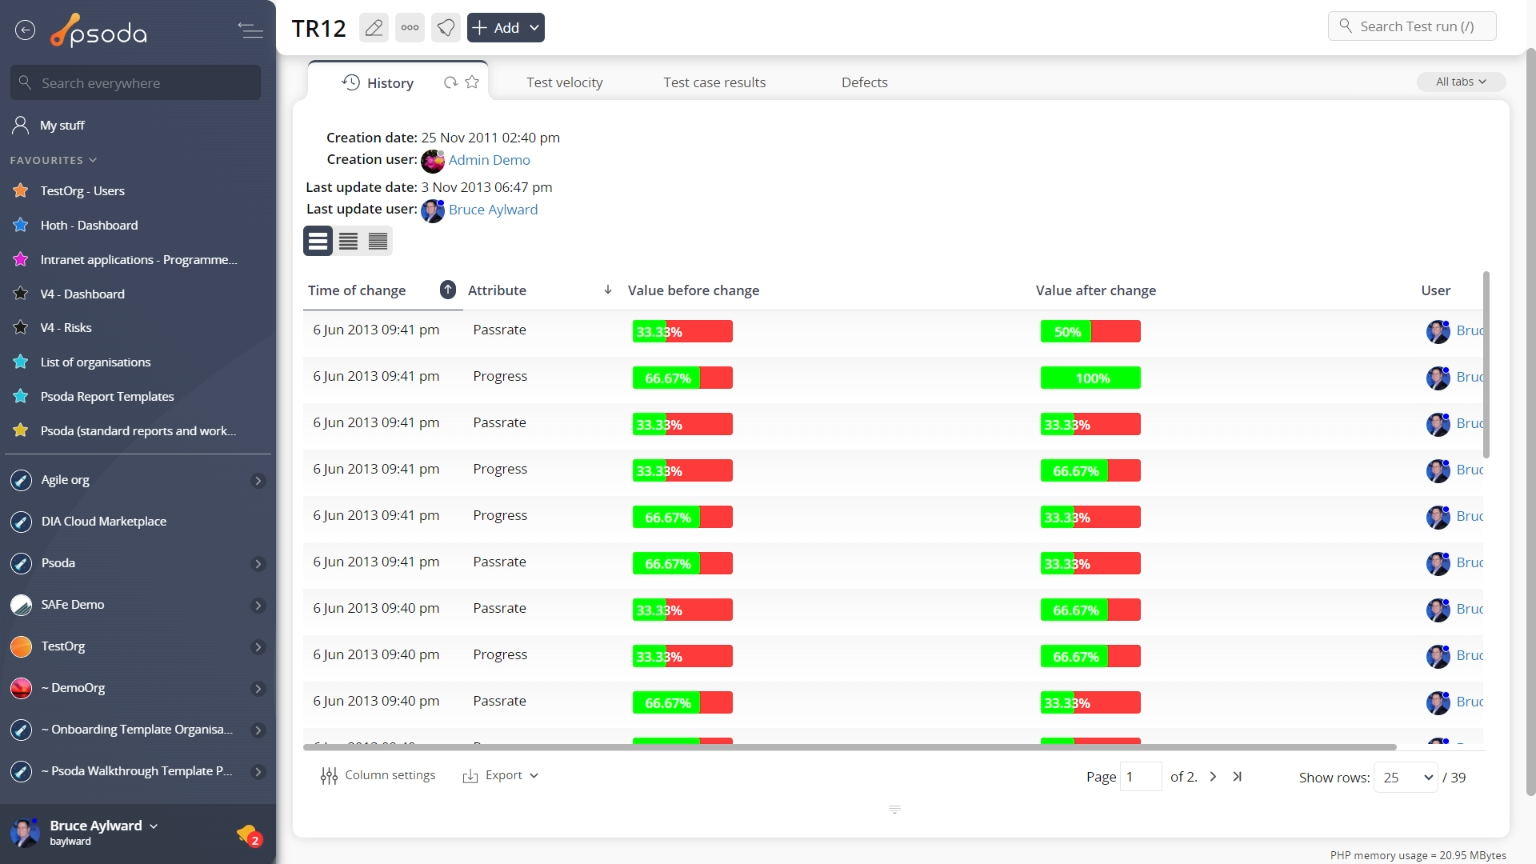
Figure 9 – Test run history tab
Note that you can customise your change table view by clicking the ![]() edit button at the bottom of the change table. Here, you can also export this list of changes to
edit button at the bottom of the change table. Here, you can also export this list of changes to ![]() Excel or
Excel or ![]() CSV files.
CSV files.
 Test velocity
This tab visually shows the progress of this test run over time, as shown in Figure 10.
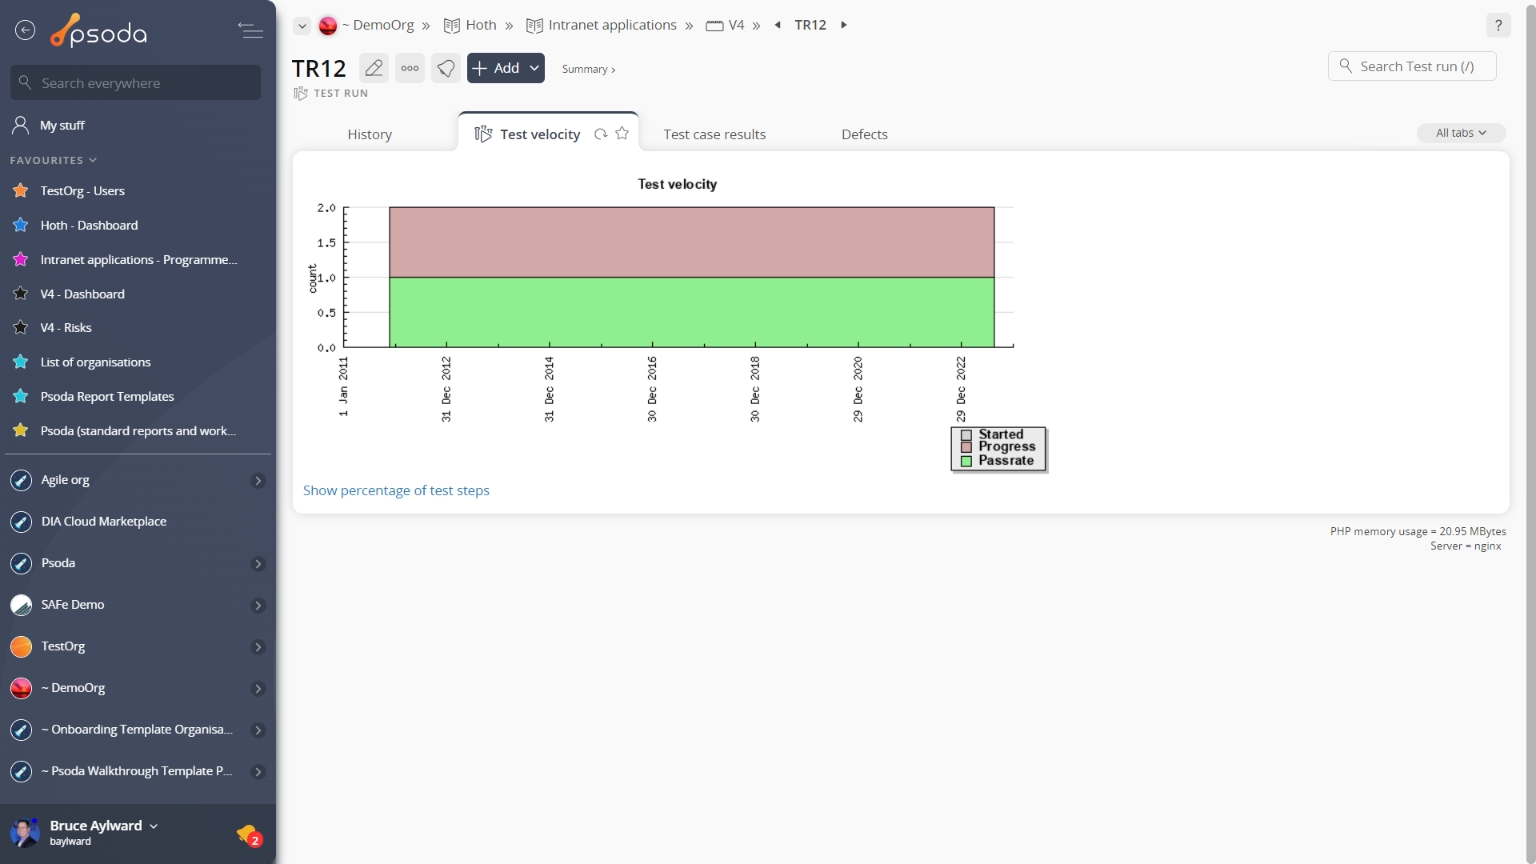
Figure 10 – Test run test velocity tab
Areas of the chart with a gray background shows the times during which the test run was in the Started state. The area with a red background shows the progress of test cases completed and the area with the green background shows the percentage of tests that passed. Test case results
This tab shows an asset listing of all of the test case results that have been captured for this test run, as shown in Figure 11. By default, this table will present you with the test case result’s last update date. reference, title, pre-conditions, description, progress and passrate bars and status. If you click on the link under the reference column, you will navigate into the selected test case result’s view page.
From the Actions column of this test case results table, you can act on individual results by 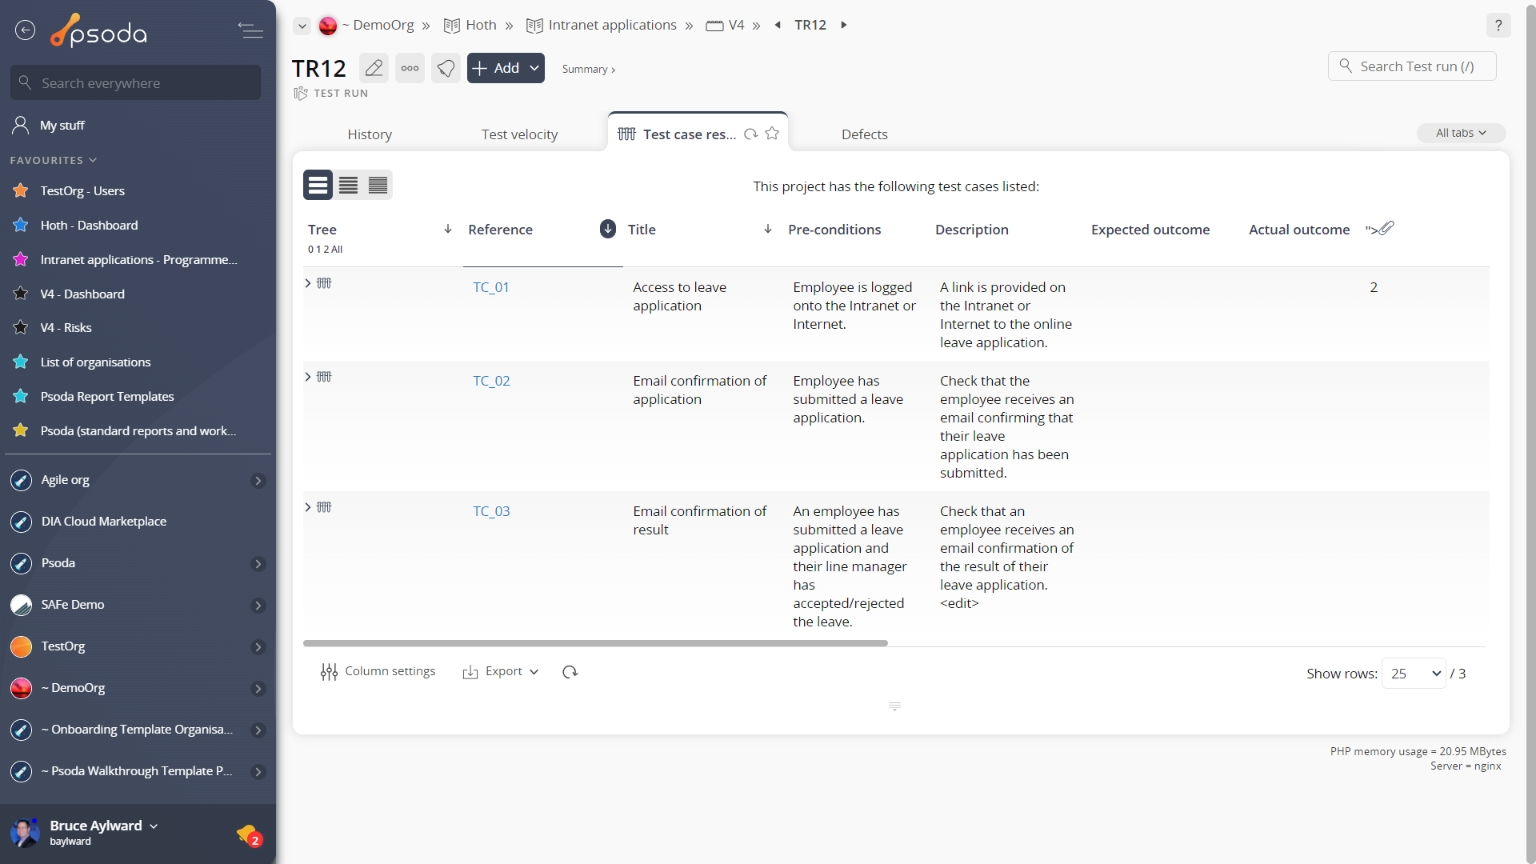
Figure 11 – Test run test case results tab
Note that you can customise your table view by clicking the ![]() edit button at the bottom of the test case results table. Here, you can also export this list to
edit button at the bottom of the test case results table. Here, you can also export this list to ![]() Excel or
Excel or ![]() CSV files.
CSV files.