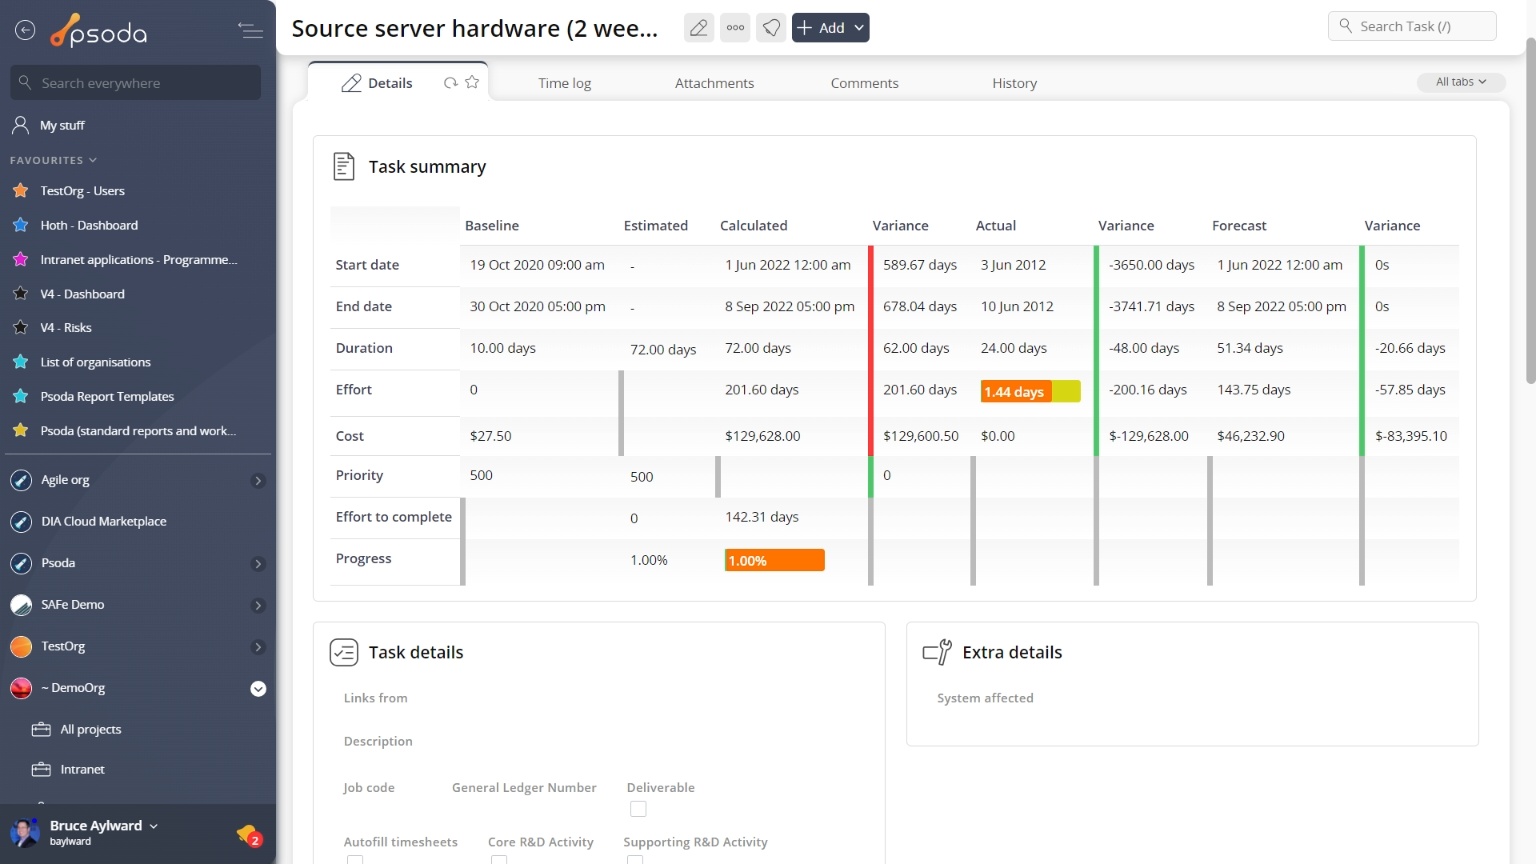
Figure 1 – Task view page
The top header area at the top of the top header area allows you to Actions
This tab shows an asset listing of all of the actions registered for this task, as shown in Figure 2. By default, this table will present you with a number of details about the actions such as it’s reference, description, priority and due date to name a few. If you click on the reference link of the listed action, you will navigate to that action’s view page.
From the Actions column of this actions table, you can act on individual actions by 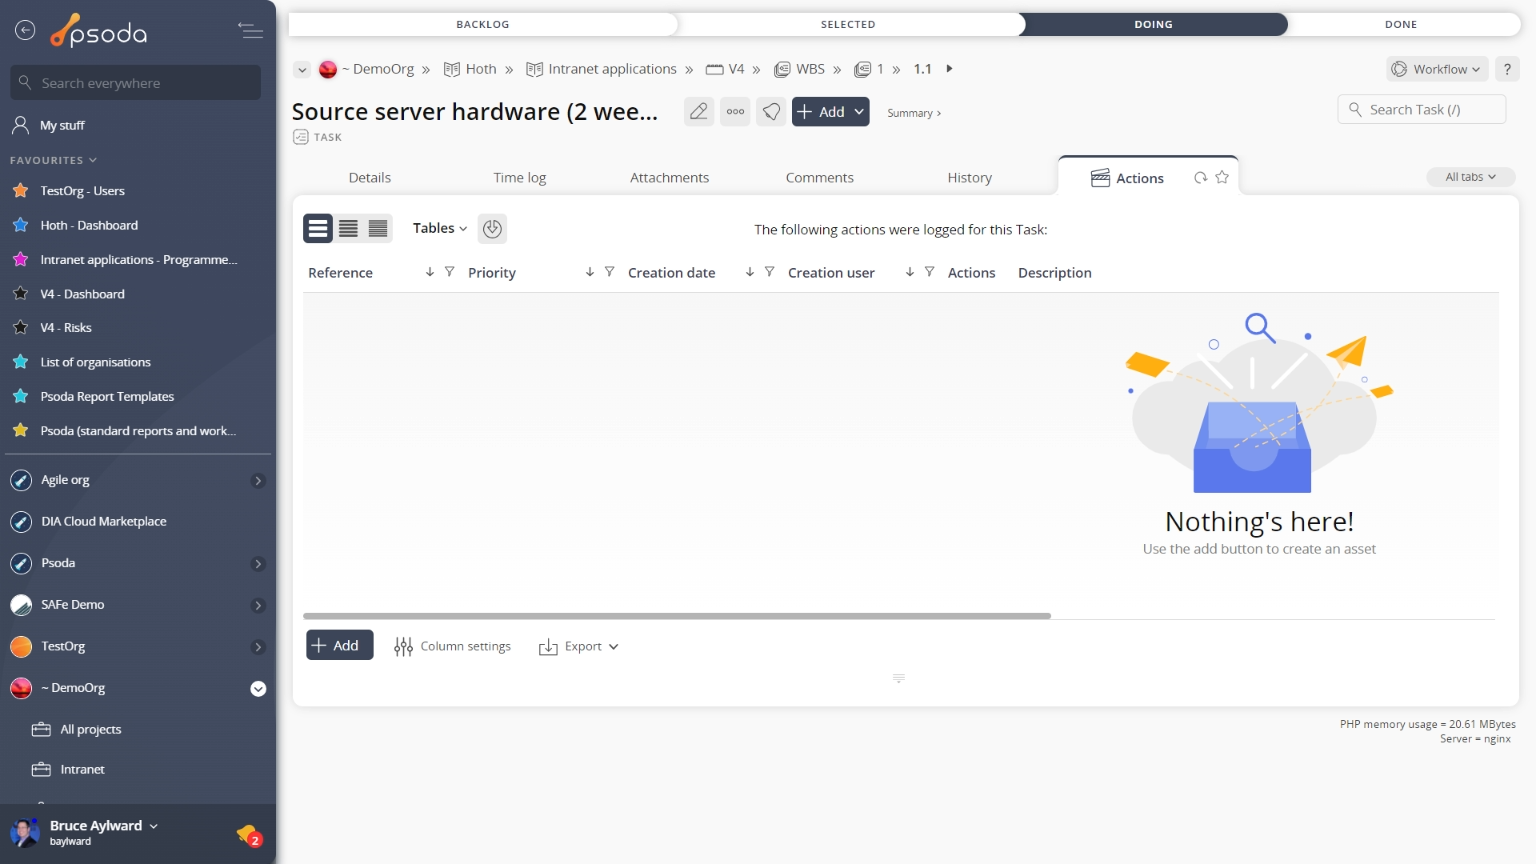
Figure 2 – Task actions tab
Note that you can customise your table view by clicking the Advanced estimates
This tab shows an asset listing of all of the scheduling information according to advanced estimates, as shown in Figure 3. By default, this table will present you with a number of details about the advanced estimates such as it’s context, reference, start and end dates, the users listed as resources for that estimate, resource total and a breakdown of actual and variance comparisons for time breakdowns.
From the Actions column of this advanced estimates table, you can act on individual estimate by 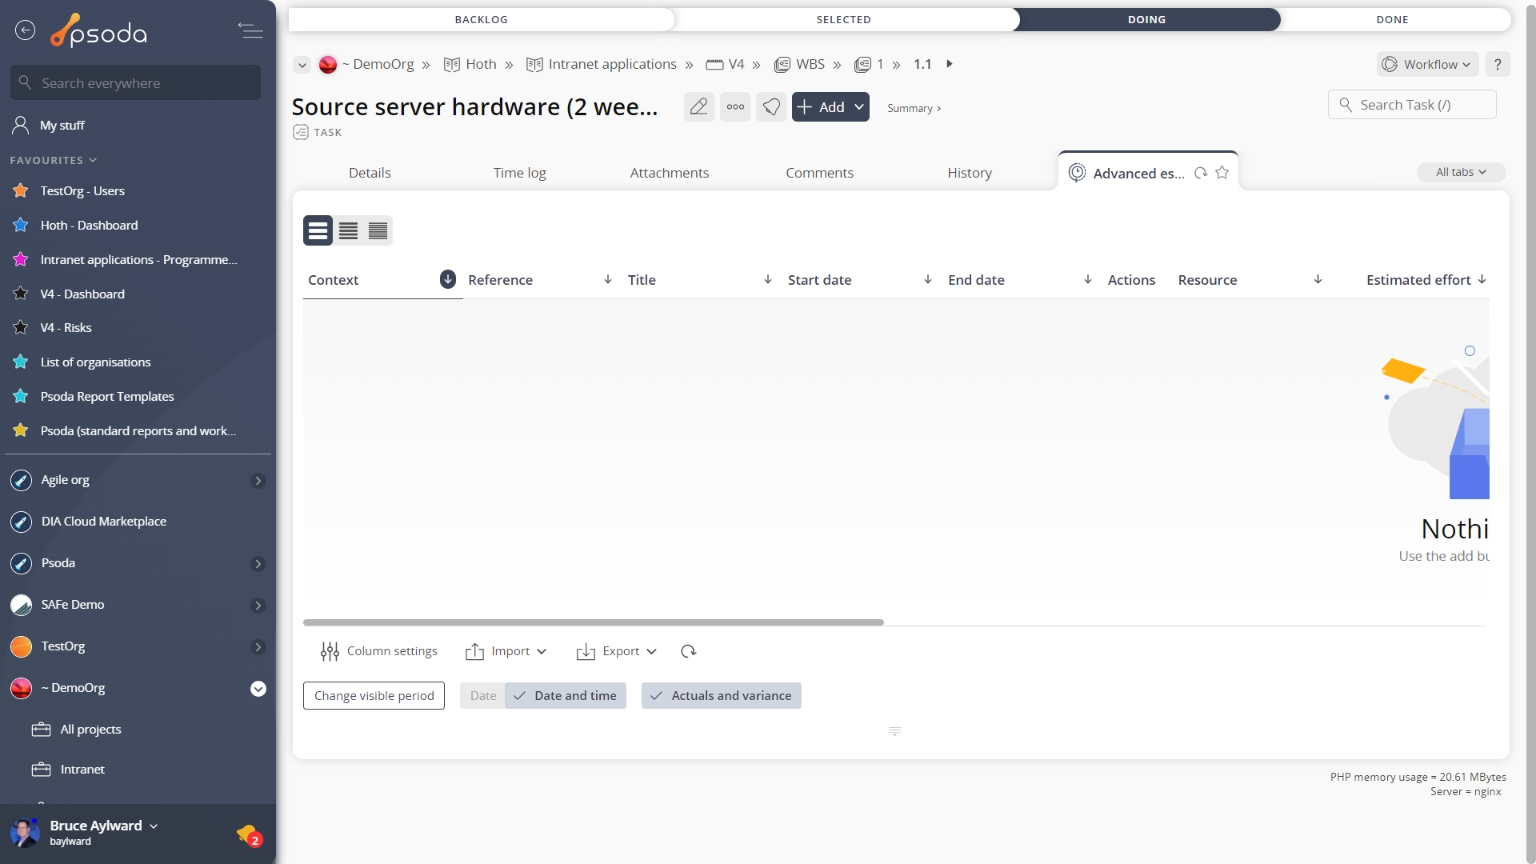
Figure 3 – Task group advanced estimates tab
Note that you can customise your table view by clicking the ![]() edit button at the bottom of the advanced estimates table. Here, you can also export this list to
edit button at the bottom of the advanced estimates table. Here, you can also export this list to ![]() Excel or
Excel or ![]() CSV files.
CSV files.
 Assumptions
This tab shows an asset listing of all of the assumptions that have been added to this task, as shown in Figure 4. By default, this table will present you with a number of details about the assumptions such as it’s reference, title, description, the user who created this assumption and it’s current state. If you click on the reference link of the listed assumption, you will navigate to that assumption’s view page.
From the Actions column of this assumptions table, you can act on individual assumption by 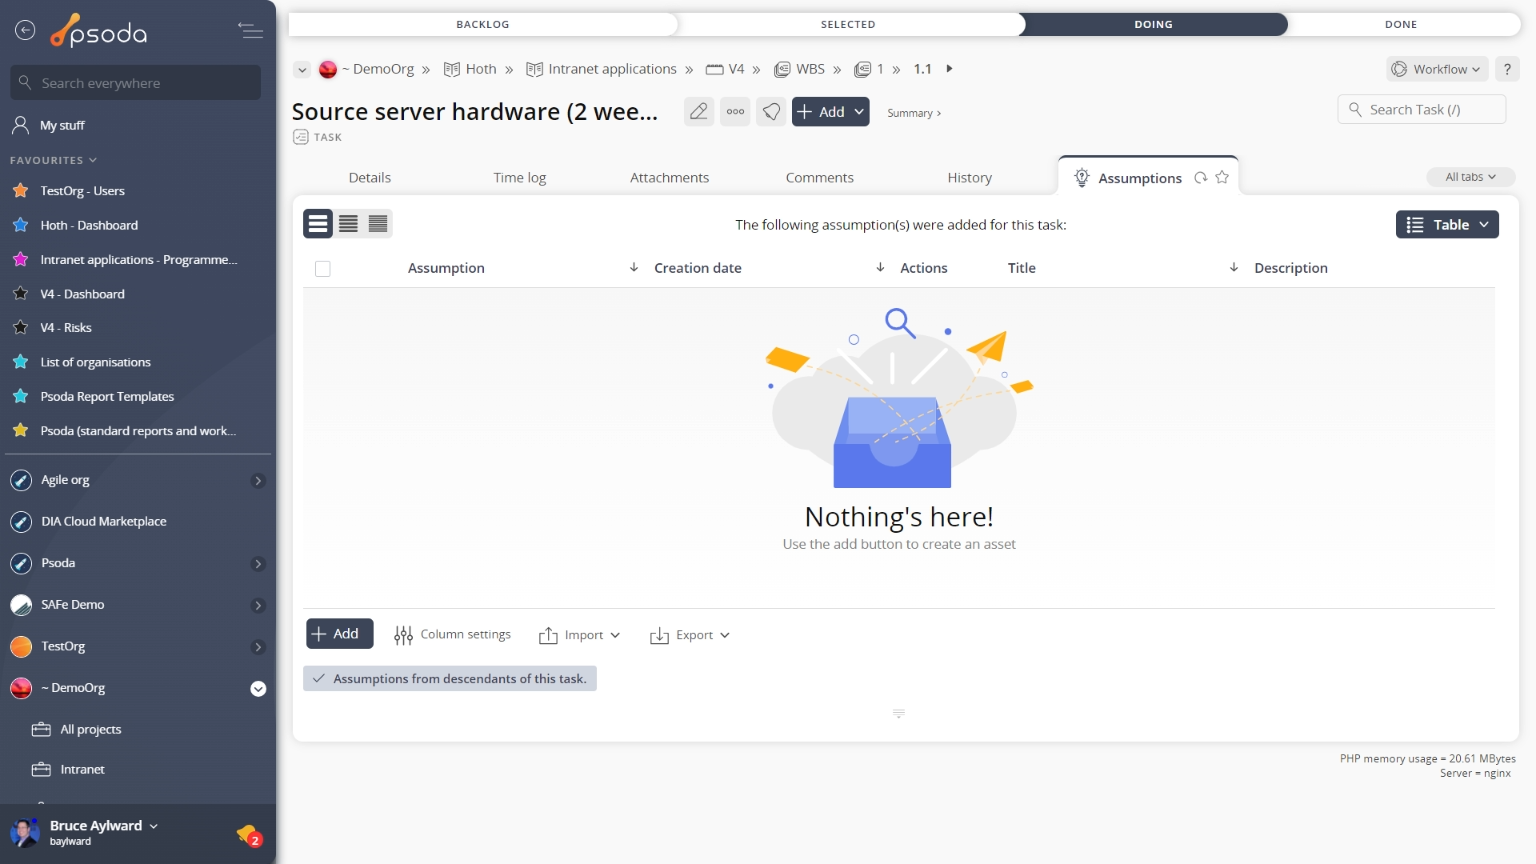
Figure 4 – Task assumptions tab
Note that you can customise your table view by clicking the Attachments
This tab shows an asset listing of all of the attachments that have been added to this task, as shown in Figure 5. By default, this table will present you with a number of details about the attachments such as the file’s name, attachment type, view the version and access a download link.
From the Actions column of this attachments table, you can act on individual attachments by 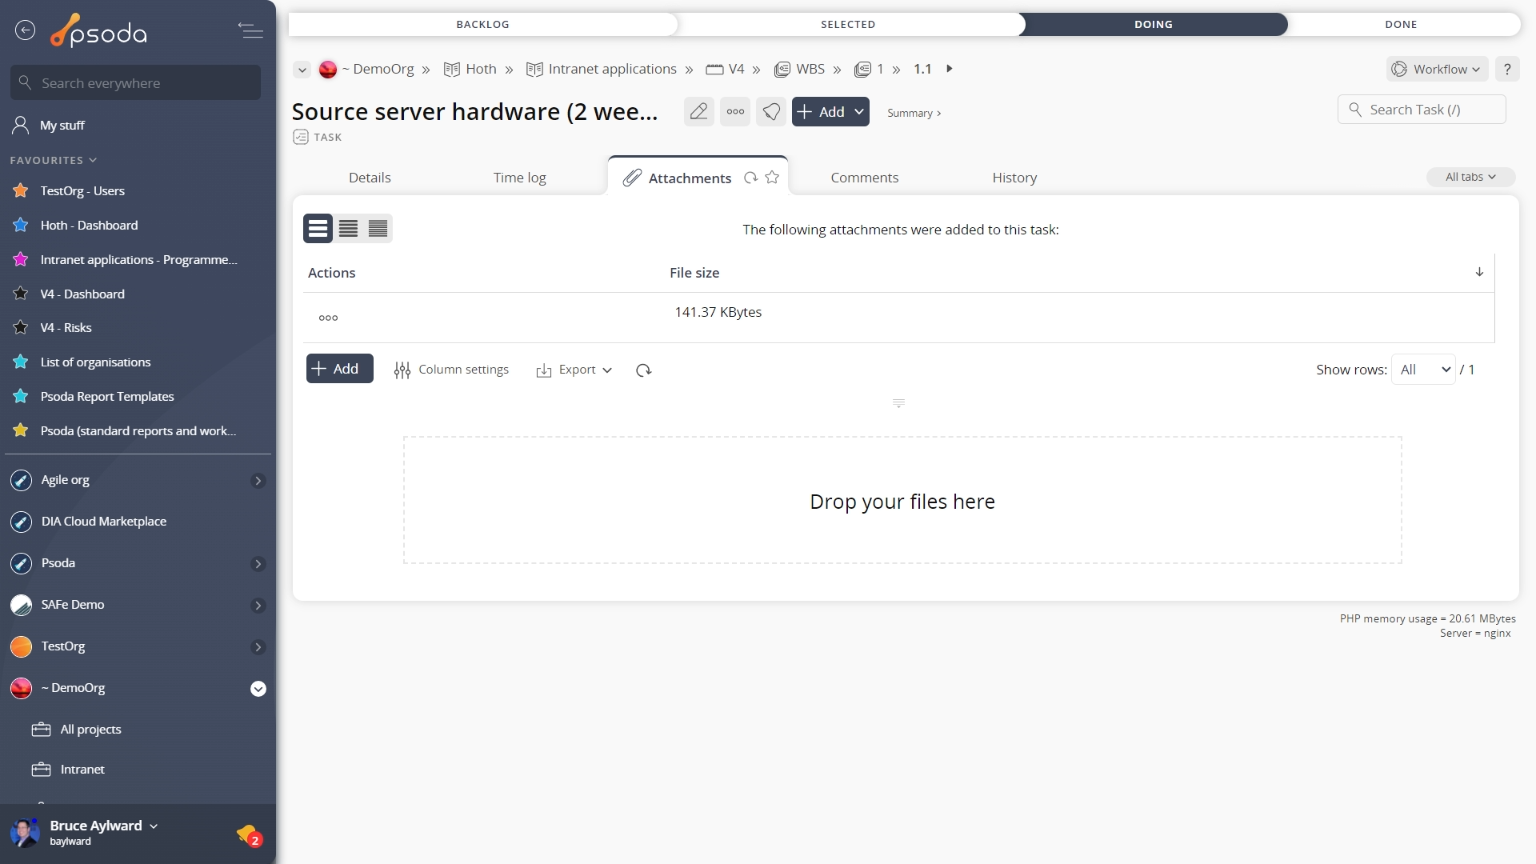
Figure 5 – Task attachments tab
Note that you can customise your table view by clicking the Comments
This tab shows an asset listing of all of the comments that 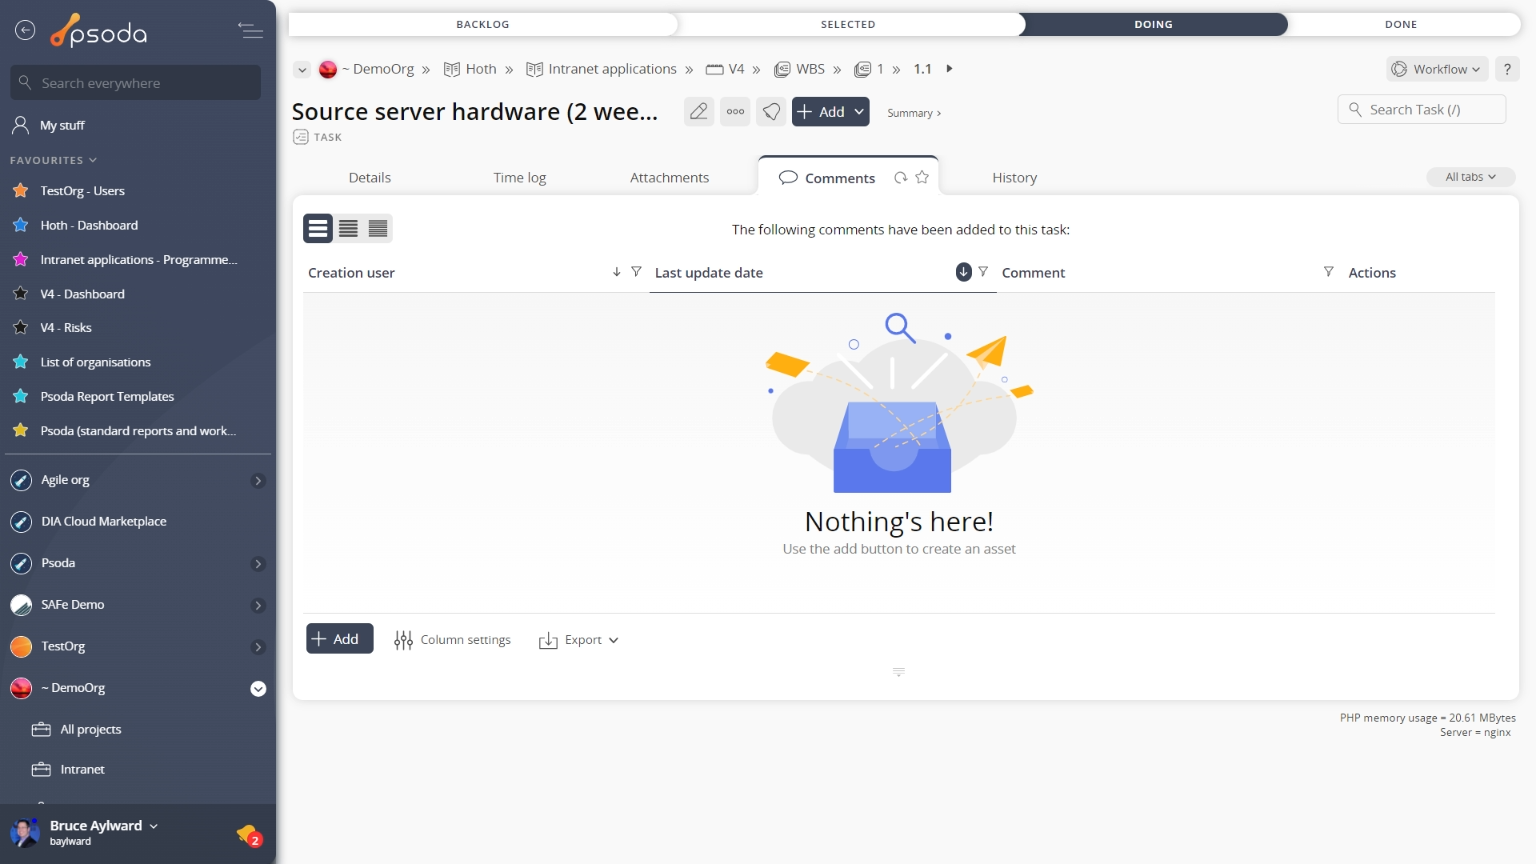
Figure 6 – Task comments tab
Note that you can customise your table view by clicking the Conflicts
This tab an asset listing that shows any conflicts between this task and other tasks allocated to the same resources, as shown in Figure 7. By default, this table includes a row for each user that the task is allocated to as well as all members of any roles that the task is allocated to, as well as scheduling and allocation information about the conflicted task.
For each user the table lists the tasks that potentially conflicts with this task as well as a workload chart for each user.
The workload charts shows a stacked bar-graph of the workload for each user. The task that you are viewing is highlighted in red. The chart shows both the approved and planned activity for the user, split into tasks allocated directly to that user and tasks allocated to roles that the user is a member of.
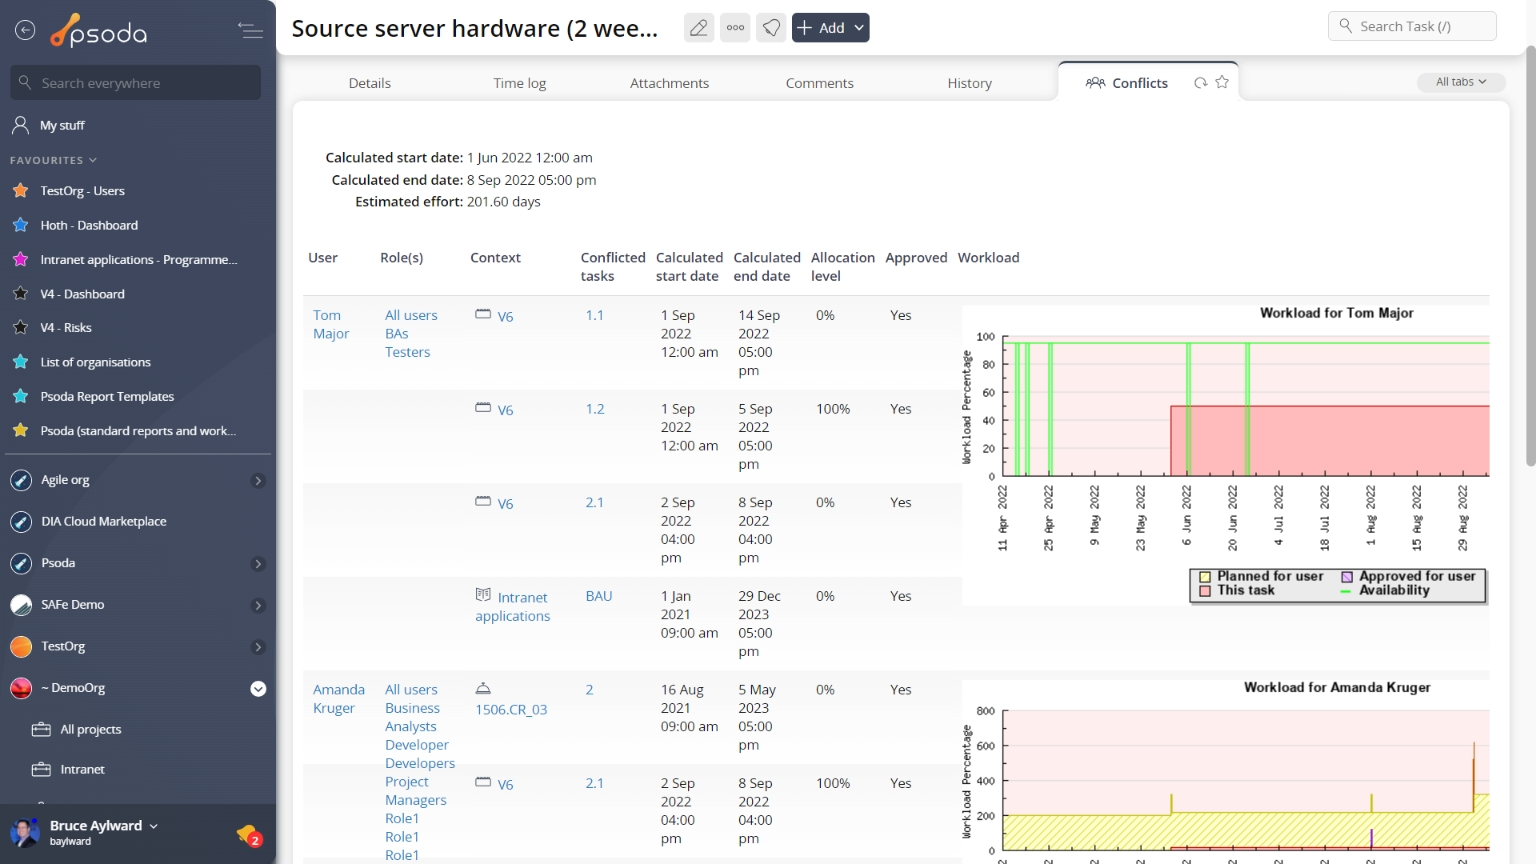
Figure 7 – Task conflicts tab
The period included in the workflow charts is 2 times the duration of the task, centered on the task period. Cost allocation
Taking information from business units – if there are business units to list.
Details
Figure 9 – Task details tab
This tab shows some additional details on the task, for example the description, job code, whether it is deliverable or critical, any predecessors or successors, estimate type and the assigned workflow information, as shown in Figure 8. If you have sufficient permissions you will also see the charge model and rate override. History
This tab shows shows some basic history of the task, as shown in Figure 10. By default, this tab will present you with a number of details about the task’s history such as the creation date, creation user, last update date and last update user. If the task has been changed then this section will also show a table of all the changes that has been made, including the date of each change, the field changed, the value before the change and the user who made the change.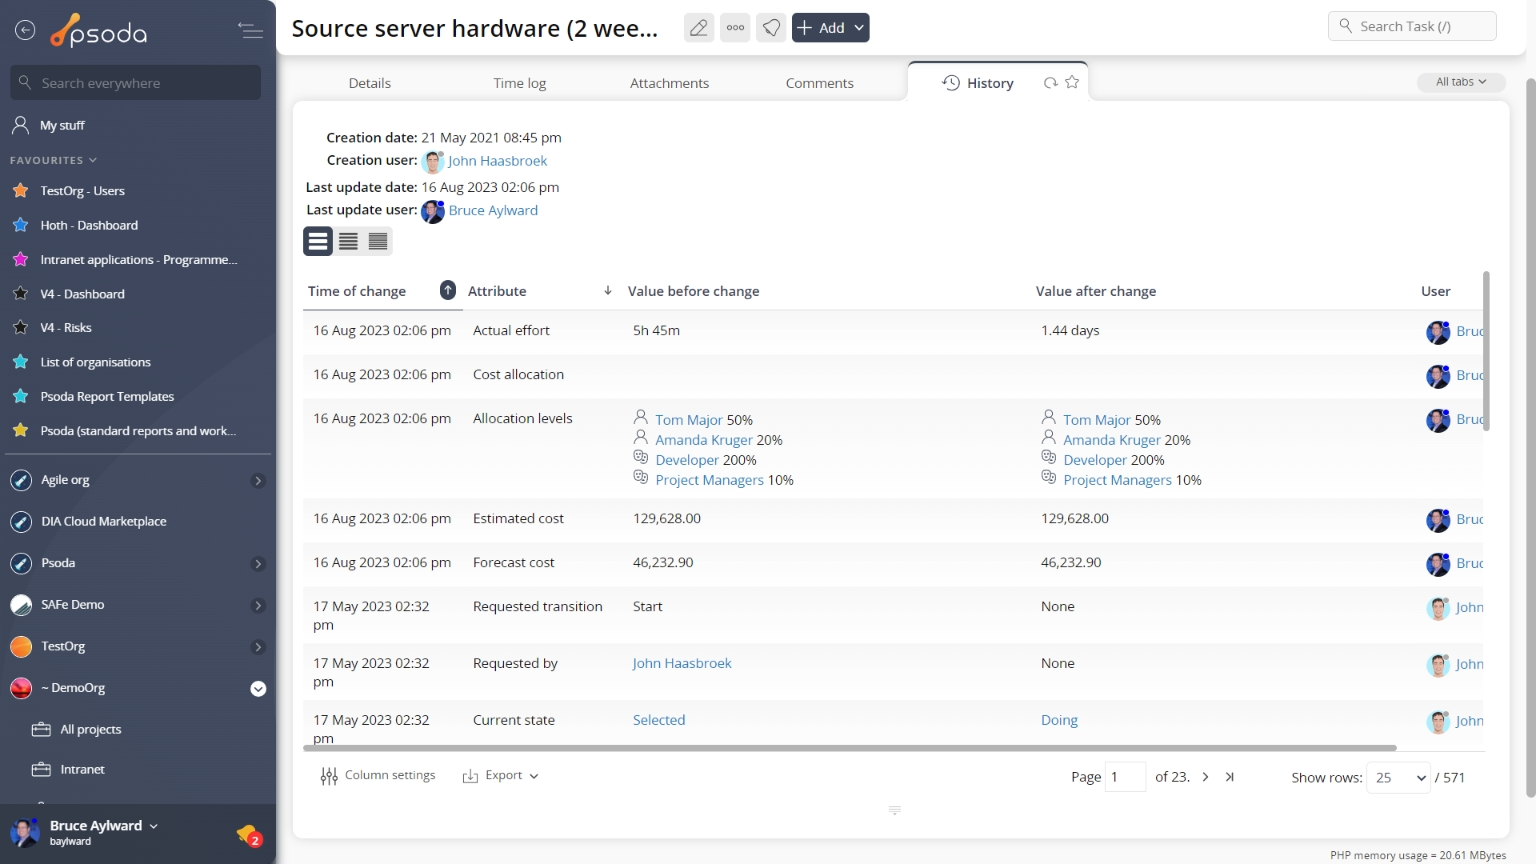
Figure 10 – Task history tab
Note that you can customise your change table view by clicking the ![]() edit button at the bottom of the change table. Here, you can also export this list of changes to
edit button at the bottom of the change table. Here, you can also export this list of changes to ![]() Excel or
Excel or ![]() CSV files.
CSV files.
 Issues
This tabbed view shows the issues table as seen in Figure 11, listing any issues that have been logged for this task. By default, this table provides impact and priority information, plan progress and resolution dates for the issues listed, as well as any actions that can be taken. The workflow column also provides information as to the next workflow transitions available.
The Actions column of the issues table provides accessible functions to act on a chosen issue. These functions include 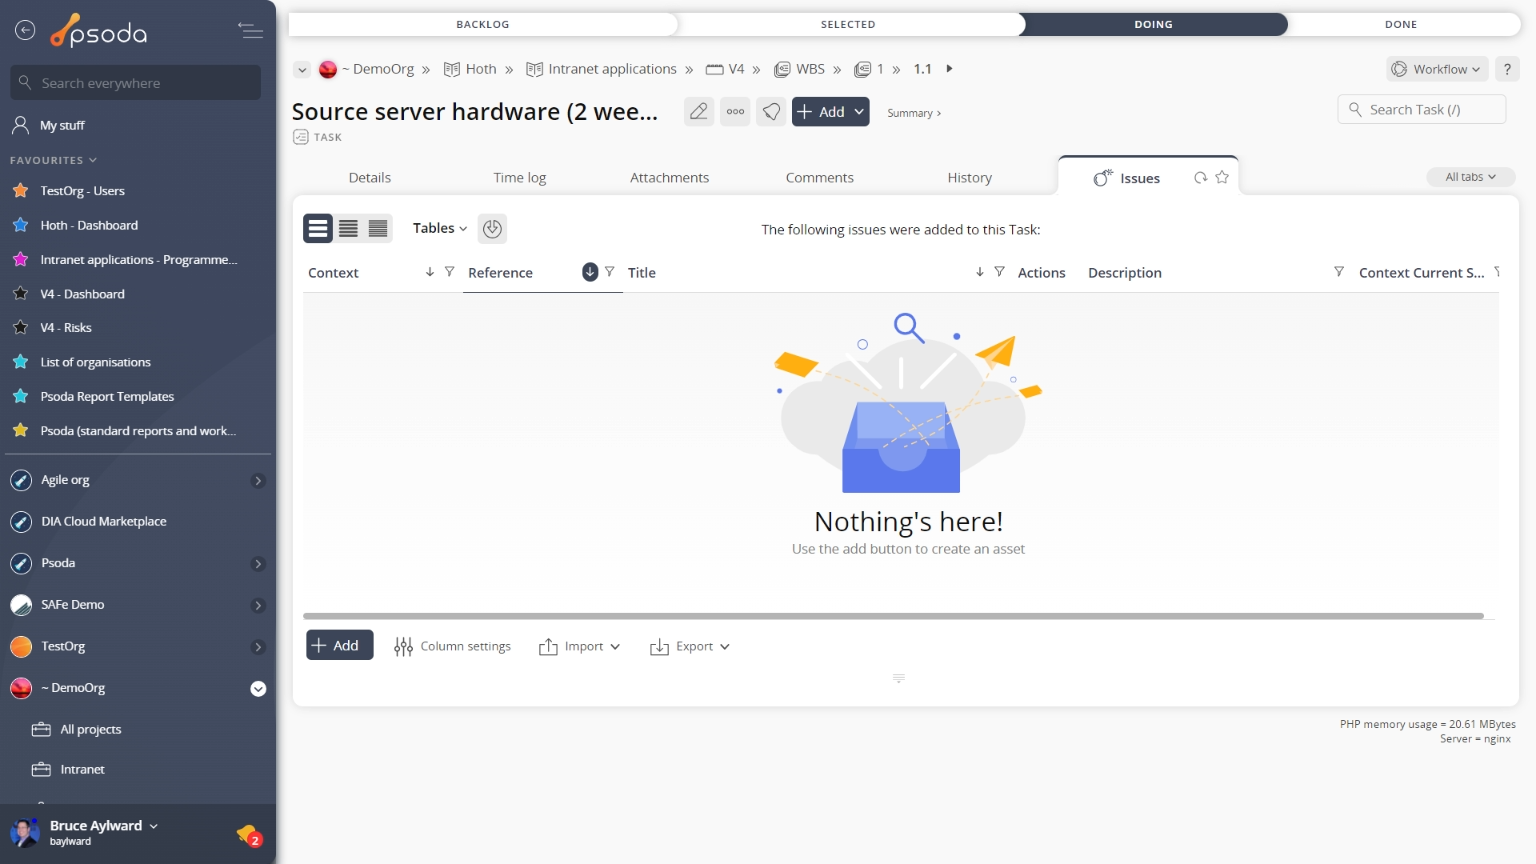
Figure 11 – Task issues tab
Note that at the bottom of the table you can Materials
This tab shows an asset listing of all of the materials needed for this task, as shown in Figure 12. By default, this table will present you with a number of details about the materials such as, the description, quantity needed, unit price, total price, the vendor as well as if the material has been ordered or delivered. Materials that are due to be ordered or delivered are flagged in red under the order by and needed by columns. You can sort the table by clicking on the column headings and if you click on the link below the material column you will navigate into the selected material’s view page.
From the Actions column of this materials table, you can act on individual materials by 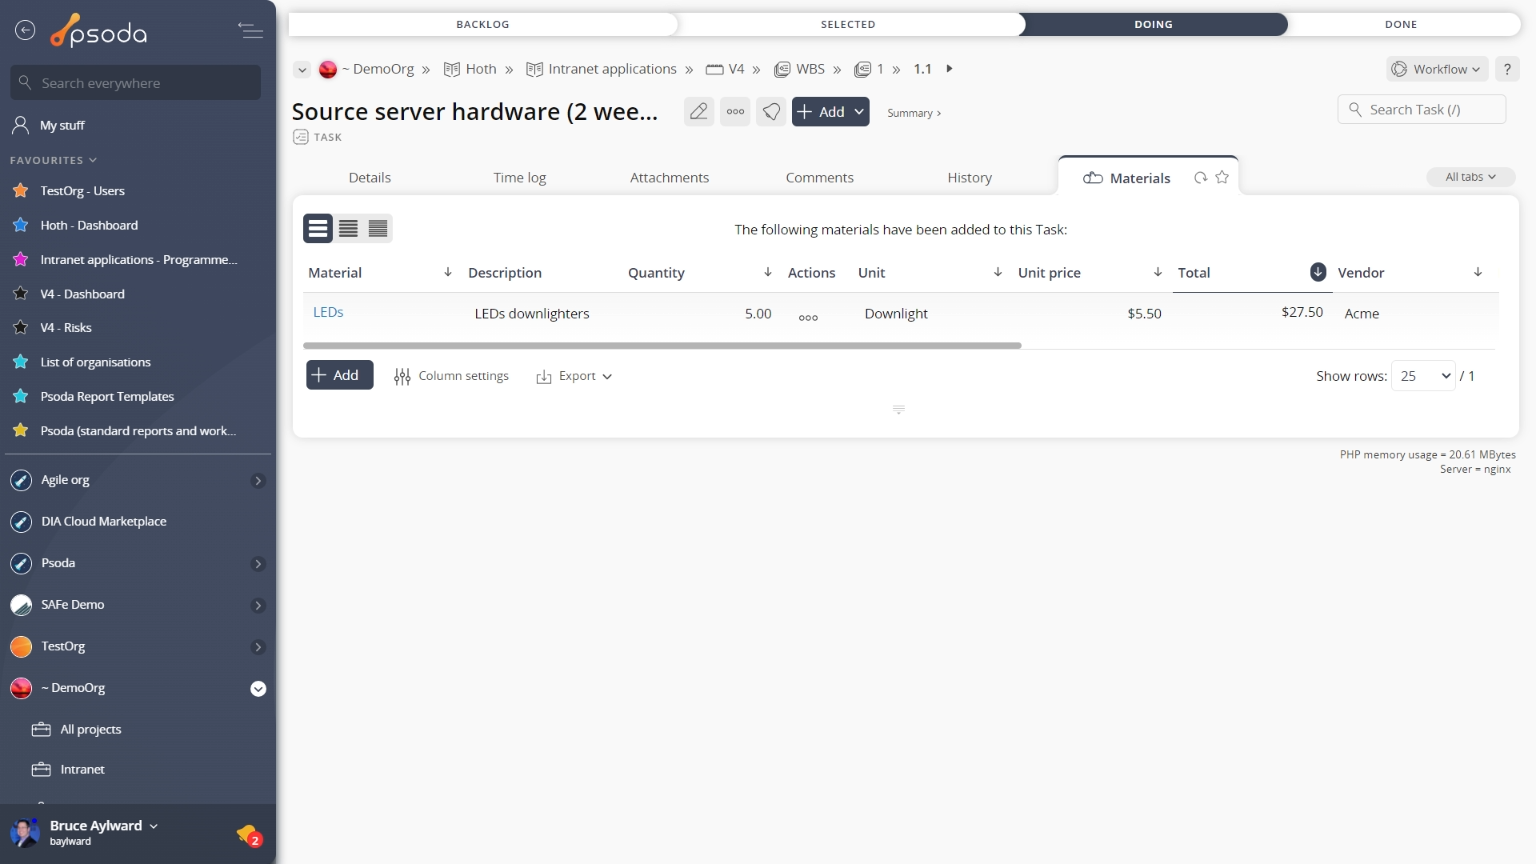
Figure 12 – Task materials tab
Note that you can customise your table view by clicking the Time log
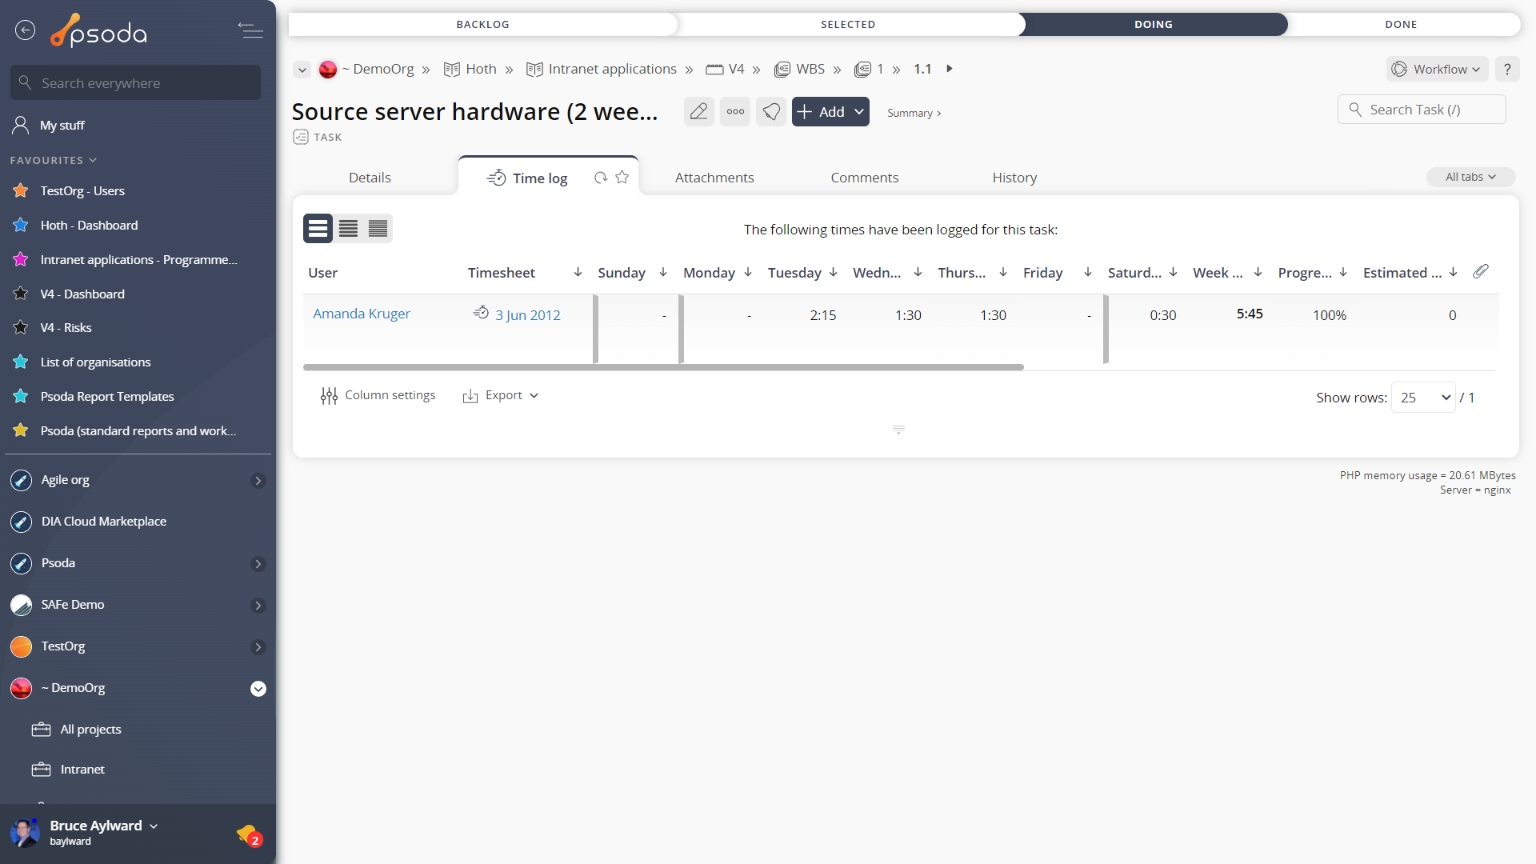 Figure 13 – Time log tab
Workflow timeline
This tab shows you a table containing each of the state transitions that have been applied to this project on the associated workflow. Note that you can customise your table view by clicking the 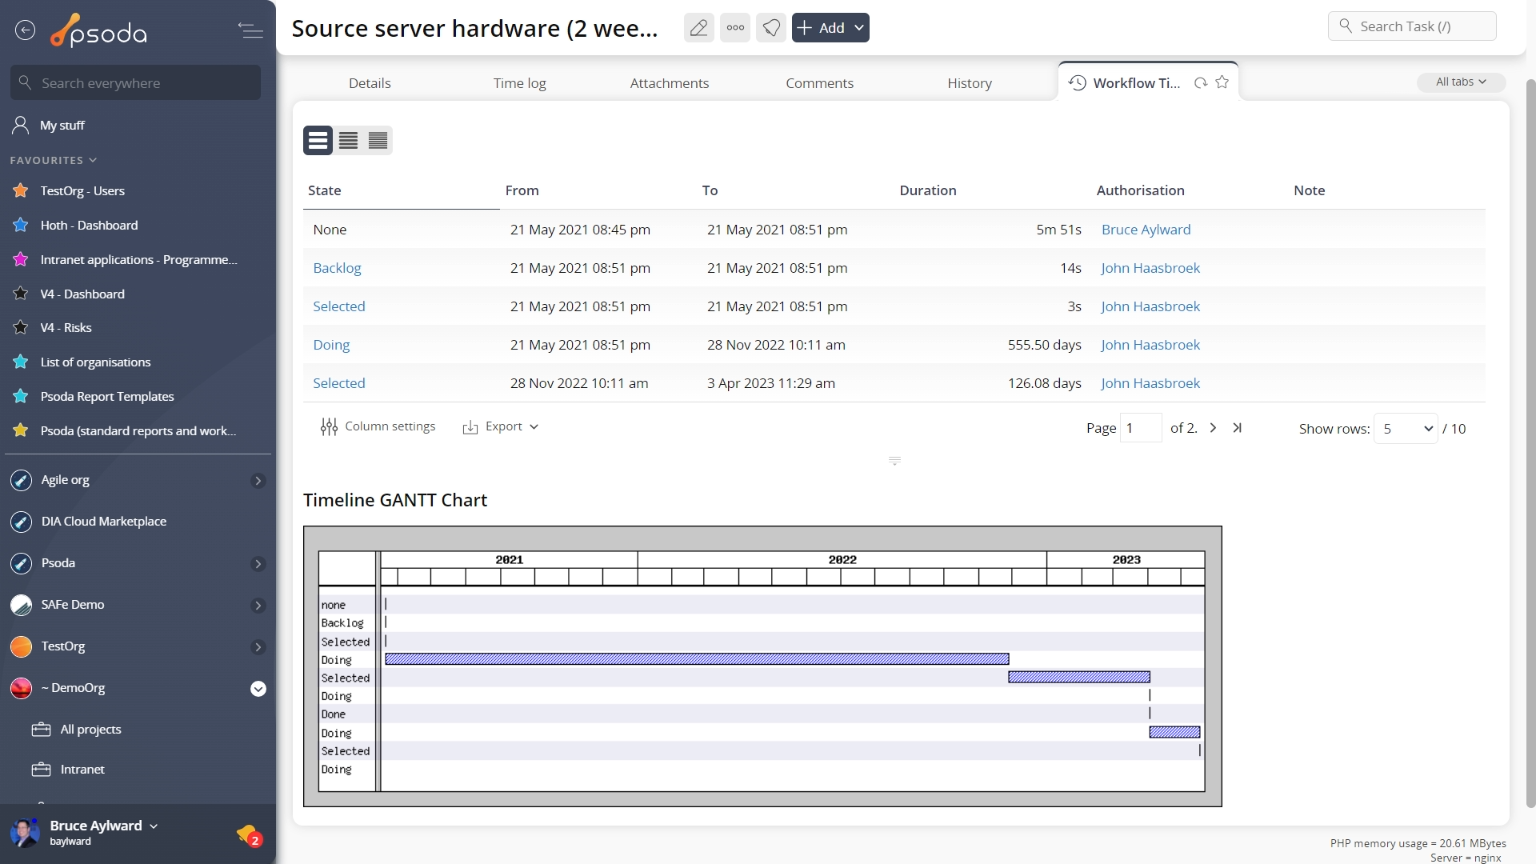 Figure 14 – Task workflow timeline tab
Below the state transition timeline table, you will be presented with a visual breakdown of the timeline in a GANTT chart, as shown in Figure 14.