Figure 1 – Test step view page
The top header area allows you to Attachments
This tab shows an asset listing of all of the attachments that have been added to this test step, as shown in Figure 2. By default, this table will present you with a number of details about the attachments such as the file’s name, attachment type, view the version and access a download link.
From the Actions column of this attachments table, you can act on individual attachments by 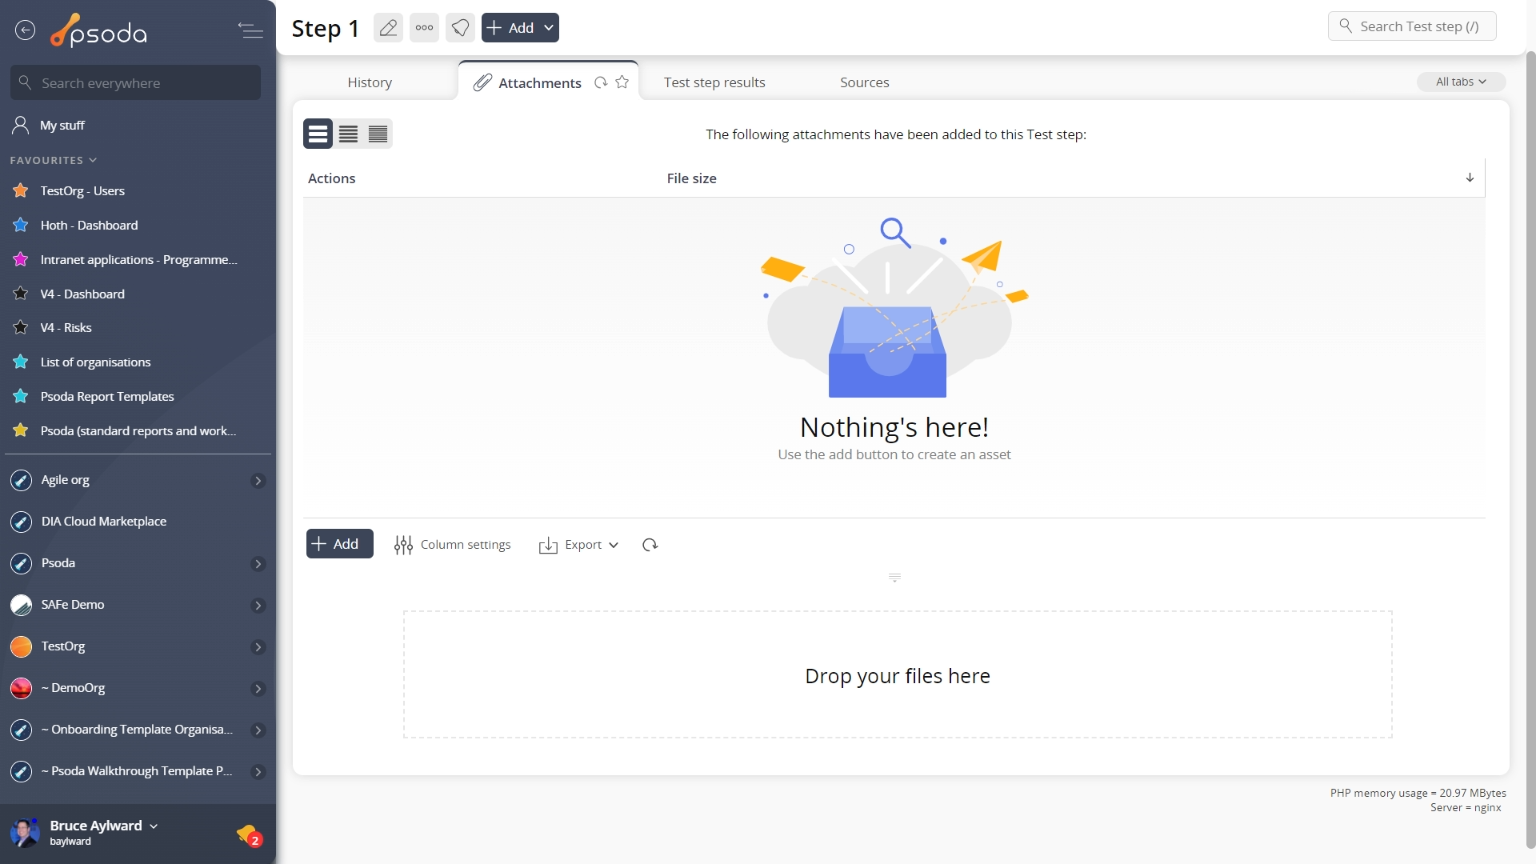
Figure 2 – Test step attachments tab
Note that you can customise your table view by clicking the Comments
This tab shows an asset listing of all of the comments that 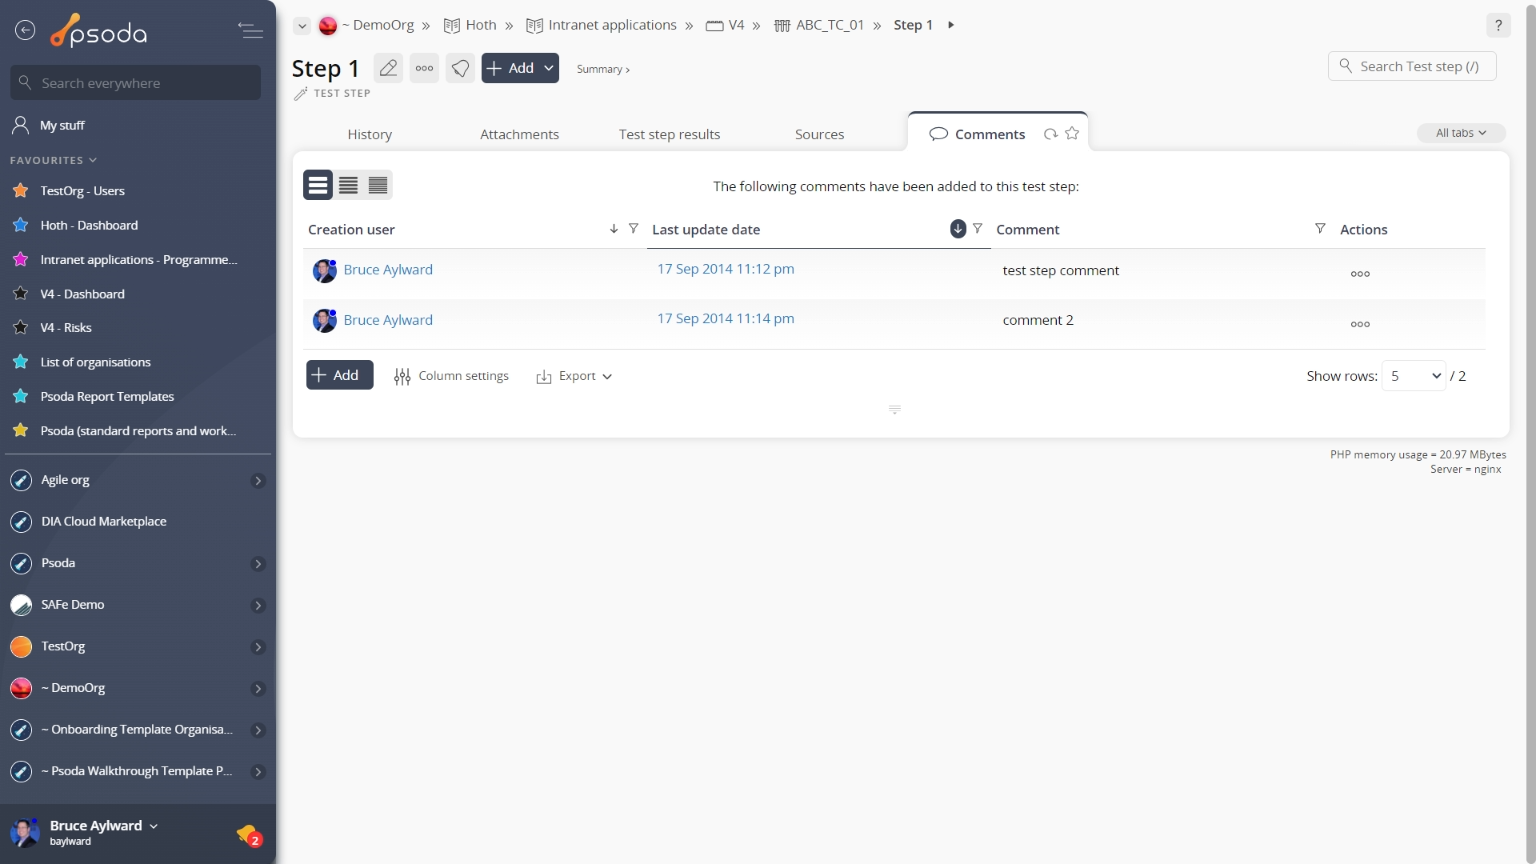
Figure 3 – Test step comments tab
Note that you can customise your table view by clicking the History
This tab shows shows some basic history of the test step, as shown in Figure 4. By default, this tab will present you with a number of details about the test step’s history such as the creation date, creation user, last update date and last update user. If the test step has been changed then this section will also show a table of all the changes that has been made, including the date of each change, the field changed, the value before the change and the user who made the change.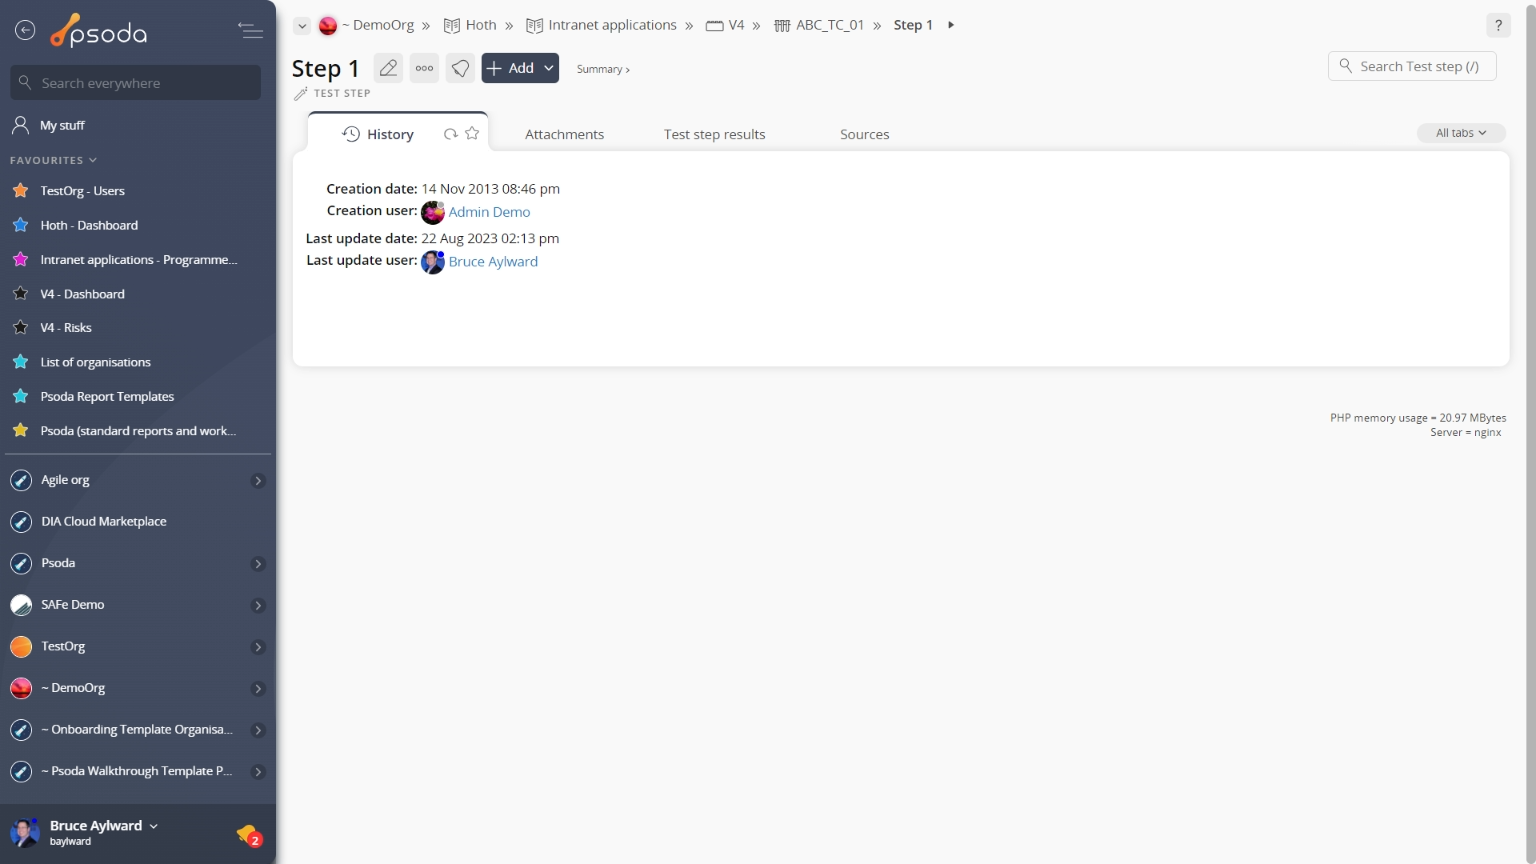
Figure 4 – Test step history tab
Note that you can customise your change table view by clicking the ![]() edit button at the bottom of the change table. Here, you can also export this list of changes to
edit button at the bottom of the change table. Here, you can also export this list of changes to ![]() Excel or
Excel or ![]() CSV files.
CSV files.
Sources
Sources are other assets that this test step is derived from, i.e. this test step can be affected if any of its sources are changed.
This tab shows an asset listing of all of the sources that have been added to this test step, as shown in Figure 5. By default, this table will present you with the source’s parent asset, the source asset, it’s description and status.
From the Actions column of this sources table, you can act on individual sources by 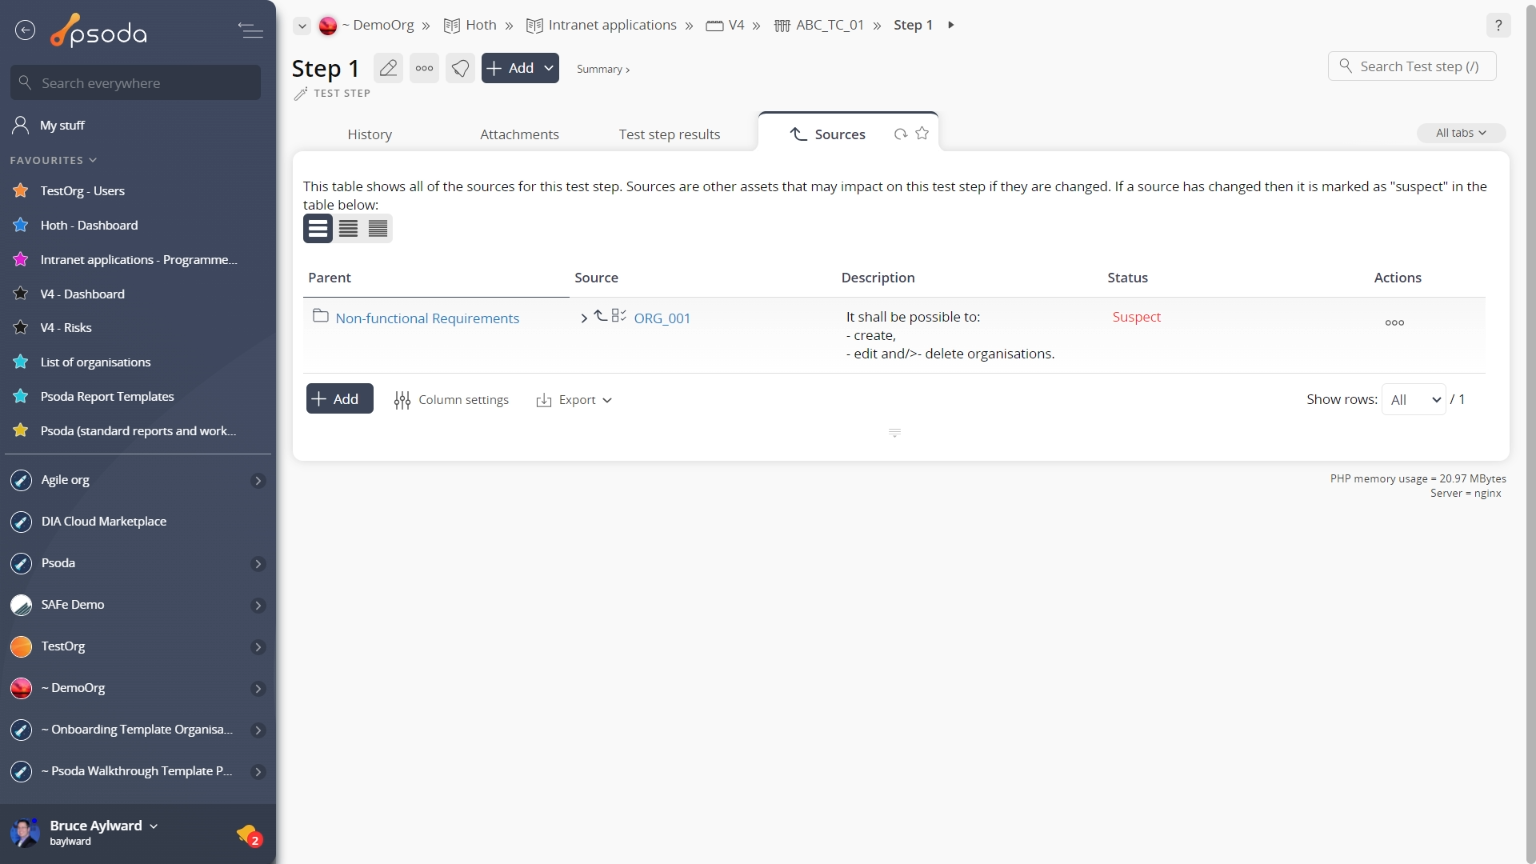
Figure 5 – Test step sources tab
Note that you can customise your table view by clicking the ![]() edit button at the bottom of the sources table or navigate to this same spot to
edit button at the bottom of the sources table or navigate to this same spot to ![]() add more sources to this test step. Here, you can also export this list to
add more sources to this test step. Here, you can also export this list to ![]() Excel or
Excel or ![]() CSV files.
CSV files.
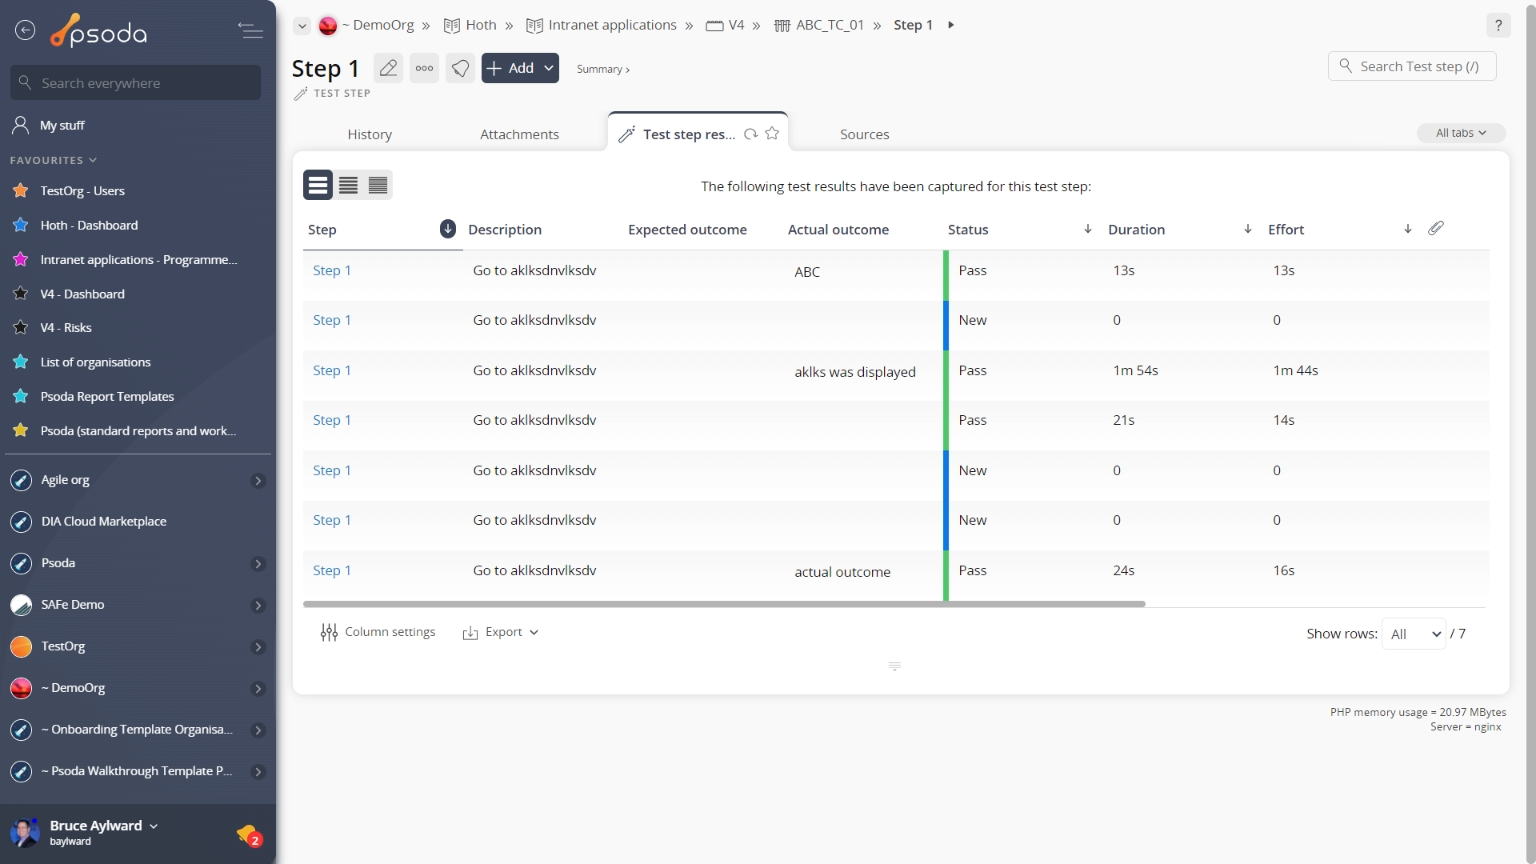
 Test step results
This tab shows an asset listing of all of the test step results that have been captured for this test step, as shown in Figure 6. By default, this table will present you with the test step result’s last update date, actual outcome, status, duration, effort and which test case result is associated. If you click on the link under the step column, you will navigate into the selected test step result’s view page.
From the Actions column of this test step results table, you can act on individual results by
Figure 6 – Test step test step results tab
Note that you can customise your table view by clicking the ![]() edit button at the bottom of the test step results table. Here, you can also export this list to
edit button at the bottom of the test step results table. Here, you can also export this list to ![]() Excel or
Excel or ![]() CSV files.
CSV files.