
Power your PMO with Psoda
The ultimate all-in-one solution for project, programme and portfolio success.
Join the professionals who trust Psoda


From capturing ideas to benefits realisation, Psoda has you covered
Capture ideas
Discover your organisation's next big thing by inviting your team, customers and suppliers to submit their ideas into Psoda.
Score
Our intelligent tool evaluates ideas against your predefined criteria. Watch as Psoda's bubble chart showcases how each idea ranks.
Prioritise
Quickly identify and prioritise the ideas with the highest potential, making decision-making a breeze. Psoda helps you transform selected ideas into robust business cases, ensuring your resources are invested wisely.
Planning
Carry out deep planning on your ideas in Psoda by effortlessly building schedules, registers, checklists, budgets and so much more.
Execution
Turn your plans into action! Execute tasks, track progress and collaborate smoothly. Psoda ensures your projects stays on the path to success.
Benefits realisation
It's not just about finishing; it's about winning. Psoda helps you measure and achieve the results you set out to accomplish.
Portfolio management
Programme management
Project management
Work the way you want to, not the way your software does
Customisable set up
Configure Psoda to seamlessly align with your processes and frameworks.
Use any framework
Whether you are using Agile, Waterfall, Hybrid or something else, you can do it all with Psoda.
Revolutionise reporting
Craft custom reports that capture attention and drive business success.
Key features
Maximise productivity
Unlock the power of aggregation
Seamlessly consolidate projects into comprehensive programmes and portfolios. Get insights and drive strategic decision-making for maximum business impact.
Drive efficiency
Streamline your project management processes with our automated workflows. From governance gateways to status updates, our automations let you focus on the work that matters.
Insightful, tailored reports at your fingertips
Discover the perfect blend of pre-built and customised reports to promote data-driven decisions.
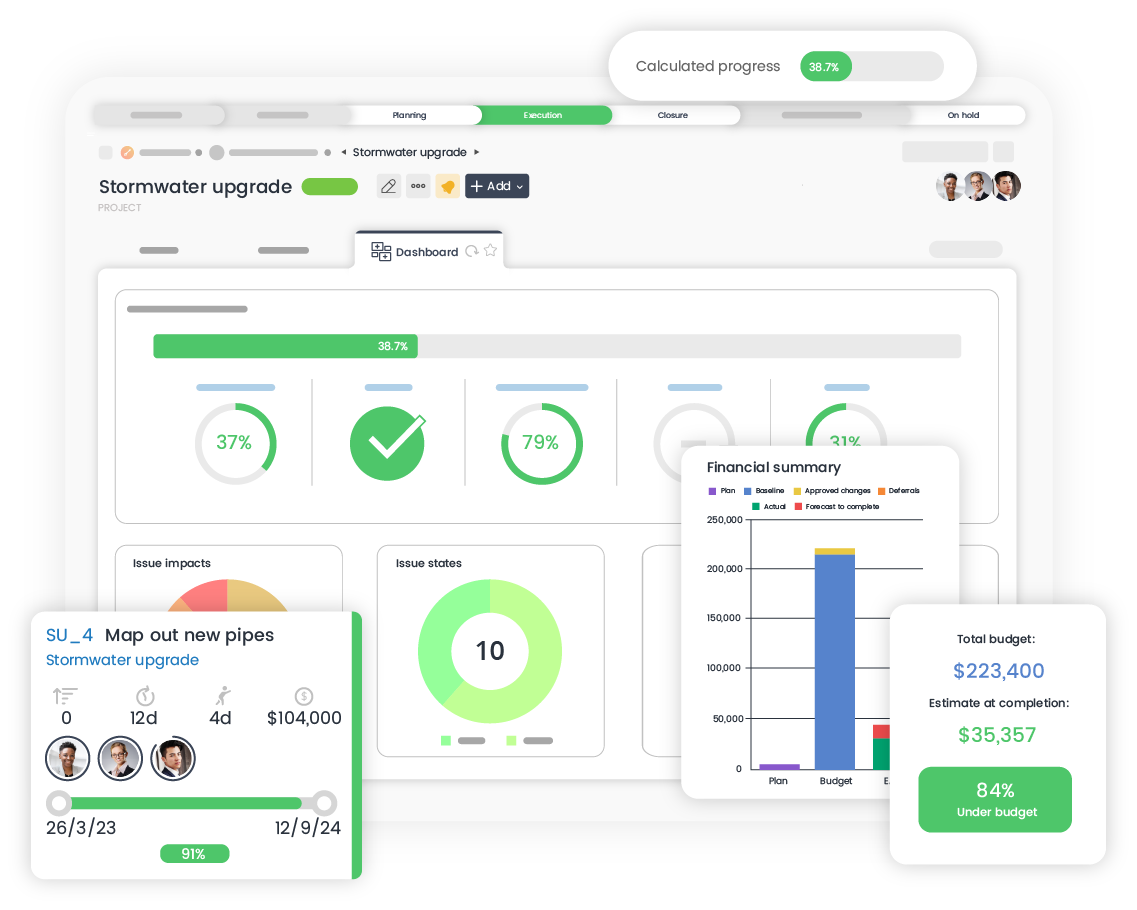
Data made beautiful
Get real-time visibility and actionable insights with our dynamic, customisable dashboards. Effortlessly track project progress, monitor key metrics and make informed decisions.
Secure collaboration
Safeguard sensitive information, assign role-based permissions and ensure data integrity while empowering your teams to collaborate effectively.
Plan, anticipate, excel
Navigate uncertainties and proactively plan for the future. Our scenario planner lets you anticipate potential outcomes, assess risks, and optimise strategies before committing to them.
Psoda has the solution for you

Why choose Psoda?
Setting you up for success from day one. Our meticulously crafted implementation process is intuitive, efficient and tailored to your needs. Our expert team will guide you every step of the way, providing personalised support and training to ensure a seamless transition.
Explore agile implementationSimplify your work life with our powerful automations. Whether it’s streamlining workflows, automating report running or emailing reminders at a specific time, you can do it all and much more with Psoda.
Explore automationUnlock a world of possibilities by integrating Psoda with leading tools and financial management systems. Our API can be used with your other business solutions to create a seamless hub of up-to-date information.
Explore integrationsOur exceptional support team is just a call or email away. Whether you need help or custom work we’re always happy to help. We offer cost effective implementation, training and professional services so you can get the most out of Psoda.
What our customers say
Psoda’s flexibility means that the tool is configured to meet our needs rather than us having to change to fit the tool
Our project and programme coordinators are saving upwards of 20 hours a week with Psoda, freeing them up to do more strategic work.
Being able to lock down user rights is invaluable.
In the first three months of Psoda being live we’ve already seen improvements in programme and project reporting as well as better resource utilisation.
Having greater transparency and visibility has been a great benefit. It has given us the ability to tell a cohesive story and to see where we’re going and what we need to do next. The ability to re-prioritise and understand the impact of any changes is really important.
Psoda is run live during project team meetings. This means teams have all the information they need right in front of them rather than having to go away and find answers to questions raised at the meeting.
Ready to try it out?
Let us show you what you want to see with a free, personalised demo.