The dependency map visually shows the dependencies between projects and programmes and allows for the positioning, linking, and editing of these programmes, projects and dependencies.
The dependency map is available on the  programme,
  portfolio,
  project and
  organisation view pages.
Figure 1 shows an example of a dependency map at the programme view page.
organisation view pages.
Figure 1 shows an example of a dependency map at the programme view page.
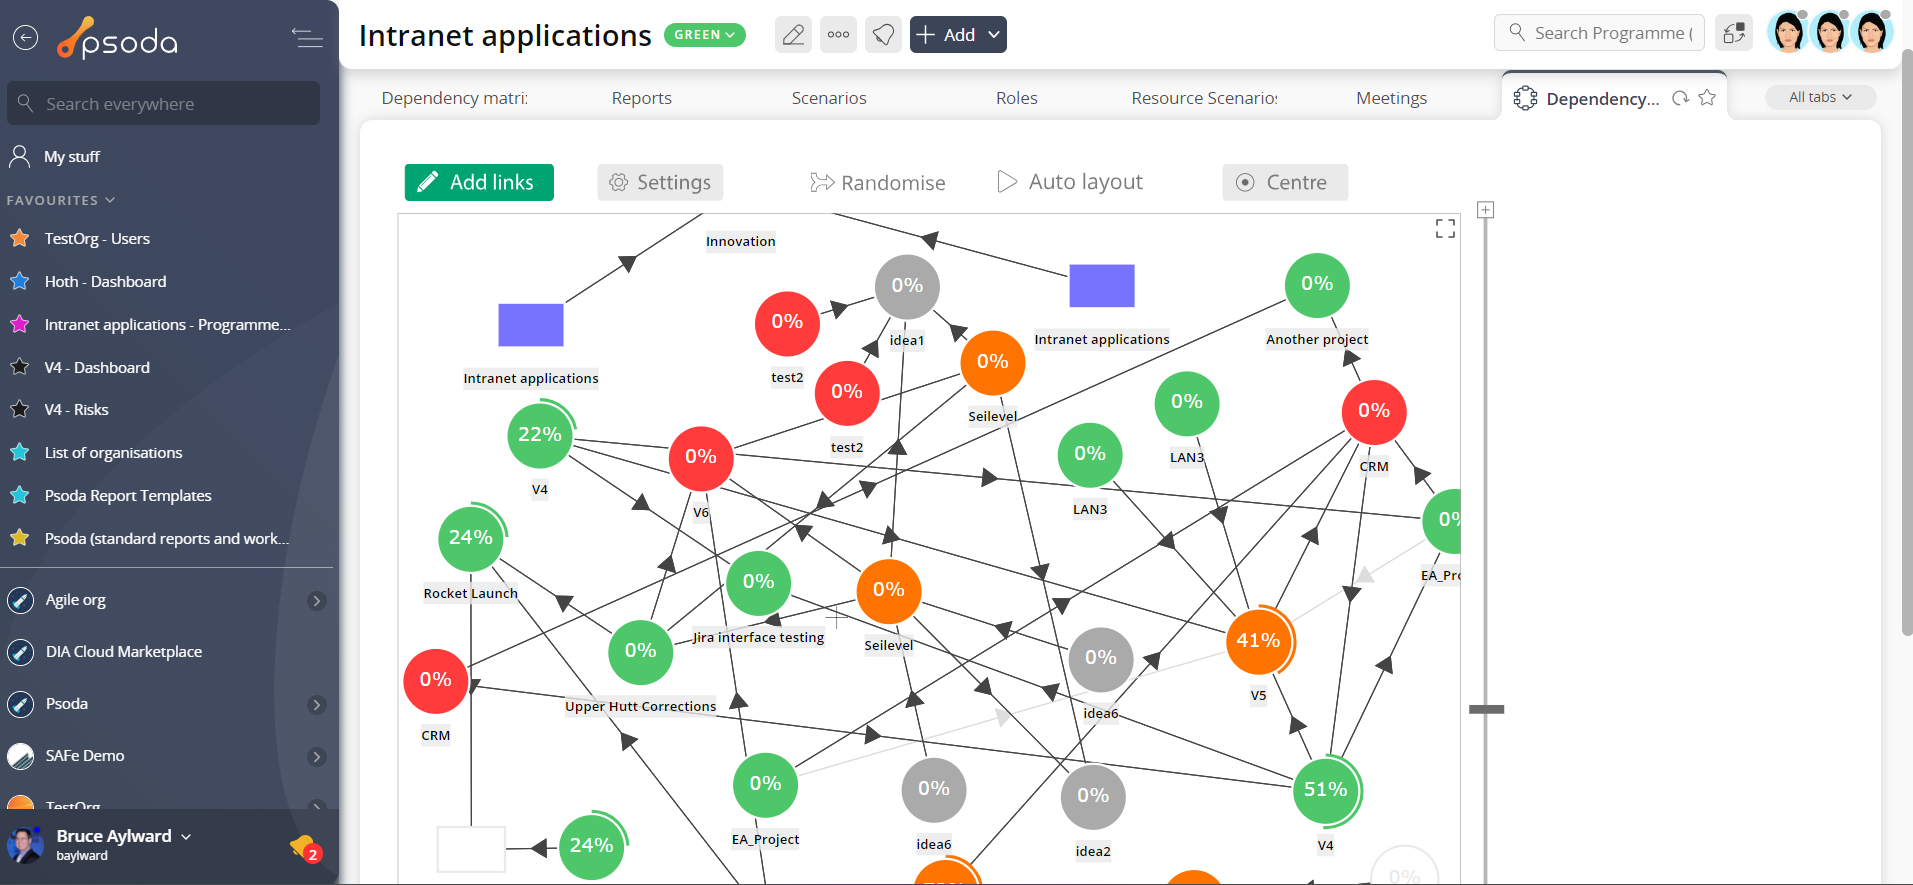
Figure 1 – Dependency map
Projects are represented by circles, programmes are represented by rectangles, and links are represented by lines between the projects and programmes. Greyed out objects are archived. Black lines represent dependencies, blue lines represent parent-child relationships, and grey lines represent archived dependencies. Objects on the map can be positioned by clicking and dragging them. Object details can be viewed by clicking the “?” icon in the top right of the objects. Dependencies can be edited and deleted by clicking the arrows on the lines. The project, programme, and link colours can all be changed in the dependency map settings along with various other settings. More details on the settings can be found here.Add Links
To add links on the dependency map click the add link button at the top left of the map: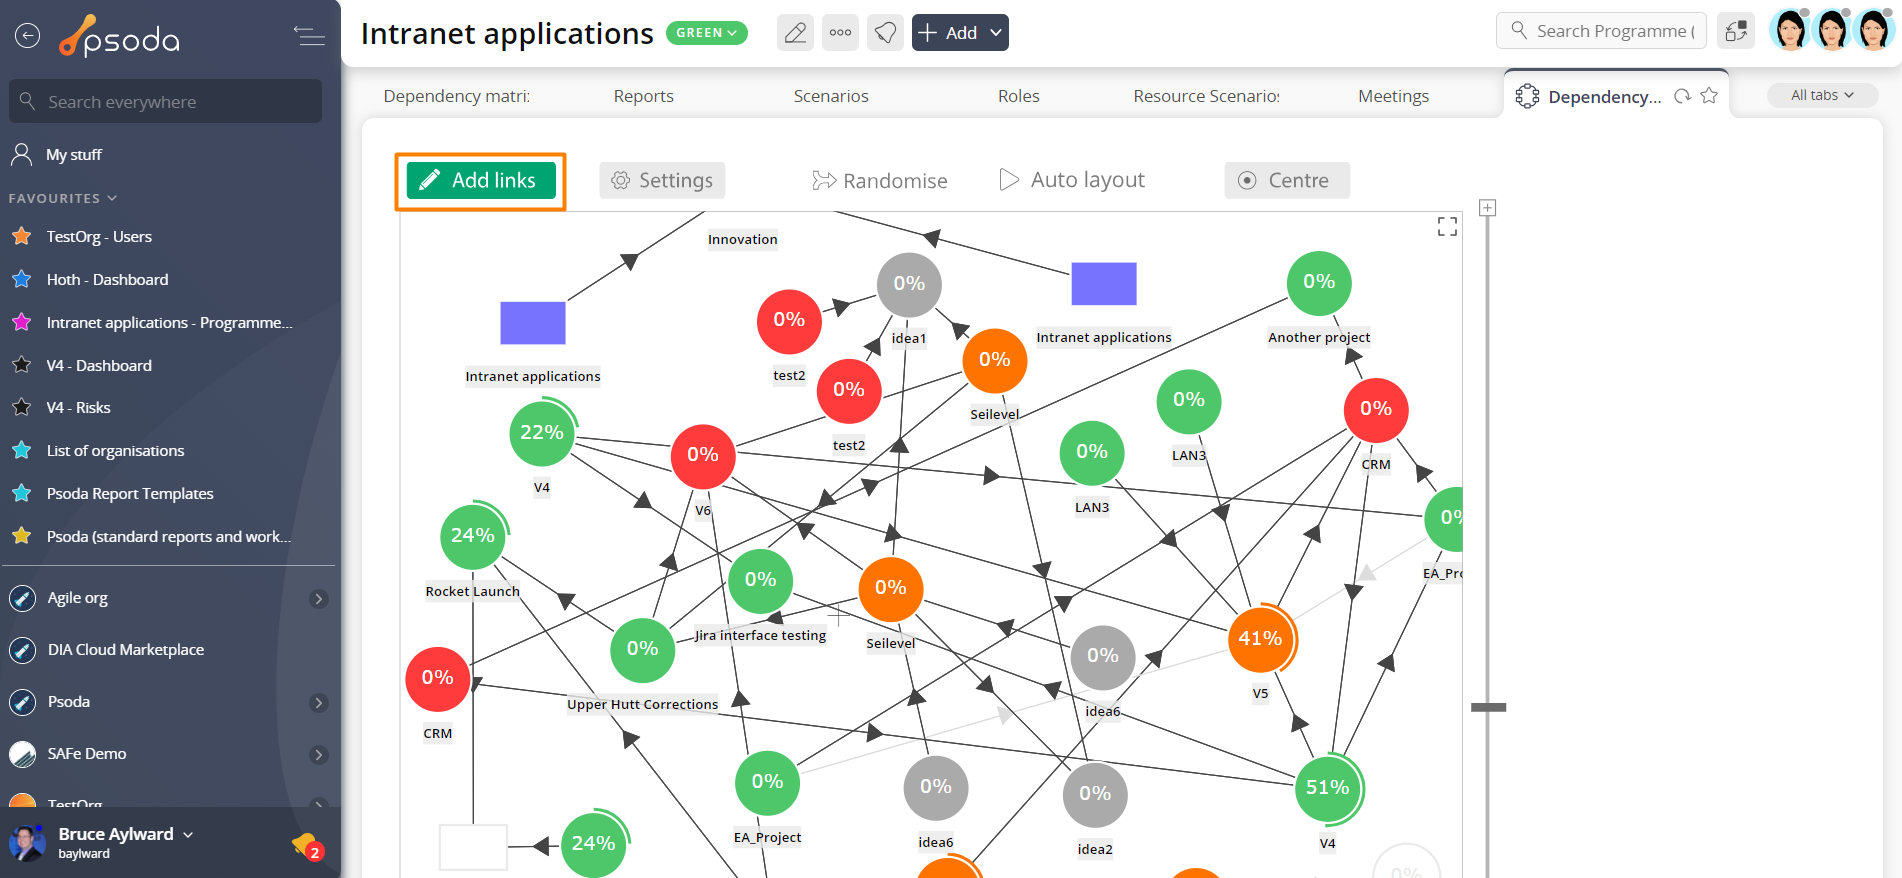
Figure 2 – Add link button
Then select a source project or programme to link from: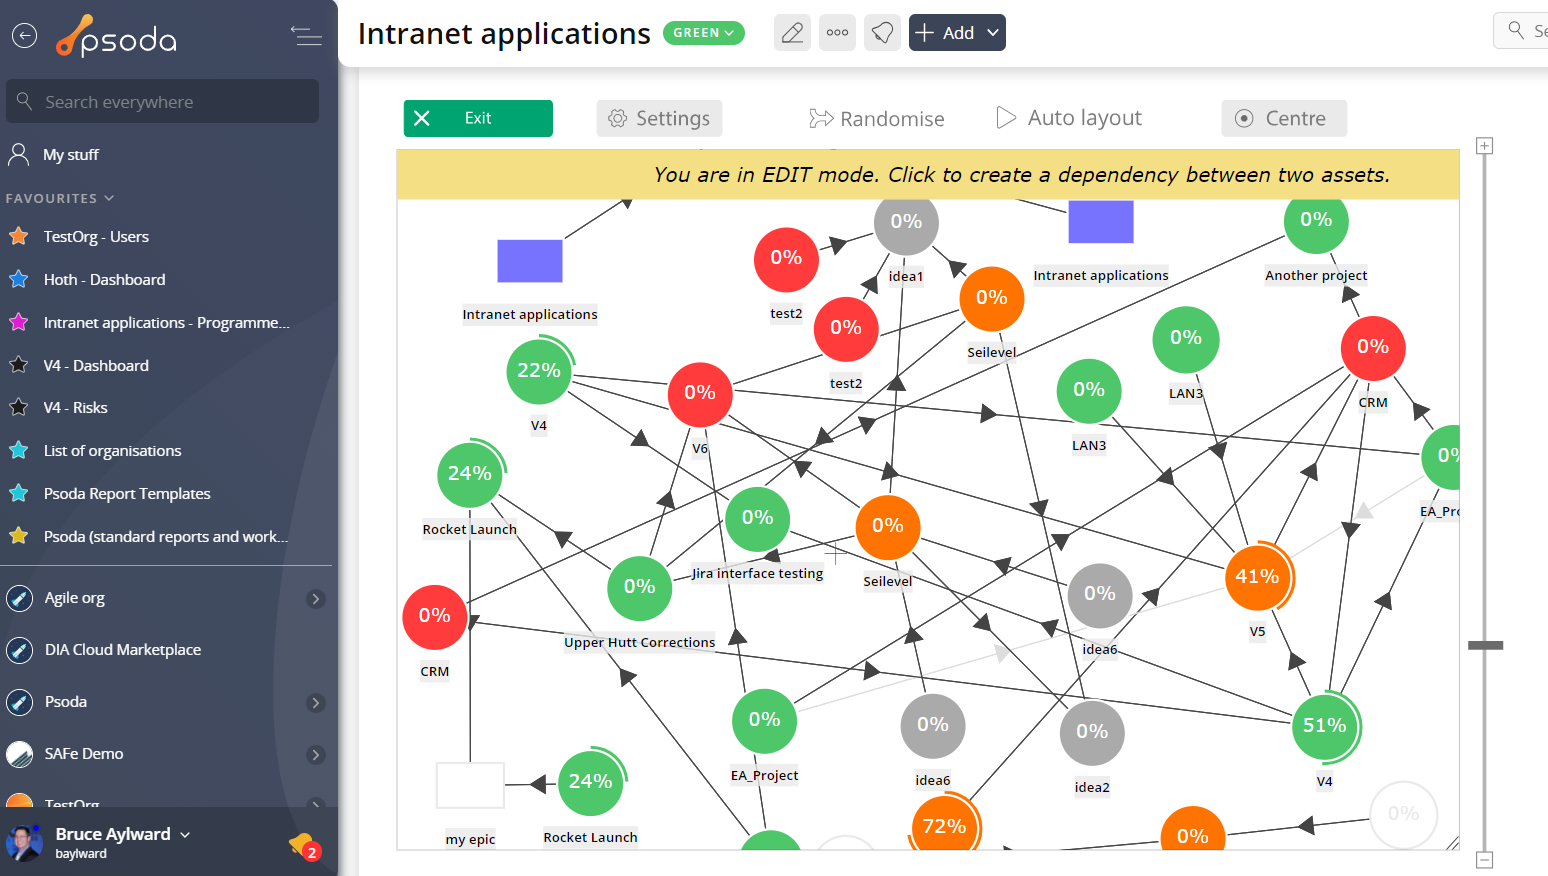
Figure 3 – Add link
Then select a dependent project to link to. You will then see the add dependency popup where you can confirm the creation of the dependency.Controls
There are various controls for navigating and manipulating the map shown in figure 4.- This button will randomly place the objects on the map. This can be useful as a starting point for laying out the map when it’s messy
- This button will enable/disable the auto layout feature. When this is enabled, Psoda will attempt to automatically position the objects on the map
- This button will centre the map position
- This button will full screen the map
- This button will zoom the map in
- This button will zoom the map out
- This slider can be dragged to zoom the map in and out
- This handle can be dragged to resize the map
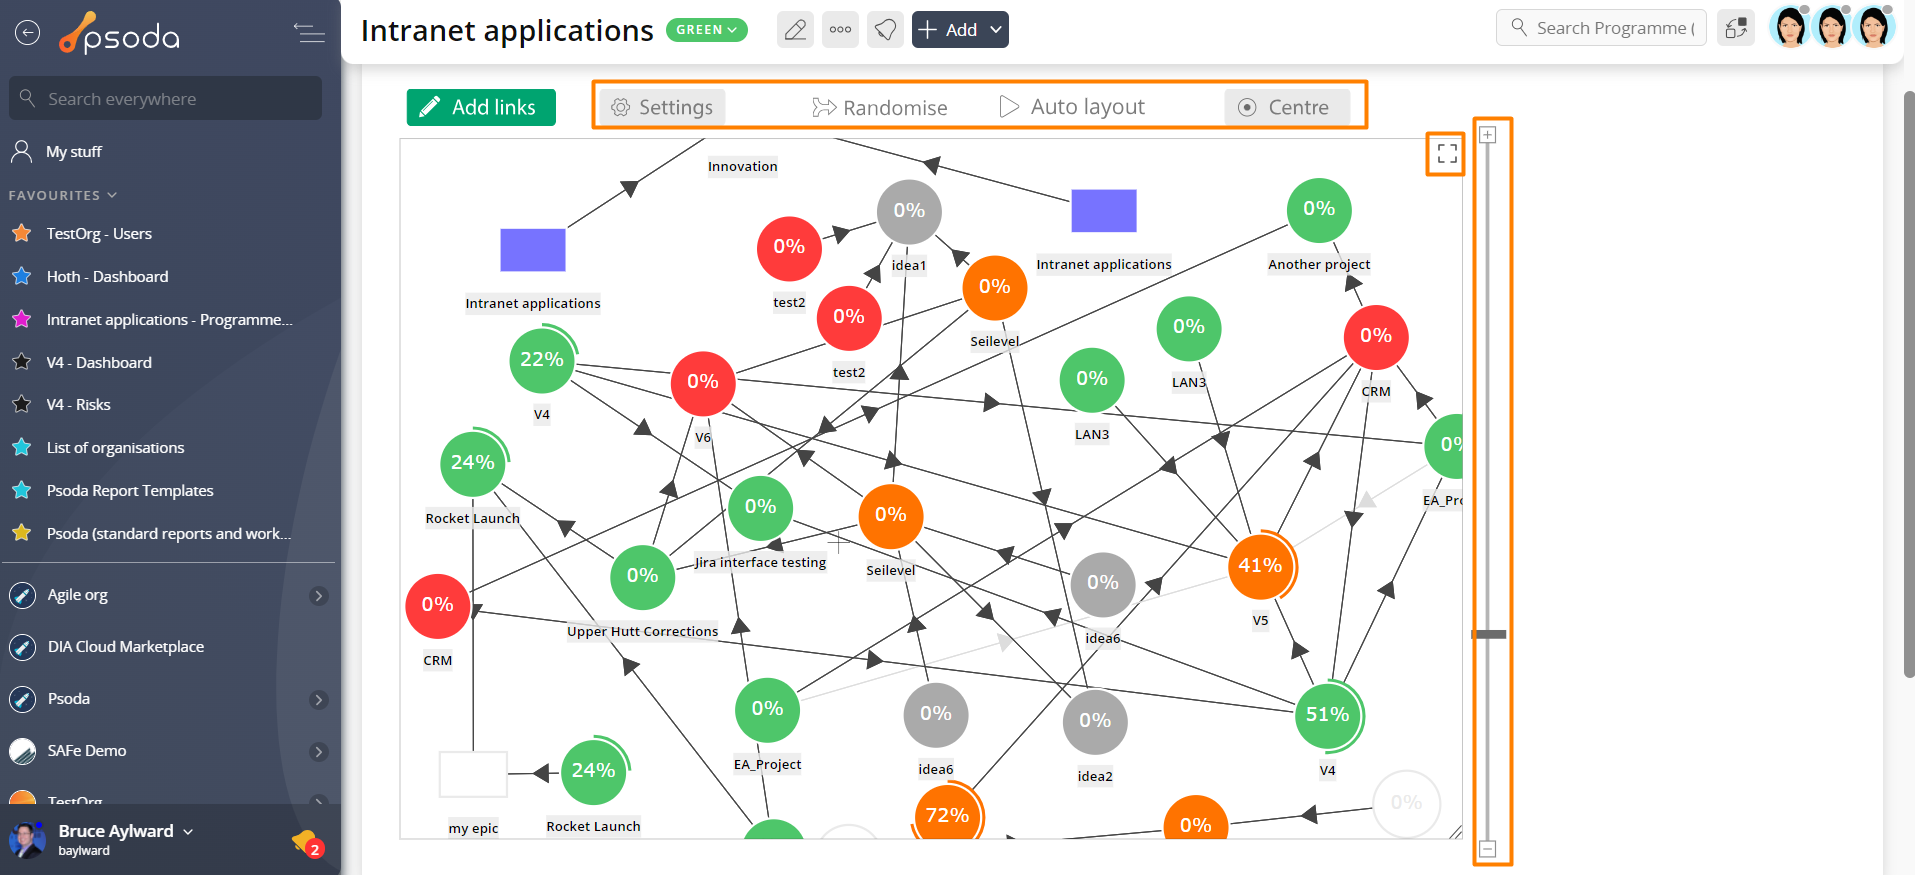
Figure 4 – Controls