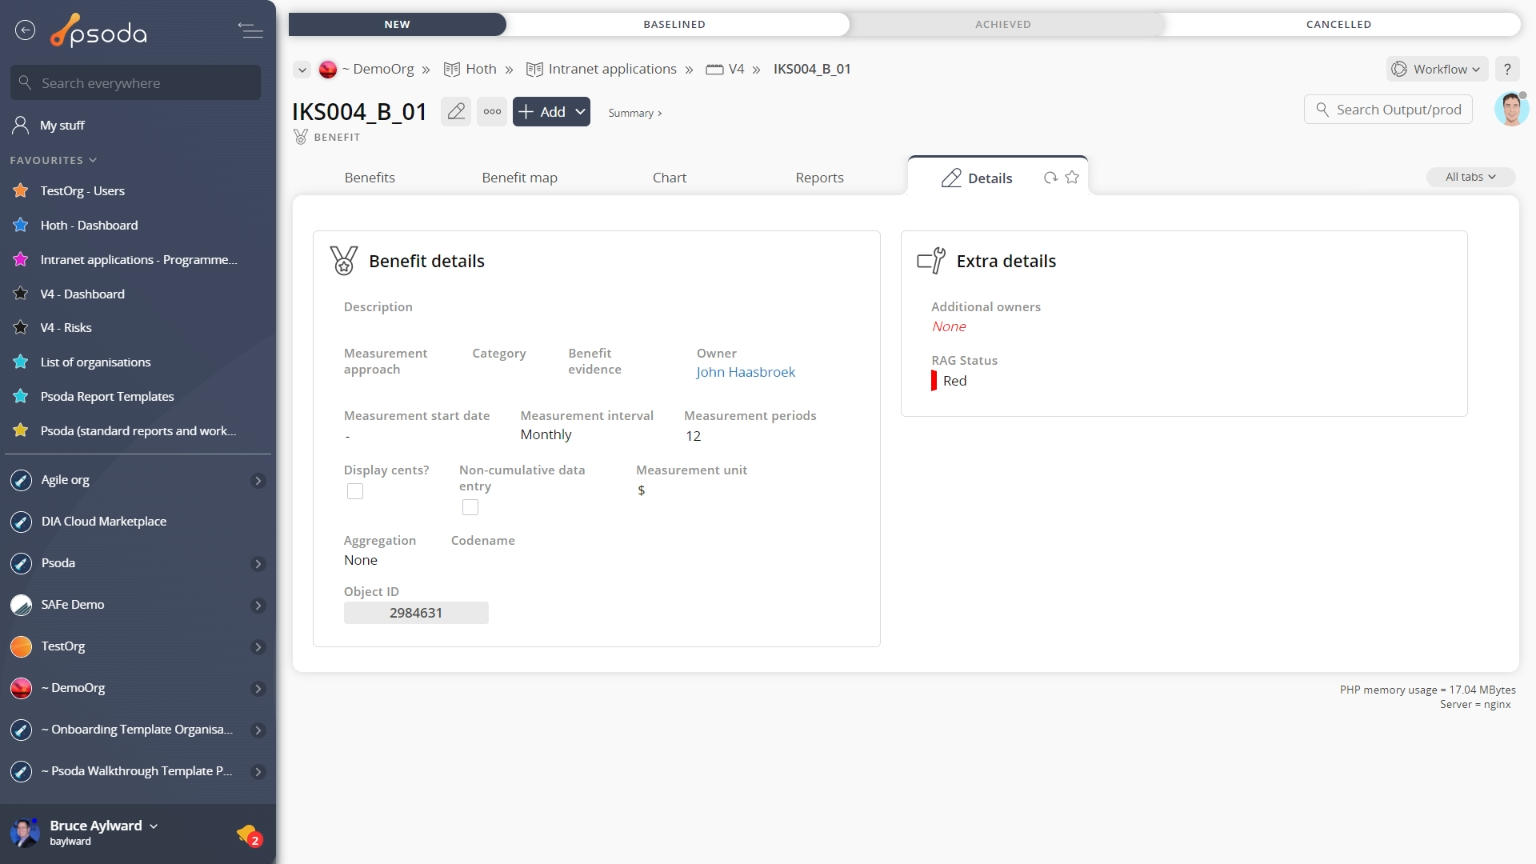
Figure 1 – Benefit view page
The top header area allows you to Actions
This tab shows an asset listing of all of the actions registered for this benefit, as shown in Figure 2. By default, this table will present you with a number of details about the actions such as it’s reference, description, priority and due date to name a few. If you click on the reference link of the listed action, you will navigate to that action’s view page.
From the Actions column of this actions table, you can act on individual actions by 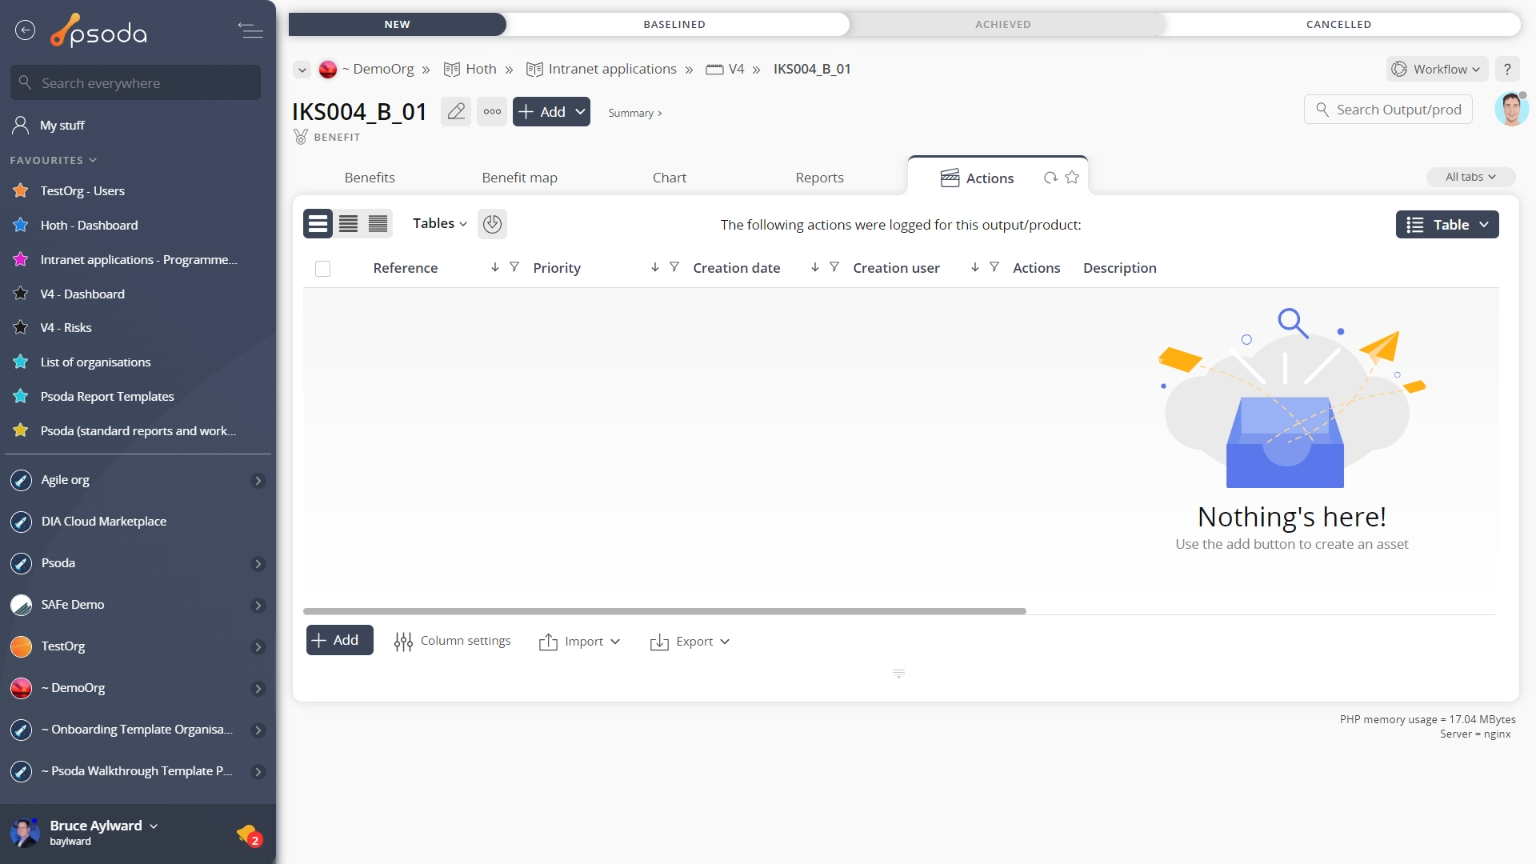
Figure 2 – Benefit actions tab
Note that you can customise your table view by clicking the Attachments
This tab shows an asset listing of all of the attachments that have been added to this benefit, as shown in Figure 3. By default, this table will present you with a number of details about the attachments such as the file’s name, attachment type, view the version and access a download link.
From the Actions column of this attachments table, you can act on individual attachments by 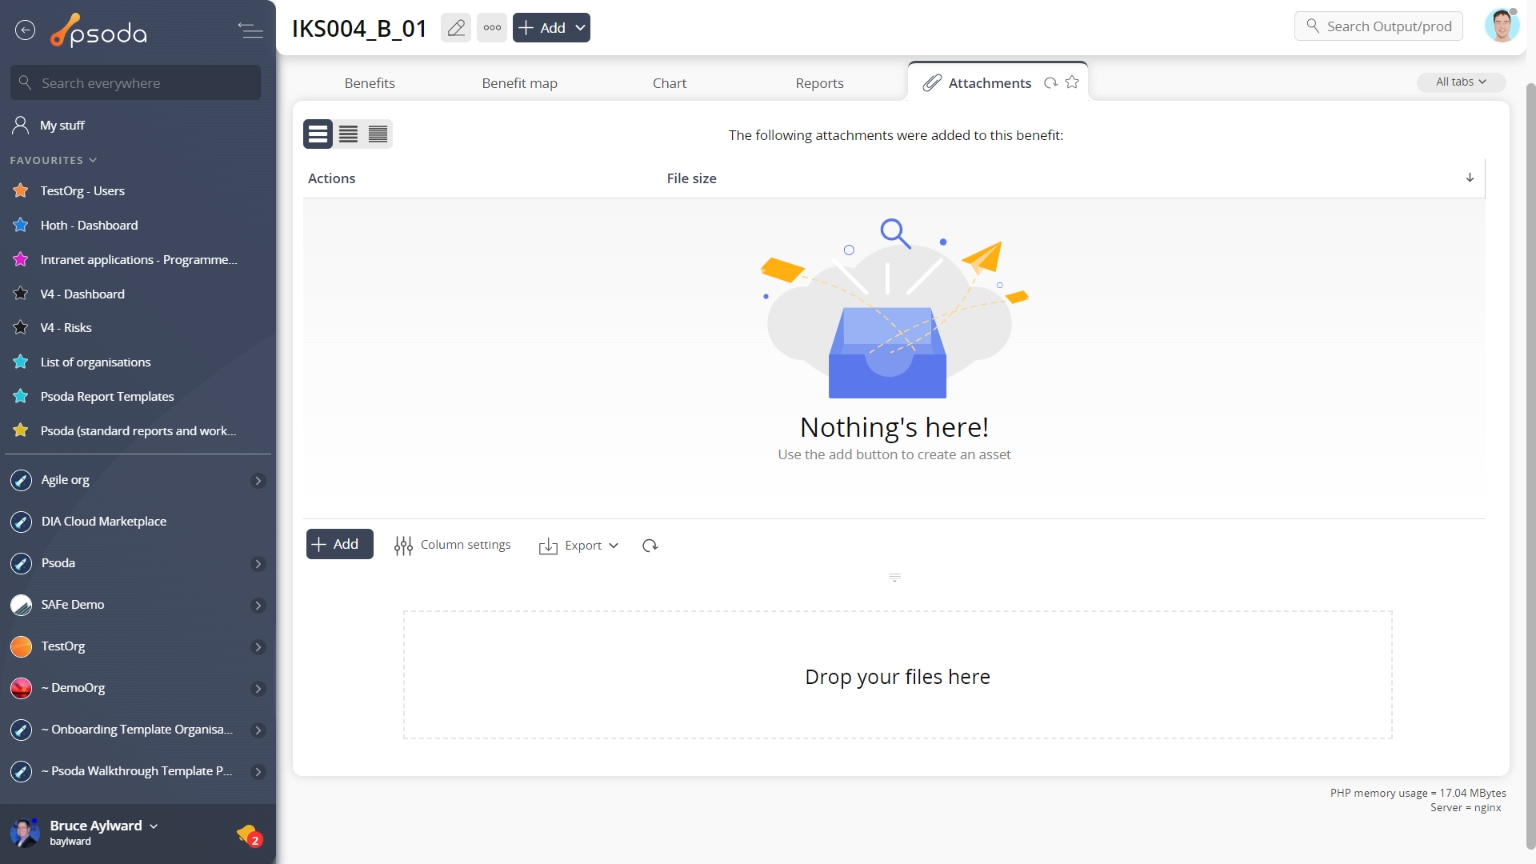
Figure 3 – Benefit attachments tab
Note that you can customise your table view by clicking the Benefits
This tab shows the benefits table shown in Figure 4, containing any sub-benefits associated with this benefit. By default, this table provides measurement information about the benefits listed, it’s title and a progress indicator. From here you may also view the workflow 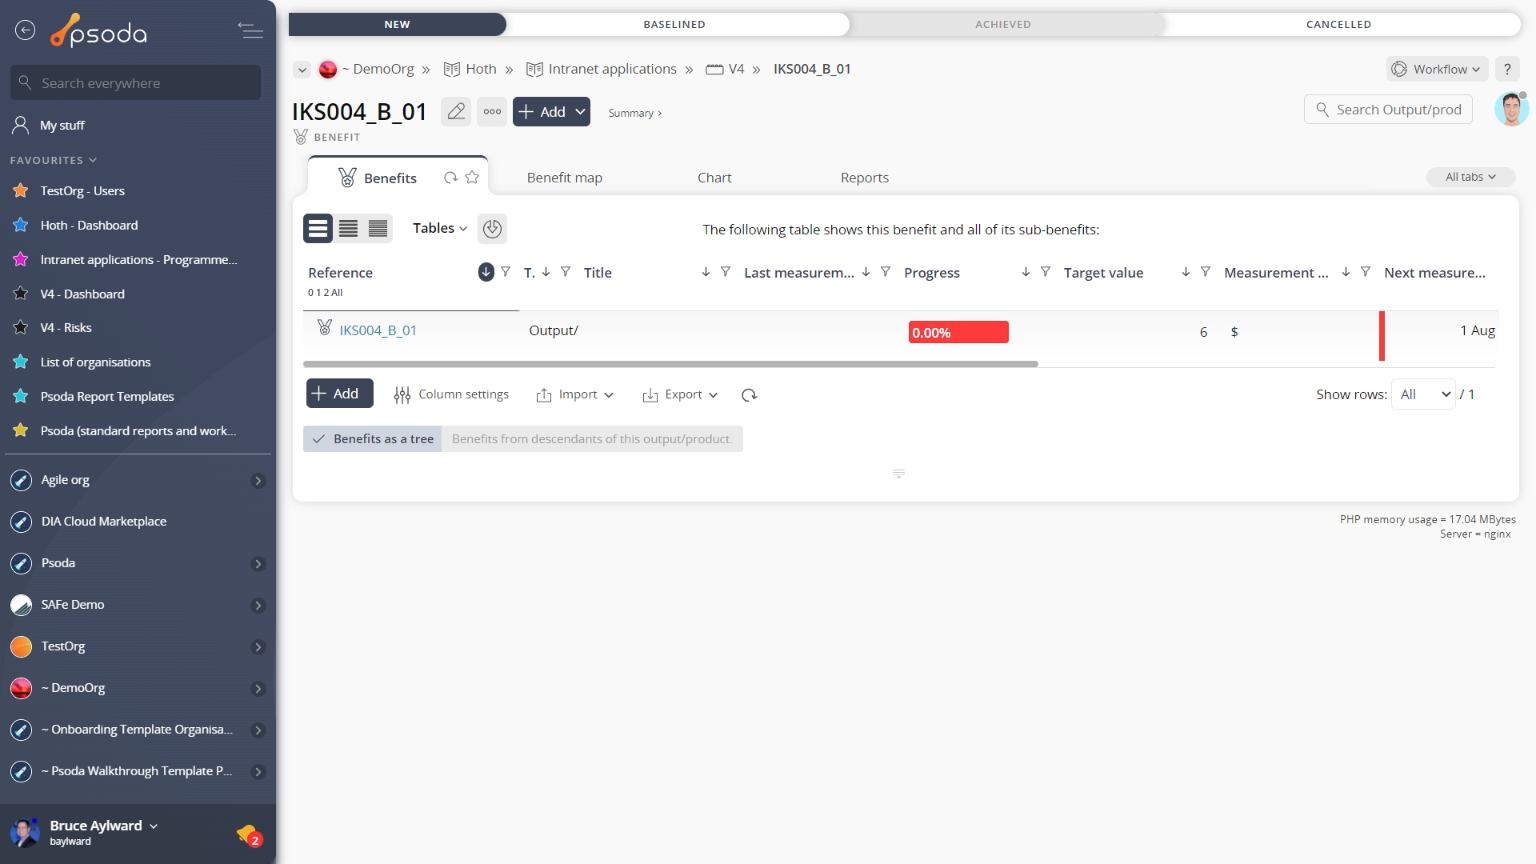
Figure 4 – Benefit benefits tab
Note that at the bottom of the table you can ![]() add more benefits, or customise your change table view by clicking the
add more benefits, or customise your change table view by clicking the ![]() edit button to show or hide certain benefit information, or export this benefit list to
edit button to show or hide certain benefit information, or export this benefit list to ![]() Excel or
Excel or ![]() CSV files.
CSV files.
Benefit map
Instead of a table view, this tab provides a graphical view of your benefits. The benefits map is generated from the information you put in the benefits table. Figure 5 below shows an example benefits map: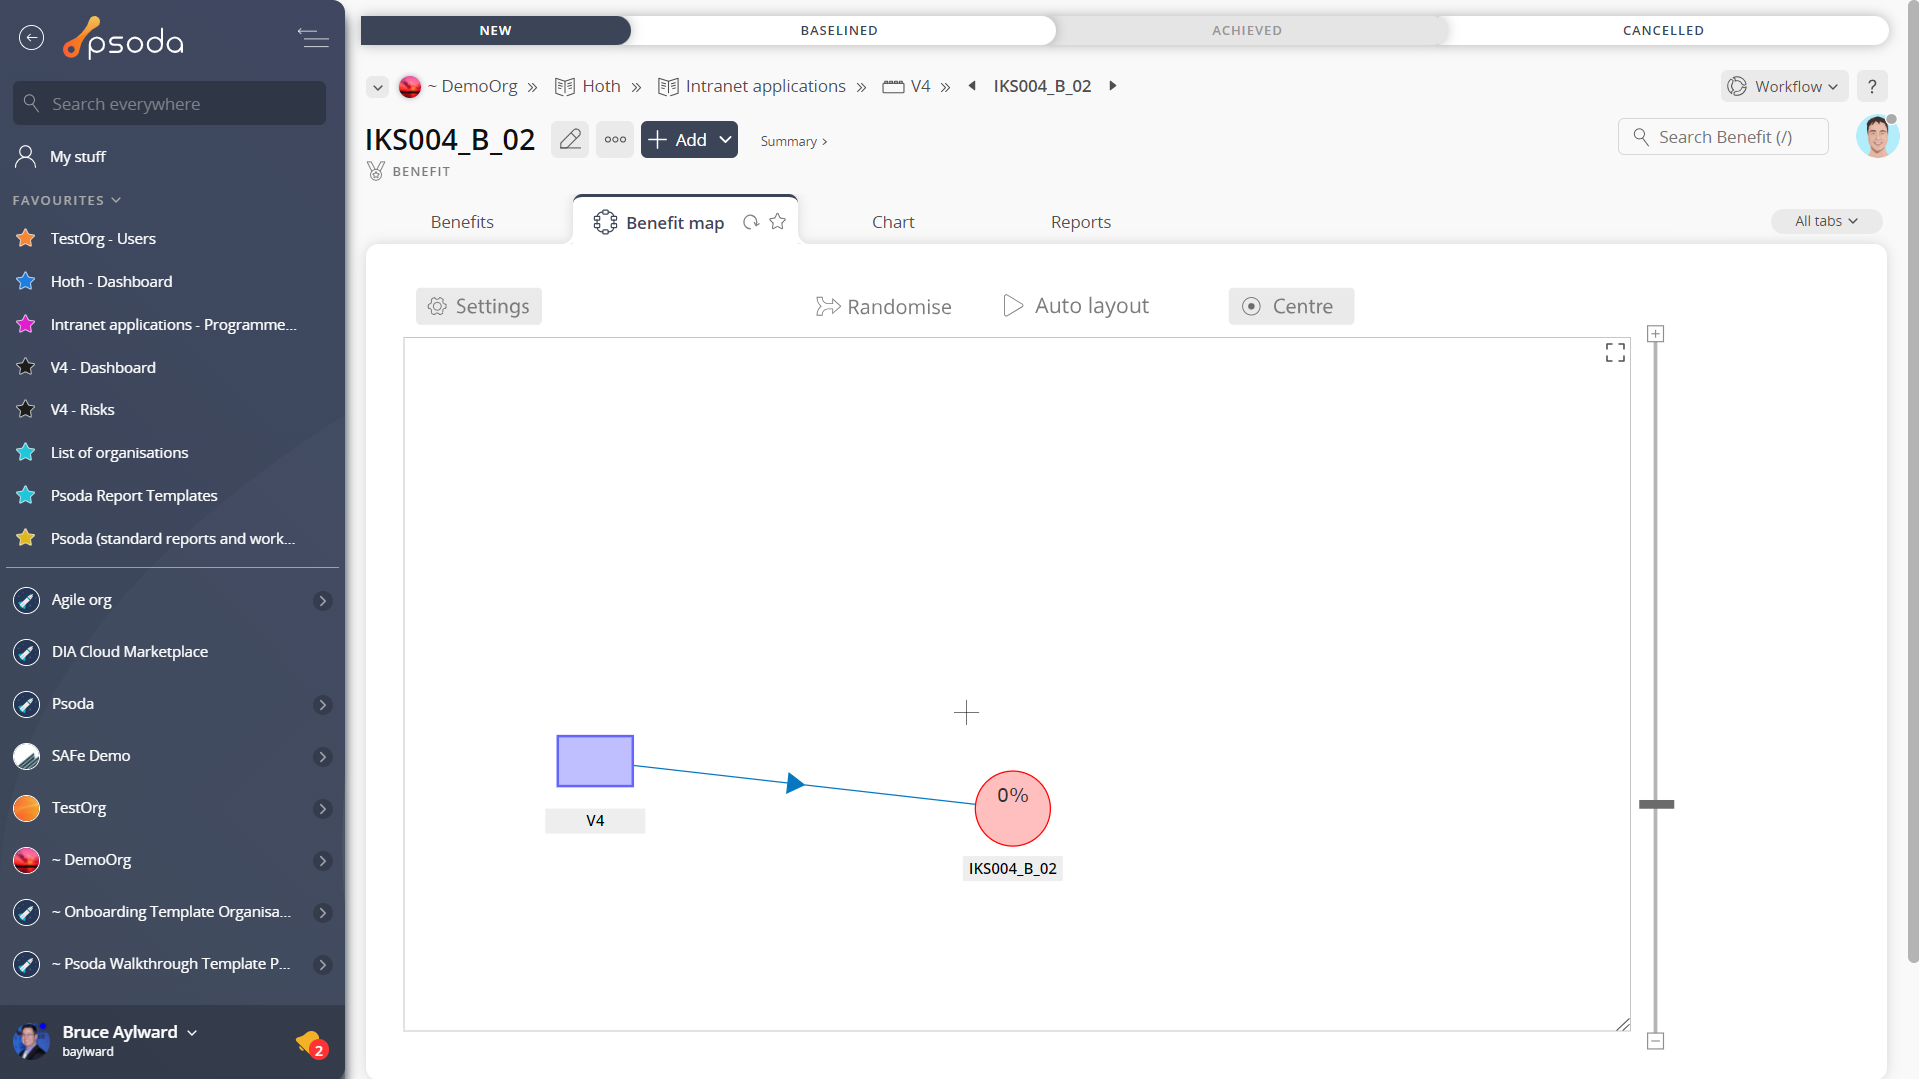 Figure 5 – Benefit Map
 Comments
This tab shows an asset listing of all of the comments that 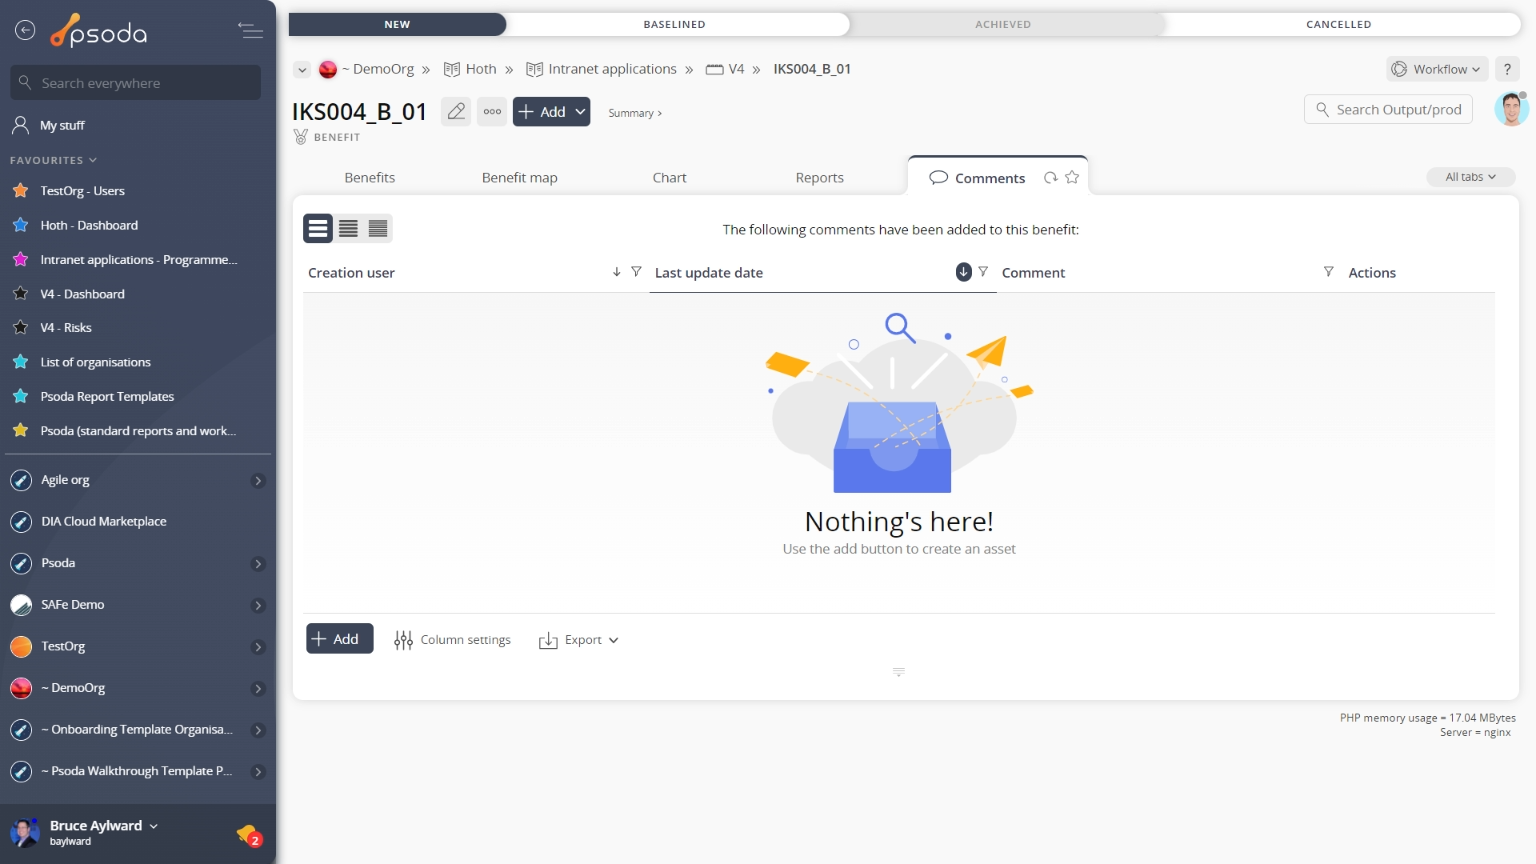
Figure 7 – Benefit comments tab
Note that you can customise your table view by clicking the Details
Figure 8 – Benefit details tab
This tab shows some additional details of the benefit, for example the description, more detailed measurement information, the expression used for report templates and reports, it’s codename to name a few. History
This tab shows shows some basic history of the benefit, as shown in Figure 9. By default, this tab will present you with a number of details about the benefit’s history such as the creation date, creation user, last update date and last update user. If the benefit has been changed then this section will also show a table of all the changes that has been made, including the date of each change, the field changed, the value before the change and the user who made the change.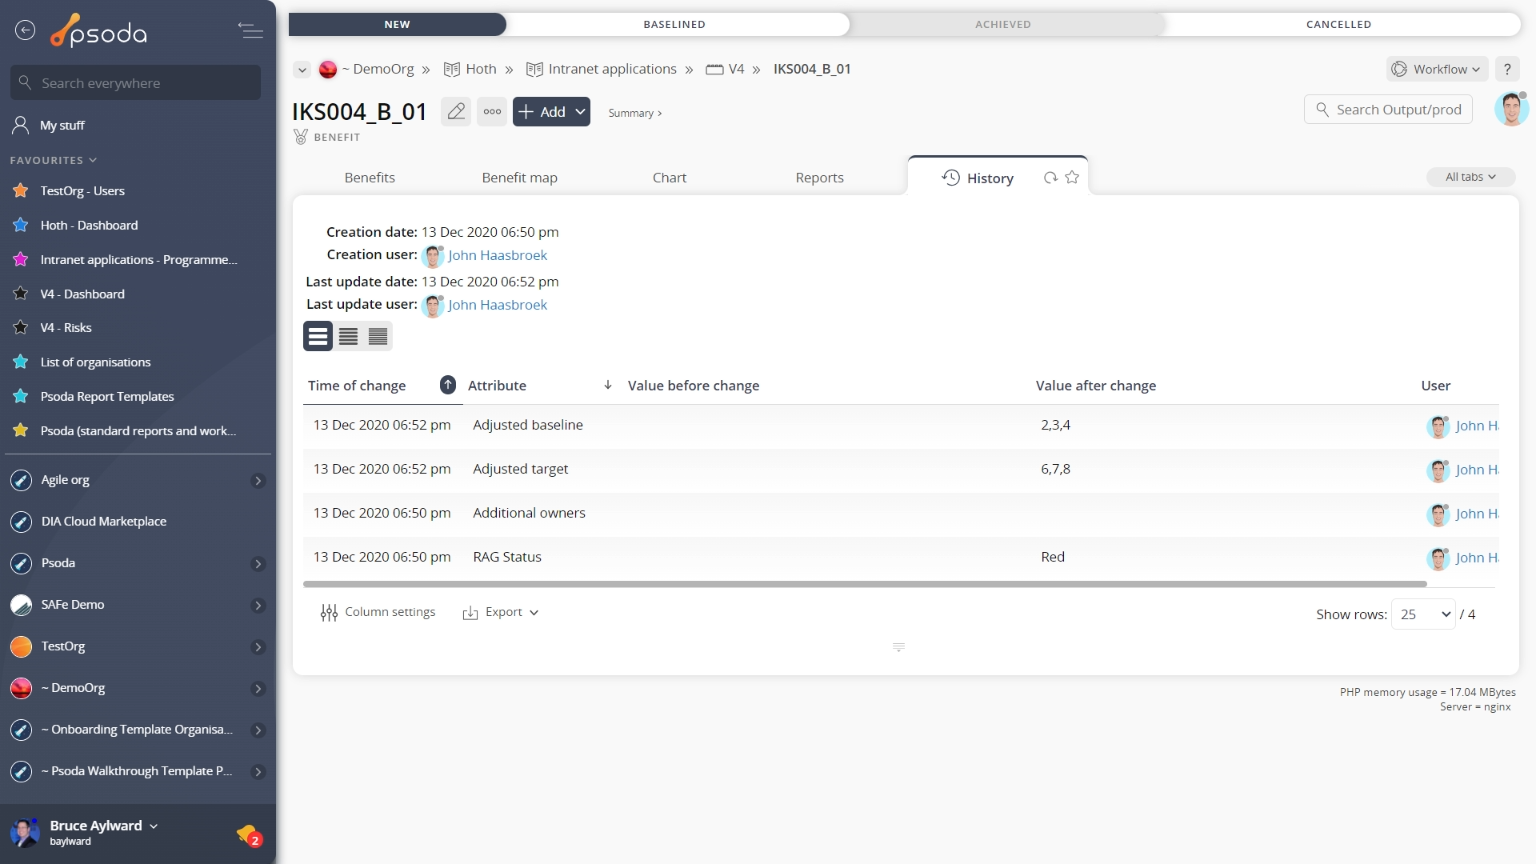
Figure 9 – Benefit history tab
Note that you can customise your change table view by clicking the ![]() edit button at the bottom of the change table. Here, you can also export this list of changes to
edit button at the bottom of the change table. Here, you can also export this list of changes to ![]() Excel or
Excel or ![]() CSV files.
CSV files.
Issues
This tabbed view shows the issues table as seen in Figure 10, listing any issues that have been logged for this benefit. By default, this table provides impact and priority information, plan progress and resolution dates for the issues listed, as well as any actions that can be taken. The workflow column also provides information as to the next workflow transitions available.The Actions column of the issues table provides accessible functions to act on a chosen issue. These functions include 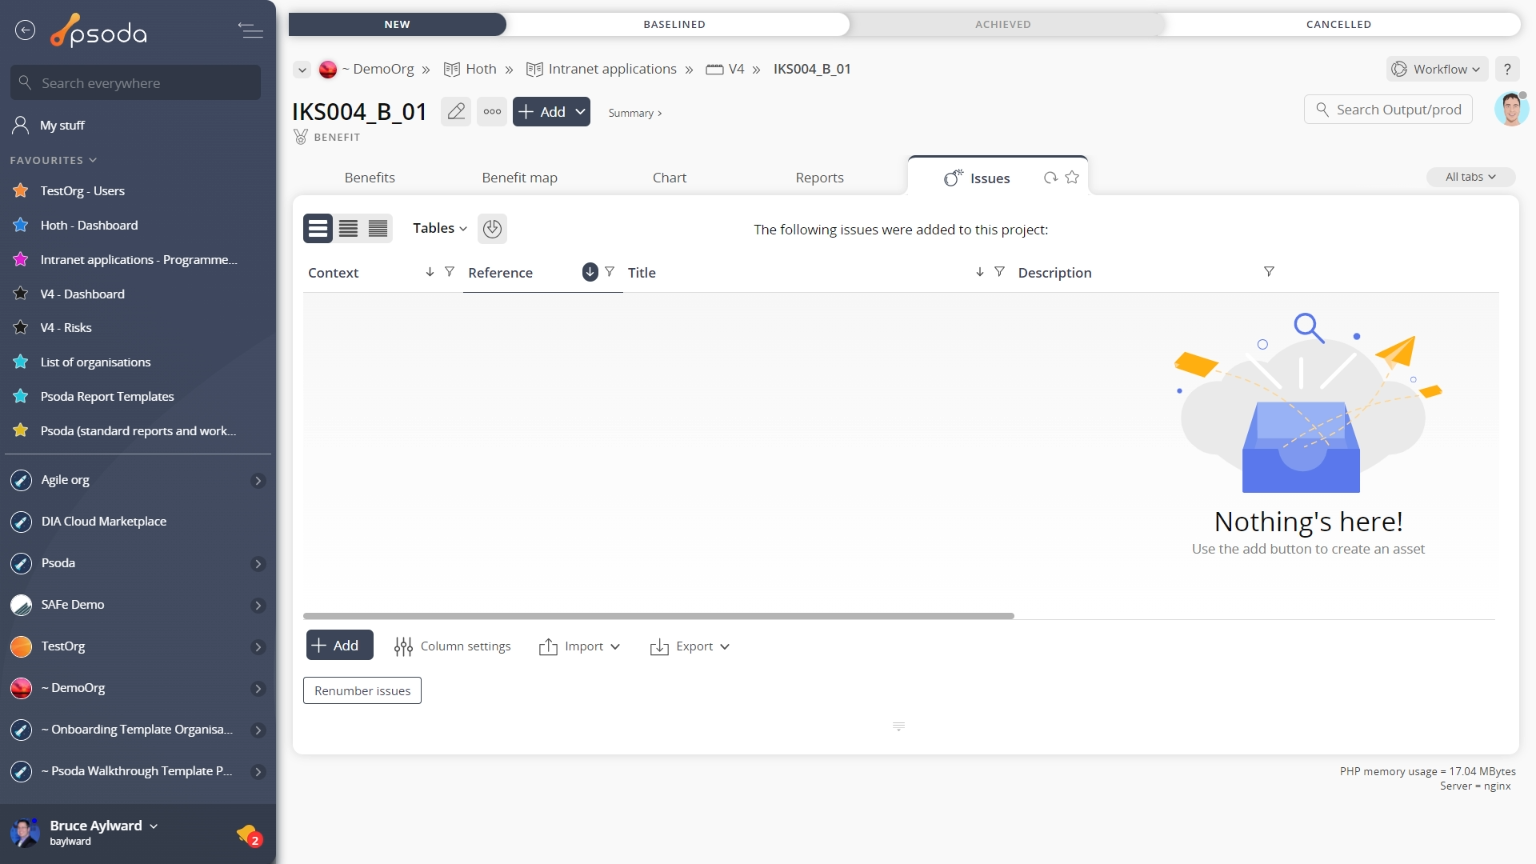
Figure 10 – Benefit issues tab
Note that at the bottom of the table you can Reports
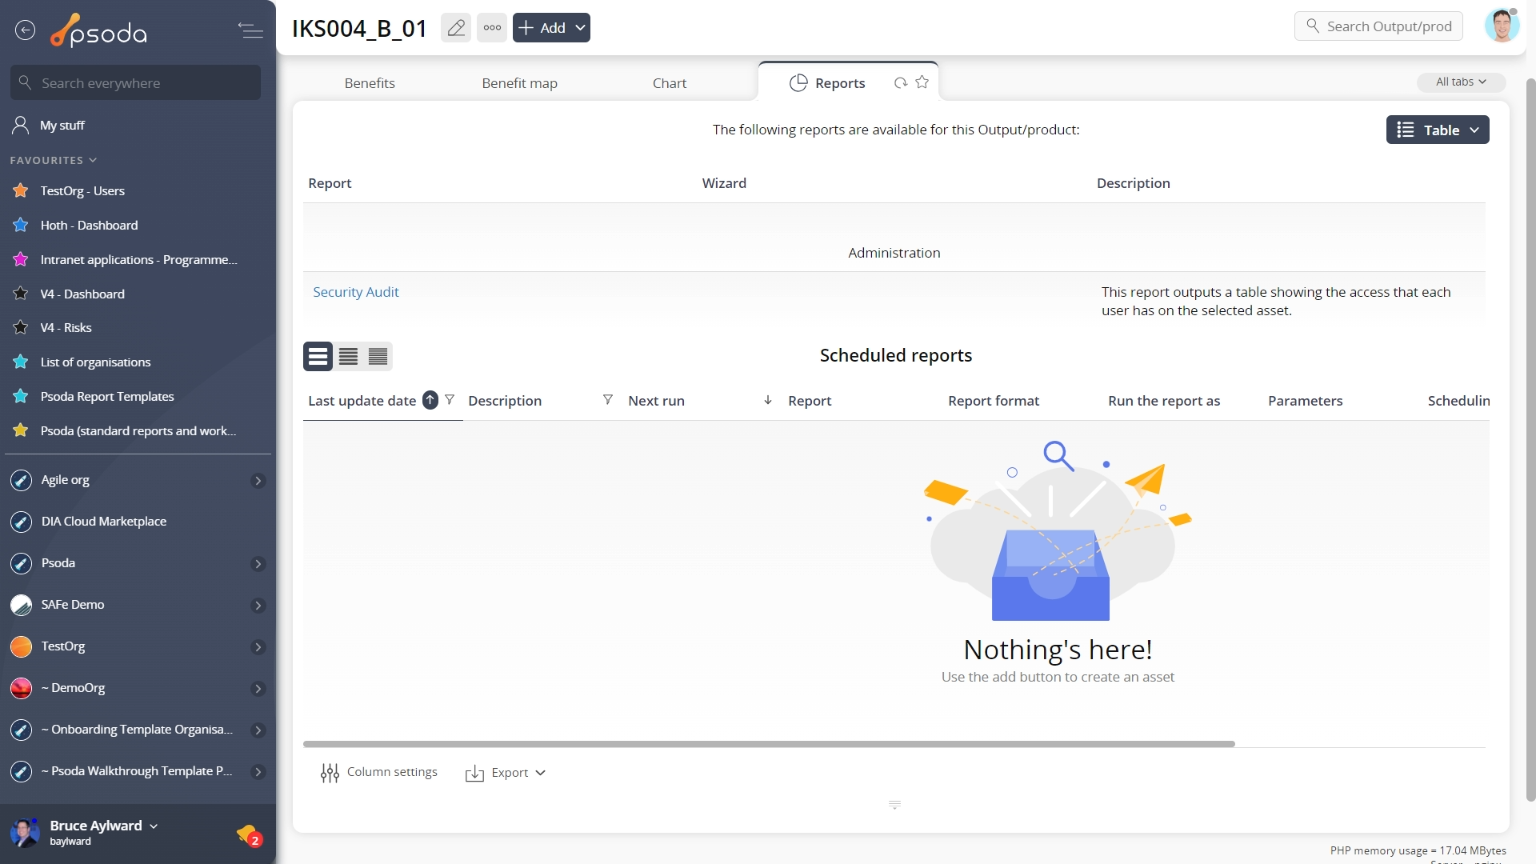
Figure 12 – Benefit reports tab
This tab shows a list of reports that you can run for this benefit, as shown in Figure 12. Risks
Risks
This tabbed view shows the risks table as seen in Figure 13, listing any risks that have been logged for this benefit. By default, you will be shown the risk’s context, reference, title, description, proximity, any workflow transitions that may be available and other details also captured in the screenshot below.The Actions column of this table provides accessible functions to act on a chosen role. These functions include 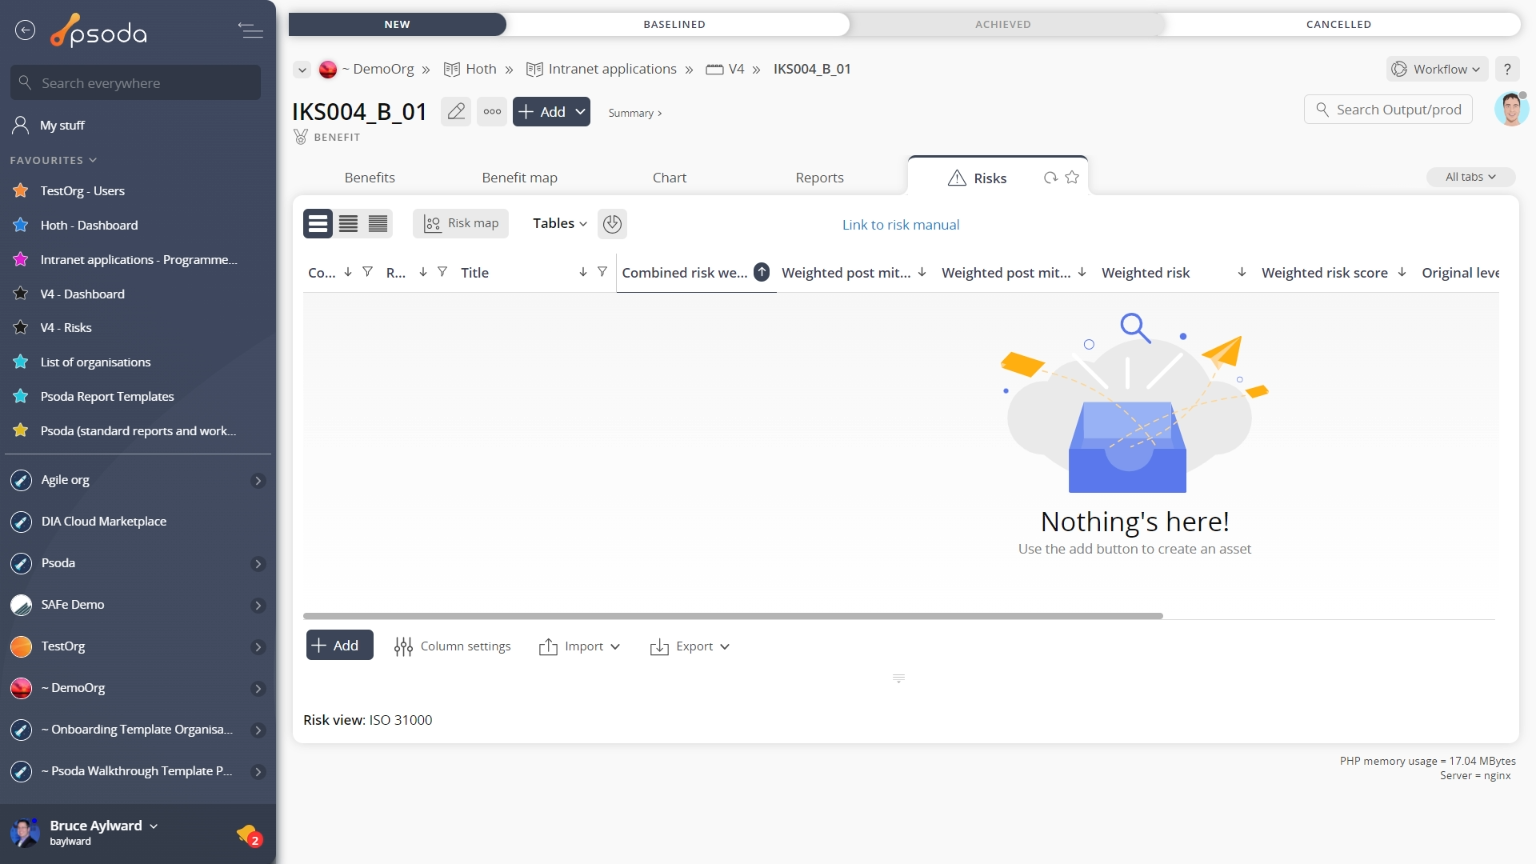
Figure 13 – Risk table
Note that at the bottom of this table you can Workflow timeline
This tab shows you a table containing each of the state transitions that have been applied to this benefit on the associated workflow. Note that you can customise your table view by clicking the 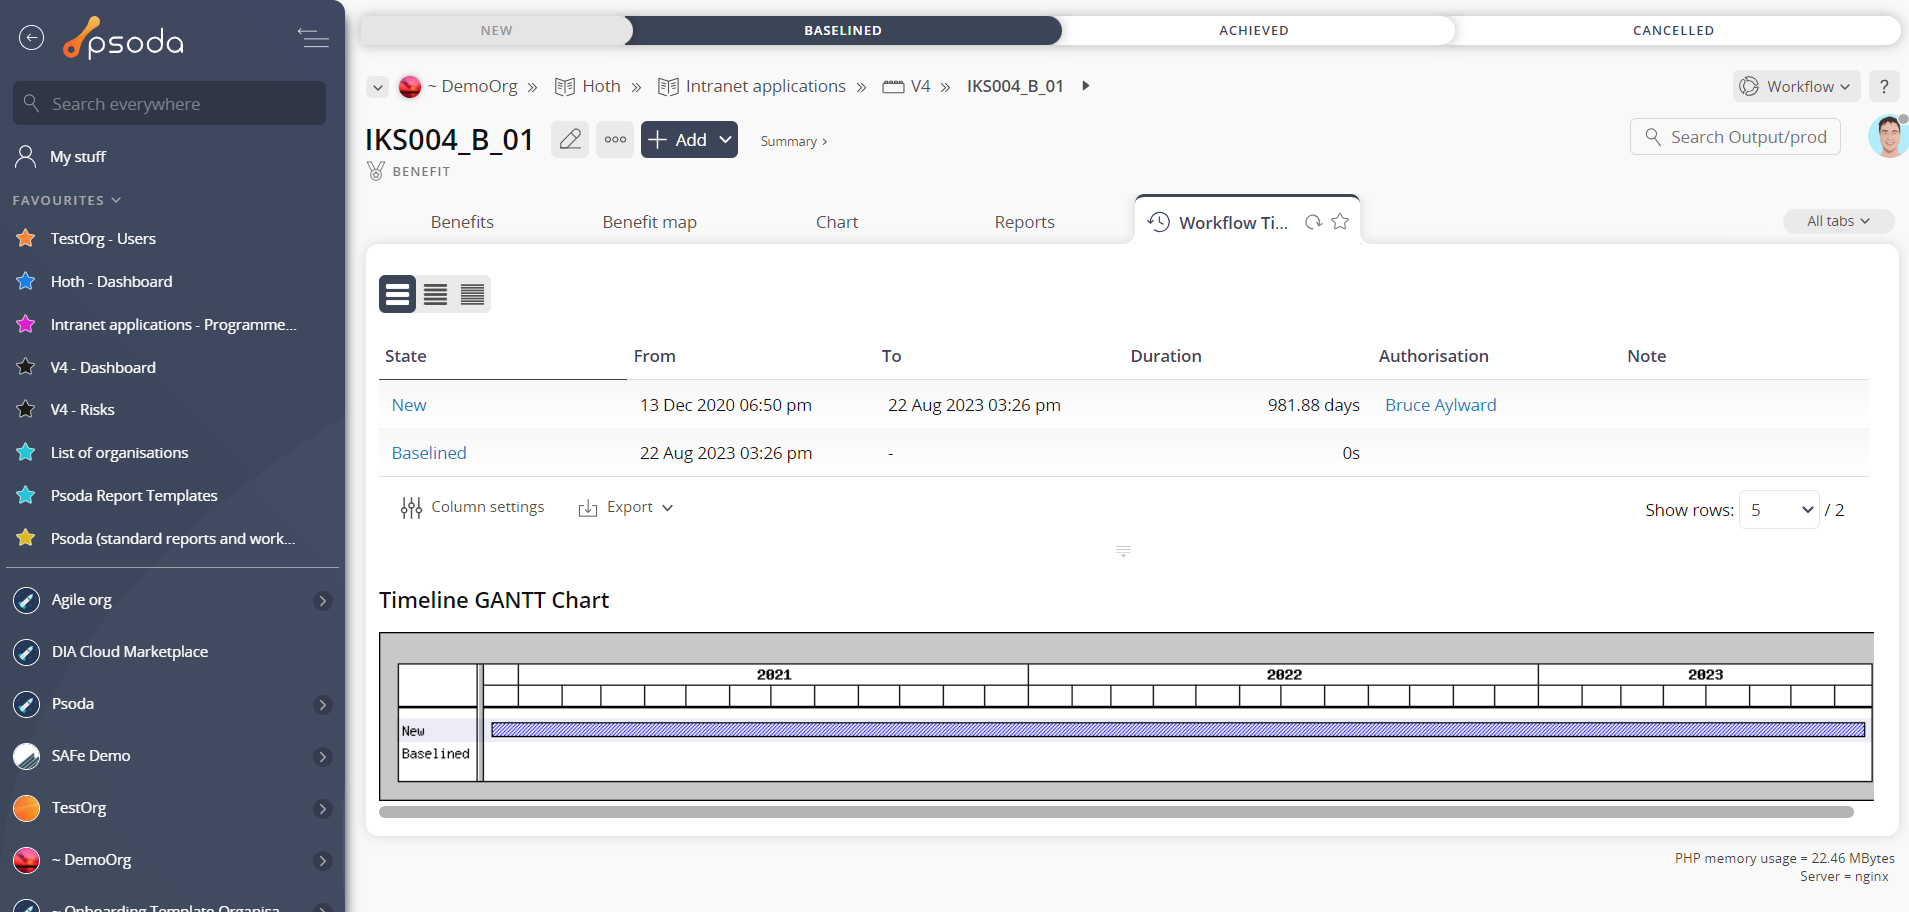 Figure 14 – Benefit workflow timeline tab
Below the state transition timeline table, you will be presented with a visual breakdown of the timeline in a GANTT chart, as shown in Figure 14.