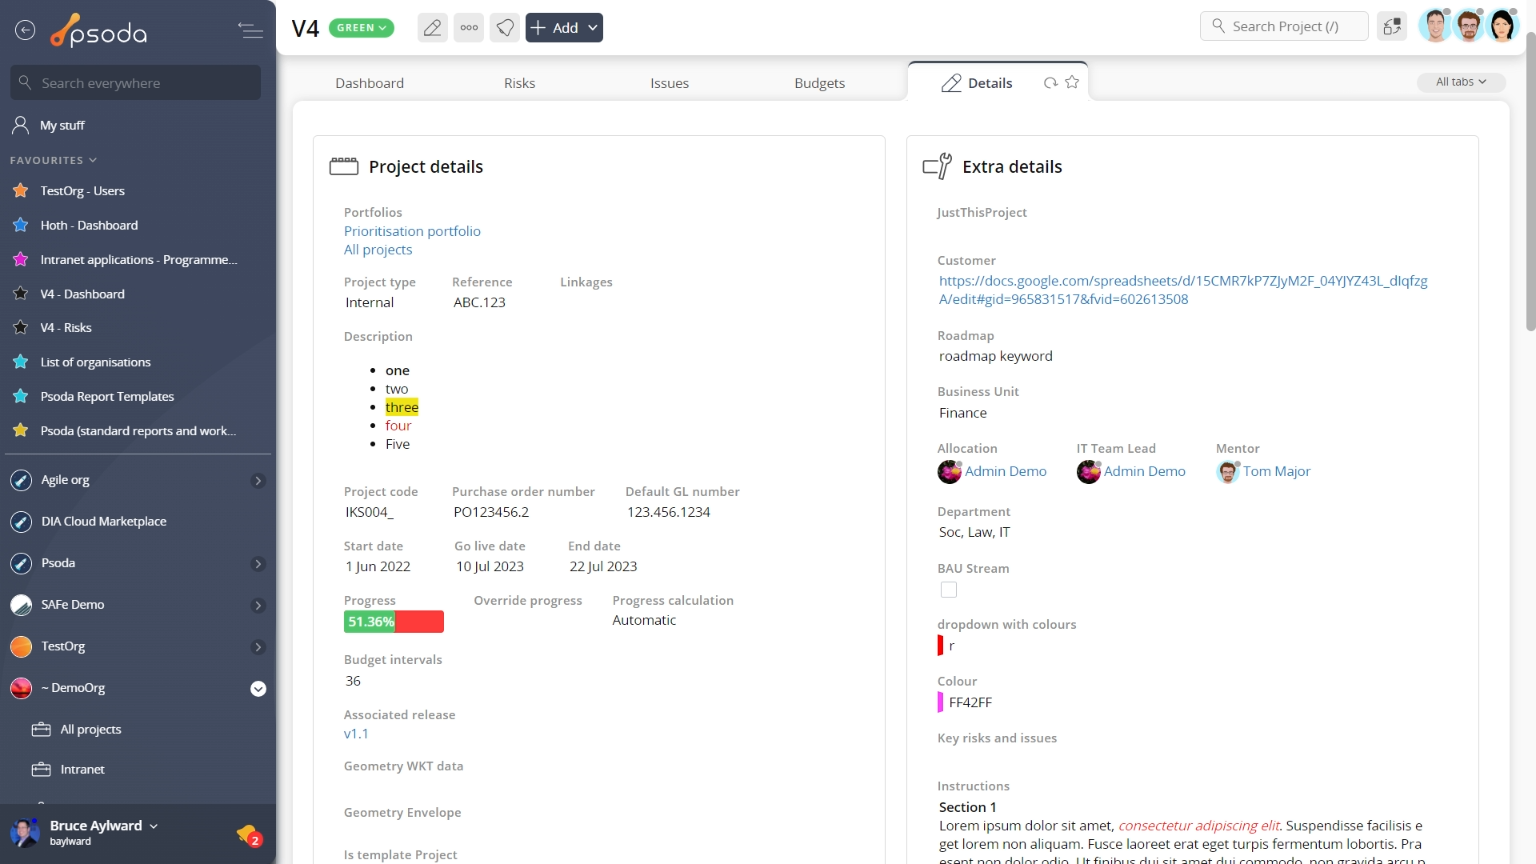
Figure 1 – Project view page
The top header area allows you to Access Control Lists (ACLs)
This tab shows an asset listing of all of the access control lists this project appears in, as shown in Figure 2. By default, this table will present you with a number of details about the ACLs such as the group of users that have access to this ACL and the a link to the list itself. If you click the link in the group column, you will navigate into the selected group’s view page. Equally, if you click the link in the ACL column, you will navigate into the selected ACL’s view page
From the Actions column of this ACLs table, you can act on individual ACLs by 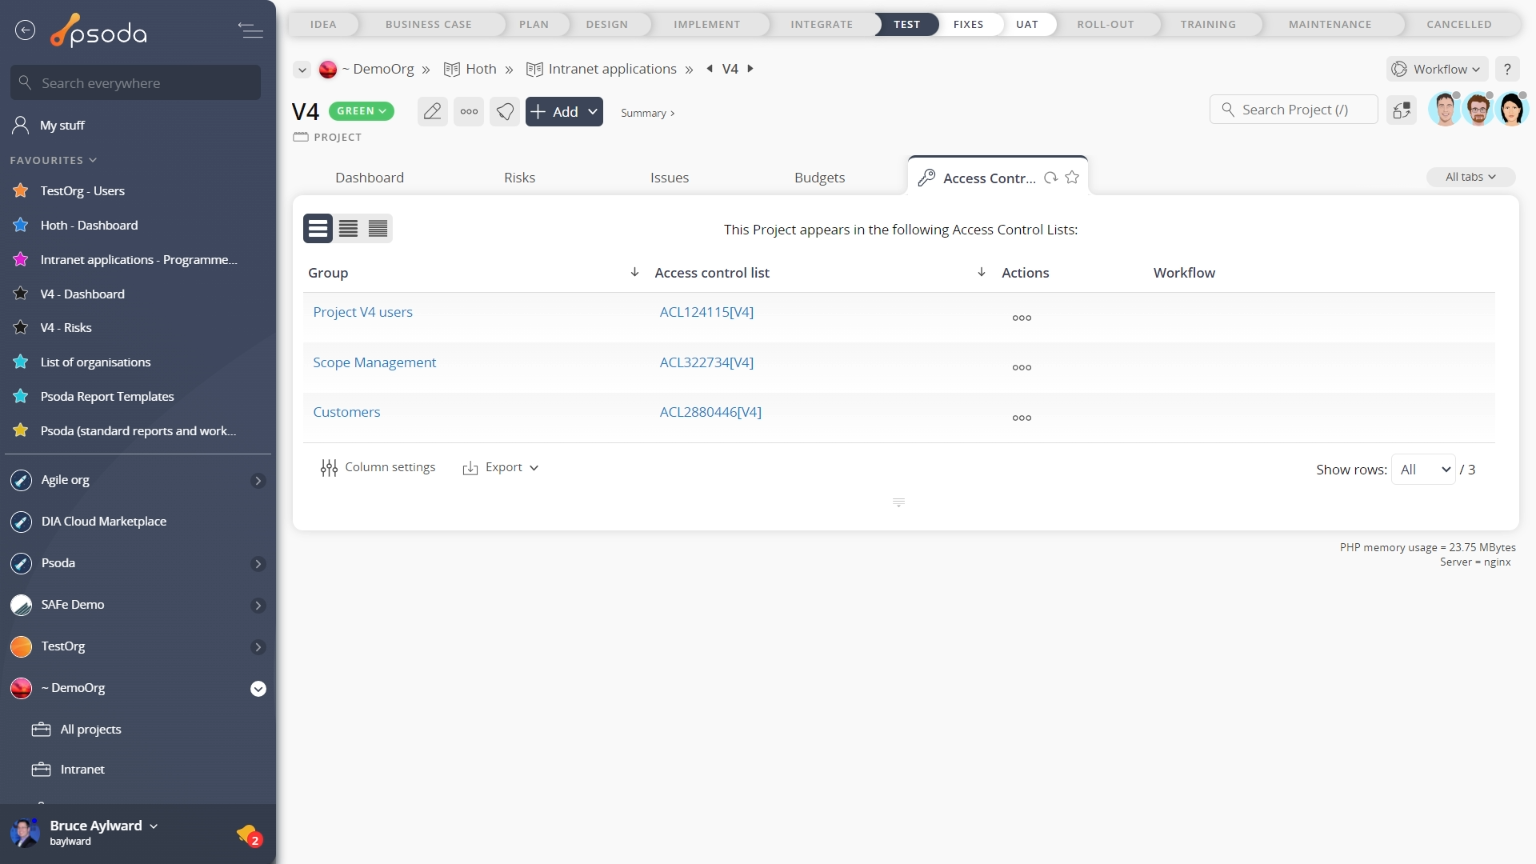
Figure 2 – Project ACL tab
Note that you can customise your table view by clicking the Actions
This tab shows an asset listing of all of the actions registered for this project, as shown in Figure 3. By default, this table will present you with a number of details about the actions such as it’s context, reference, description, priority and due date to name a few. If you click on the reference link of the listed action, you will navigate to that action’s view page.
From the Actions column of this actions table, you can act on individual actions by 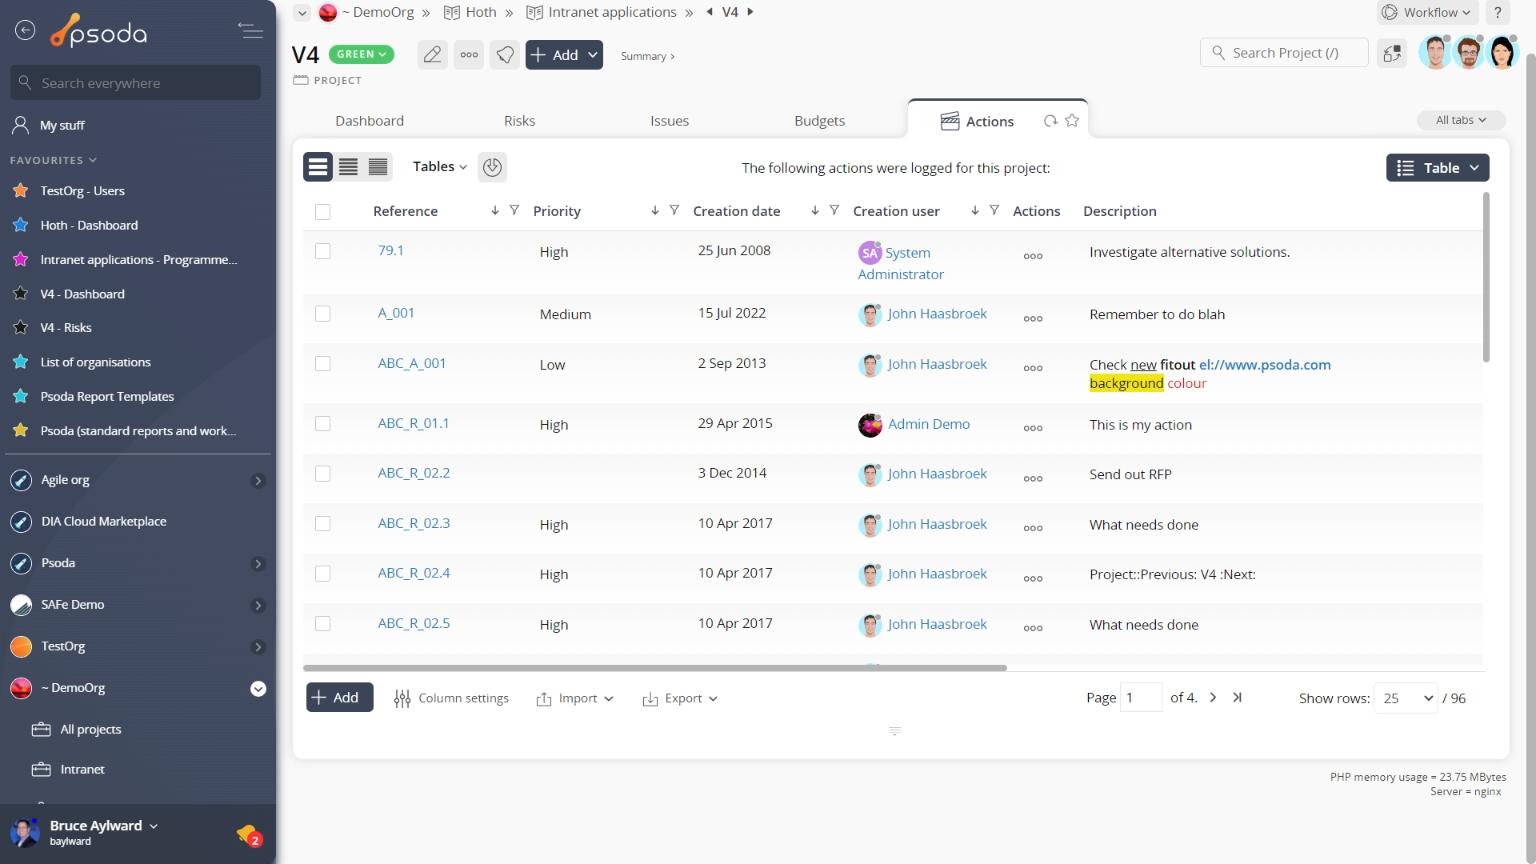
Figure 3 – Project actions tab
Note that you can customise your table view by clicking the Advanced Estimates
This tab shows an asset listing of all of the tasks that have been added to this project that are scheduled according to advanced estimates, as shown in Figure 4. By default, this table will present you with a number of details about the advanced estimates such as it’s context, reference, start and end dates, the users listed as resources for that estimate, resource total and a breakdown of actual and variance comparisons for time breakdowns.
From the Actions column of this advanced estimates table, you can act on individual estimate by 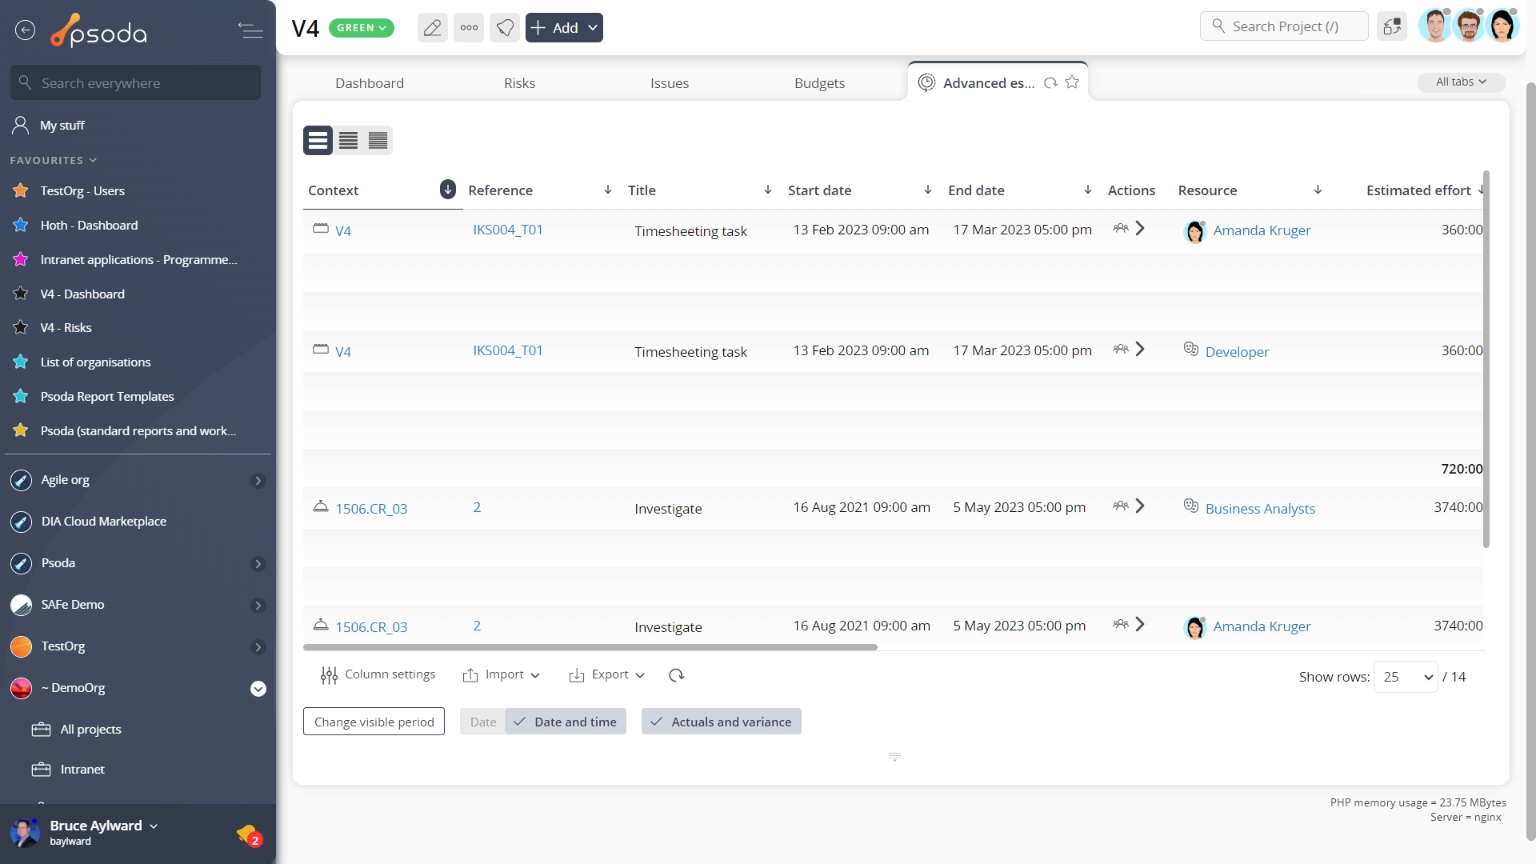
Figure 4 – Project advanced estimates tab
Note that you can customise your table view by clicking the ![]() edit button at the bottom of the advanced estimates table. Here, you can also export this list to
edit button at the bottom of the advanced estimates table. Here, you can also export this list to ![]() Excel or
Excel or ![]() CSV files.
CSV files.
 Assumptions
This tab shows an asset listing of all of the assumptions that have been added to this project, as shown in Figure 5. By default, this table will present you with a number of details about the assumptions such as it’s reference, title, description, the user who created this assumption and it’s current state. If you click on the reference link of the listed assumption, you will navigate to that assumption’s view page.
From the Actions column of this assumptions table, you can act on individual assumption by 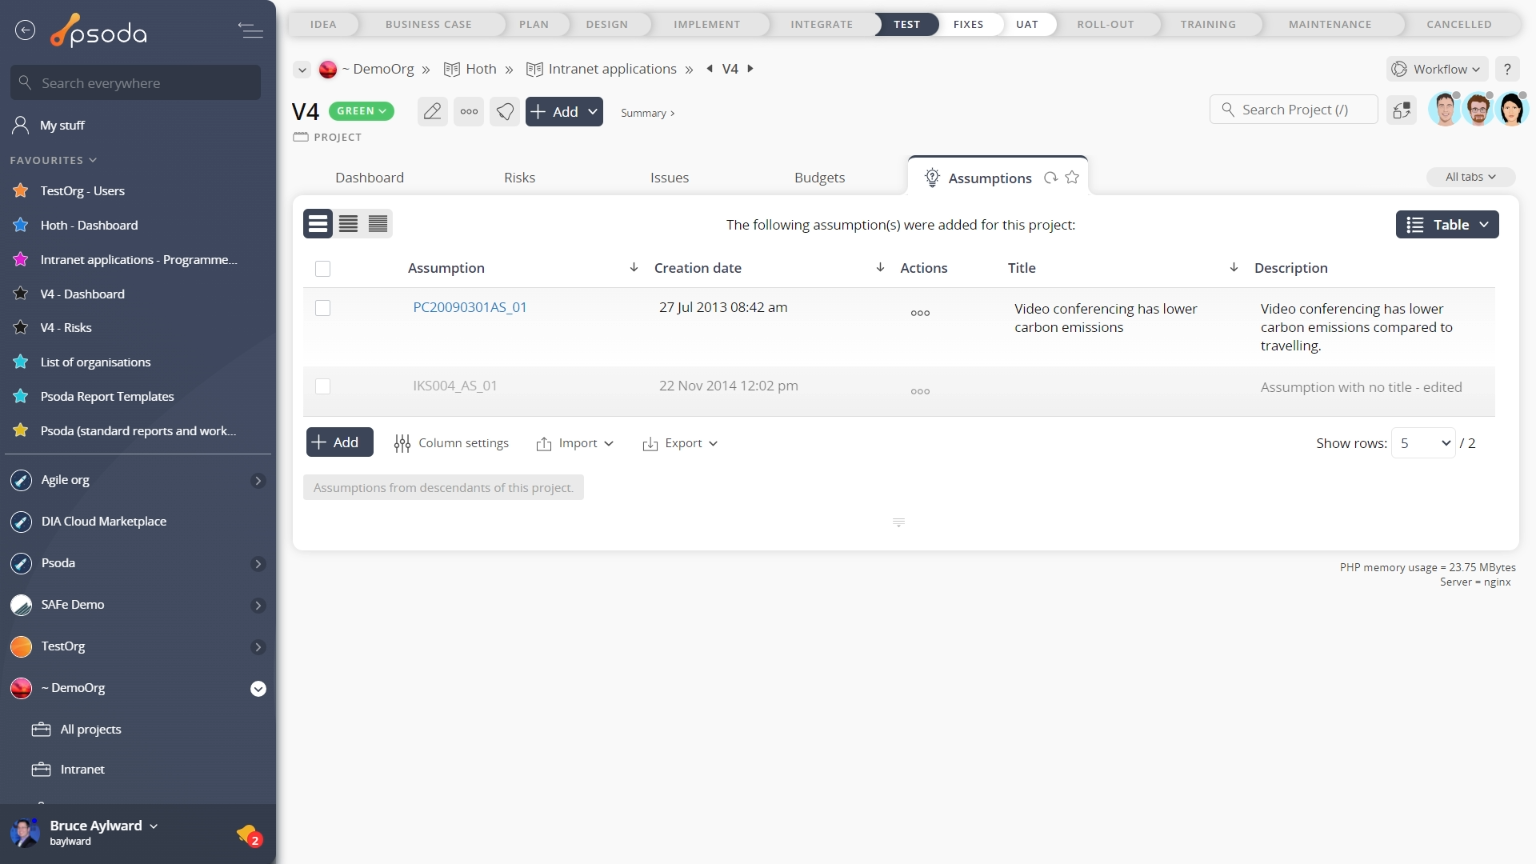
Figure 5 – Project assumptions tab
Note that you can customise your table view by clicking the Attachments
This tab shows an asset listing of all of the attachments that have been added to this project, as shown in Figure 6. By default, this table will present you with a number of details about the attachments such as the file’s name, attachment type, view the version and access a download link.
From the Actions column of this attachments table, you can act on individual attachments by 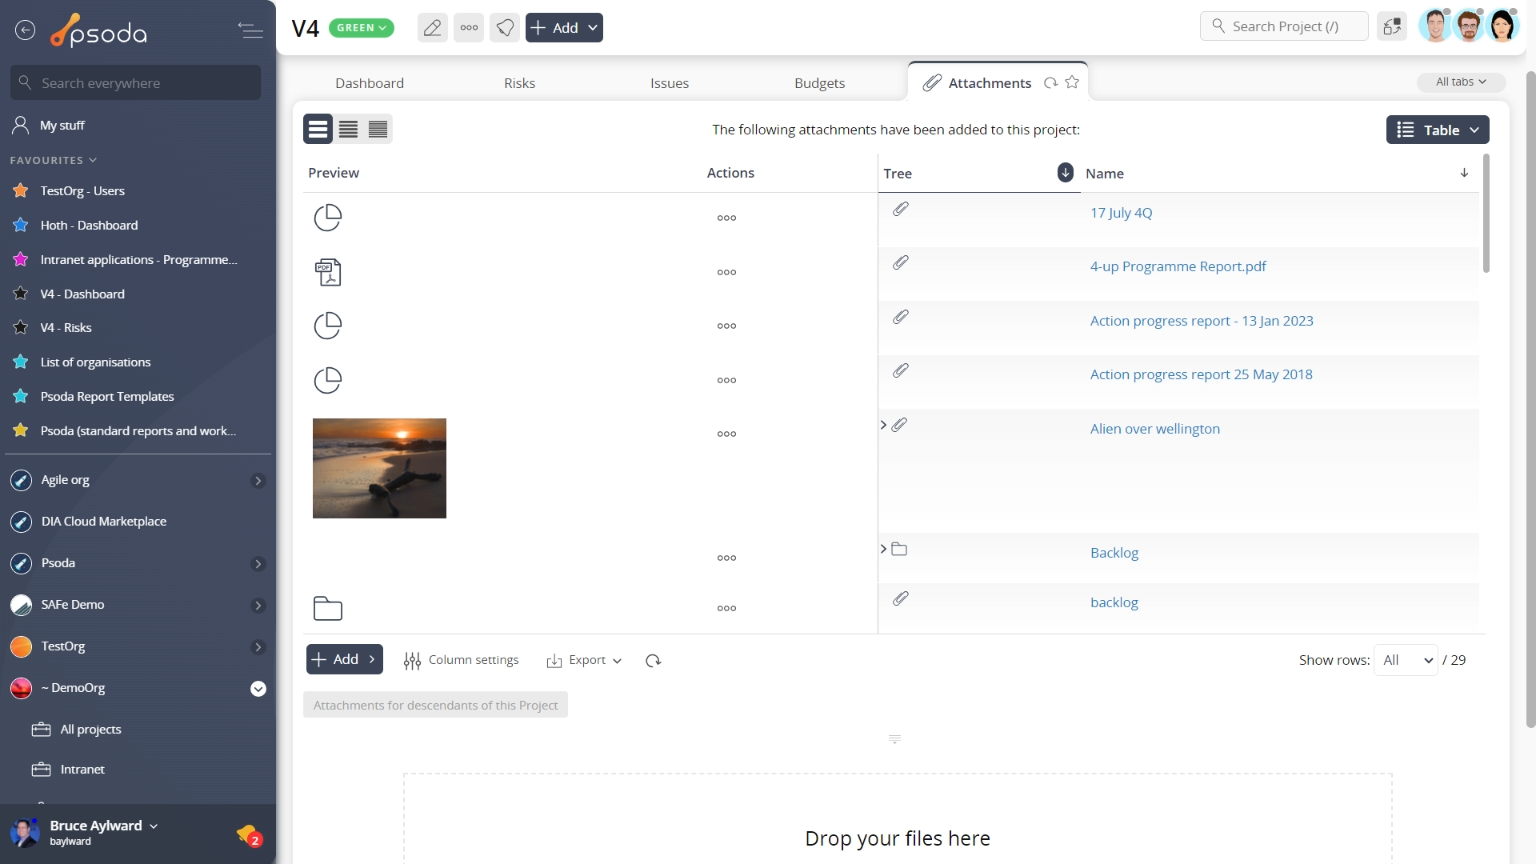
Figure 6 – Project attachments tab
Note that you can customise your table view by clicking the Benefits
This tab shows an asset listing of all of the benefits defined for this project, as shown in Figure 7. By default, this table provides measurement information about the benefits listed, it’s title and a progress indicator. From here you may also view the workflow 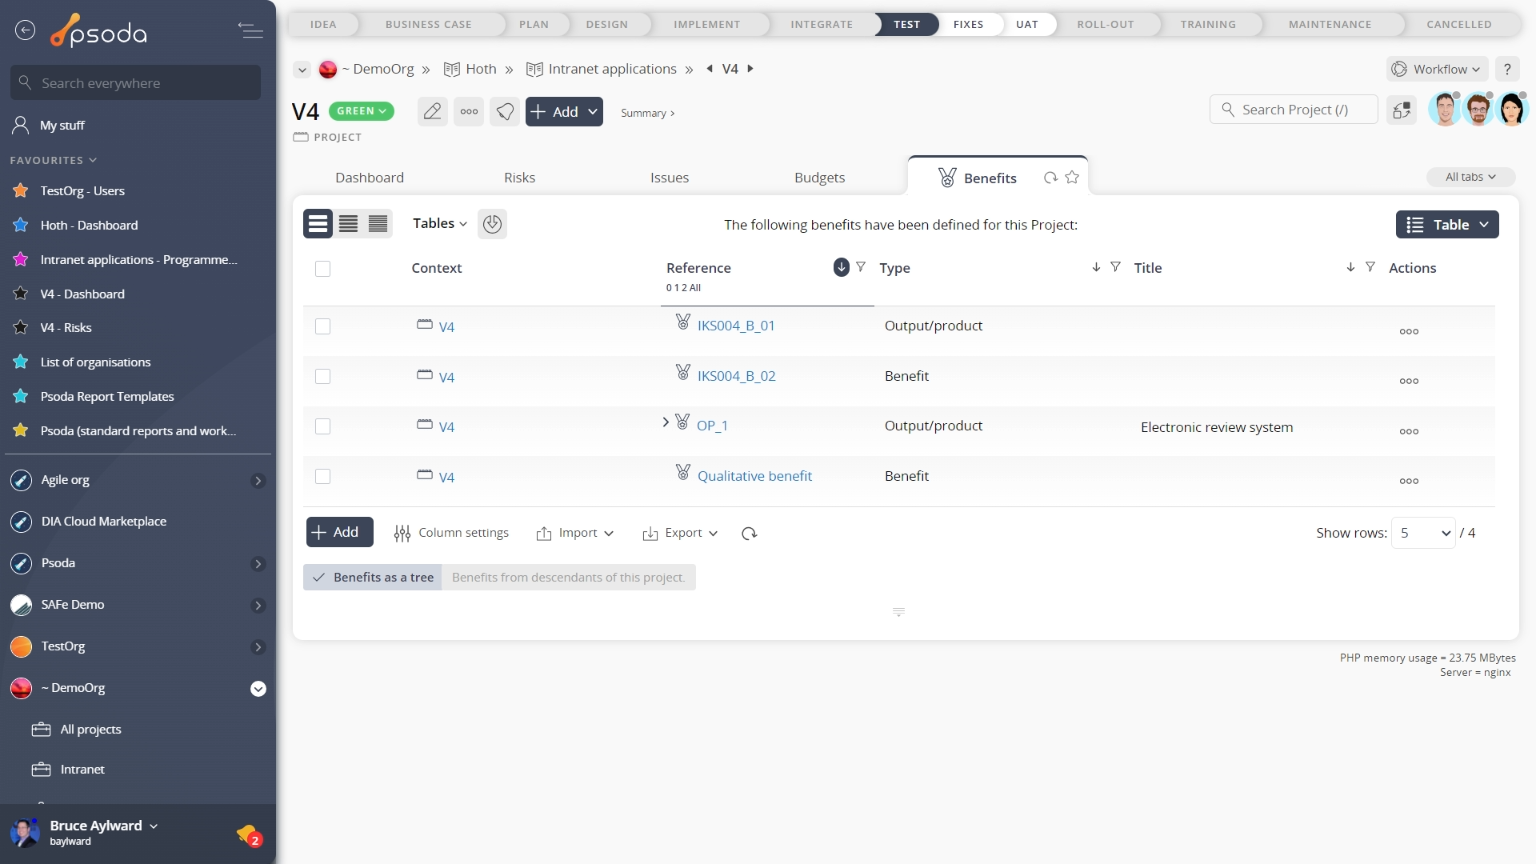
Figure 7 – Project benefits tab
Note that at the bottom of the table you can ![]() add more benefits, or customise your table view by clicking the
add more benefits, or customise your table view by clicking the ![]() edit button to show or hide certain benefit information, or export this benefit list to
edit button to show or hide certain benefit information, or export this benefit list to ![]() Excel or
Excel or ![]() CSV files.
CSV files.
 Benefit Map
Instead of a table view, this tab provides a graphical view of your benefits. The benefits map is generated from the information you put in the benefits table. Figure 8 below shows an example benefits map:
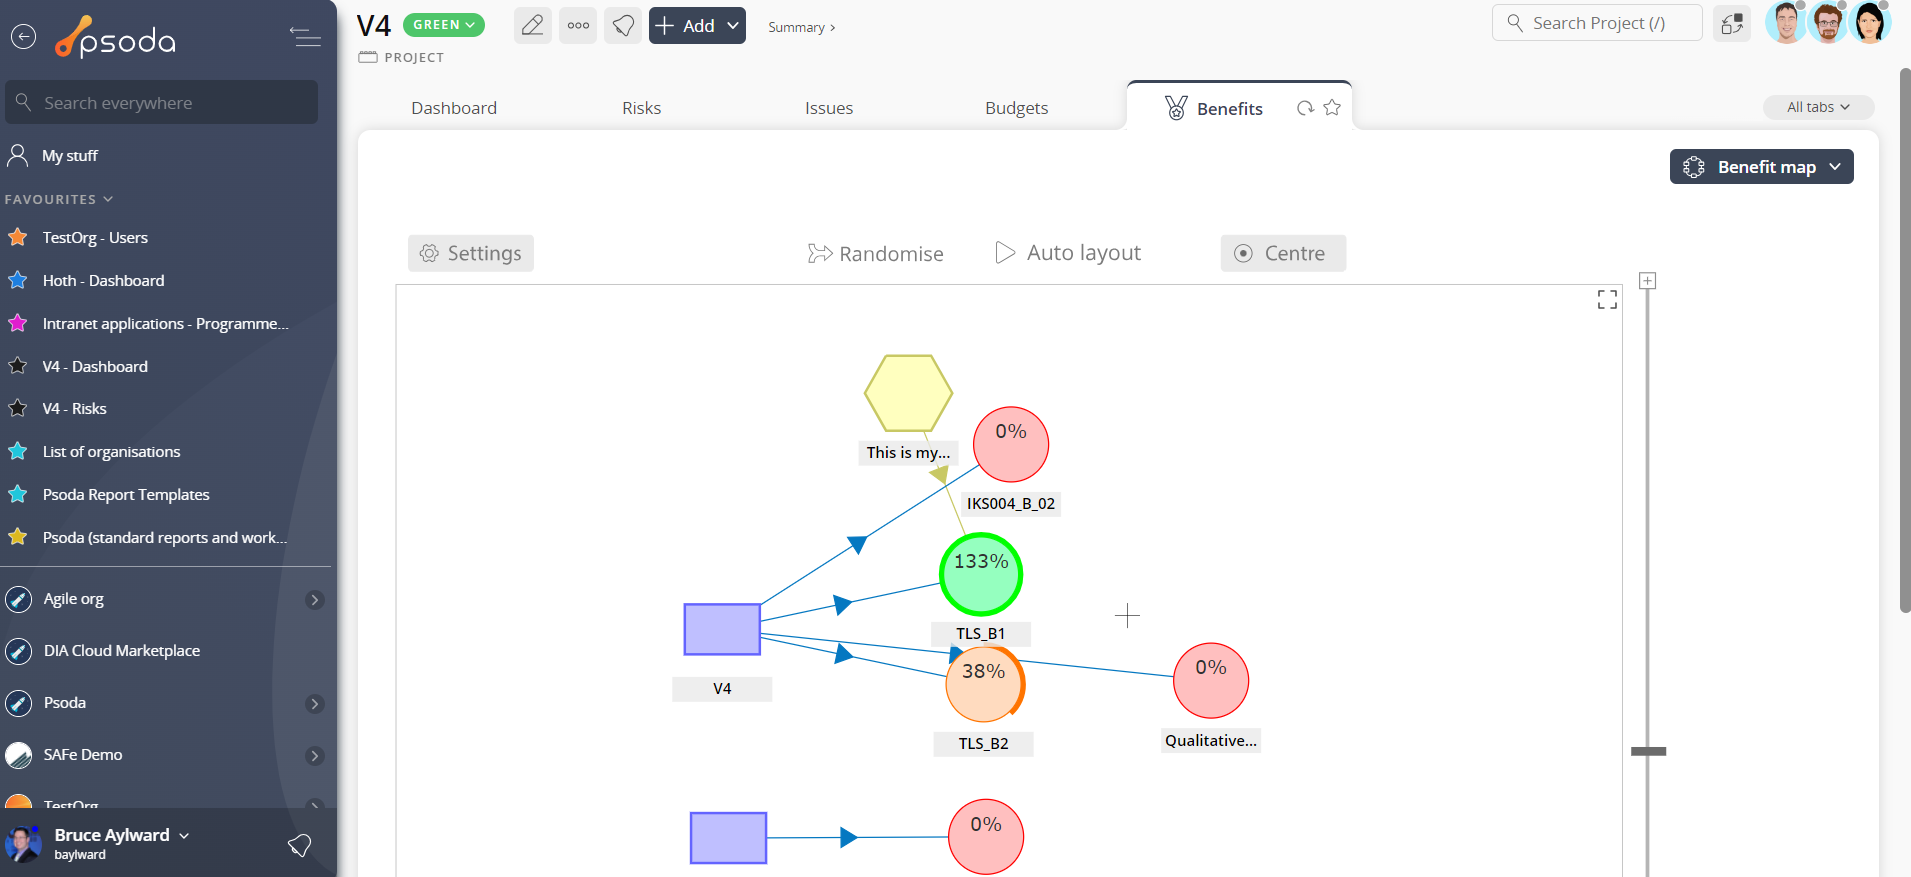 Figure 8 – Project benefit map
 Budgets
This tab shows an asset listing of all of the budget groups or budget items that have been added to this project, as shown in Figure 9. By default, this table shows the baseline and actual cost details for this budget or group, together with all of the budget items and sub-groups it contains.
From the Actions column of this attachments table, you can act on individual budget groups by 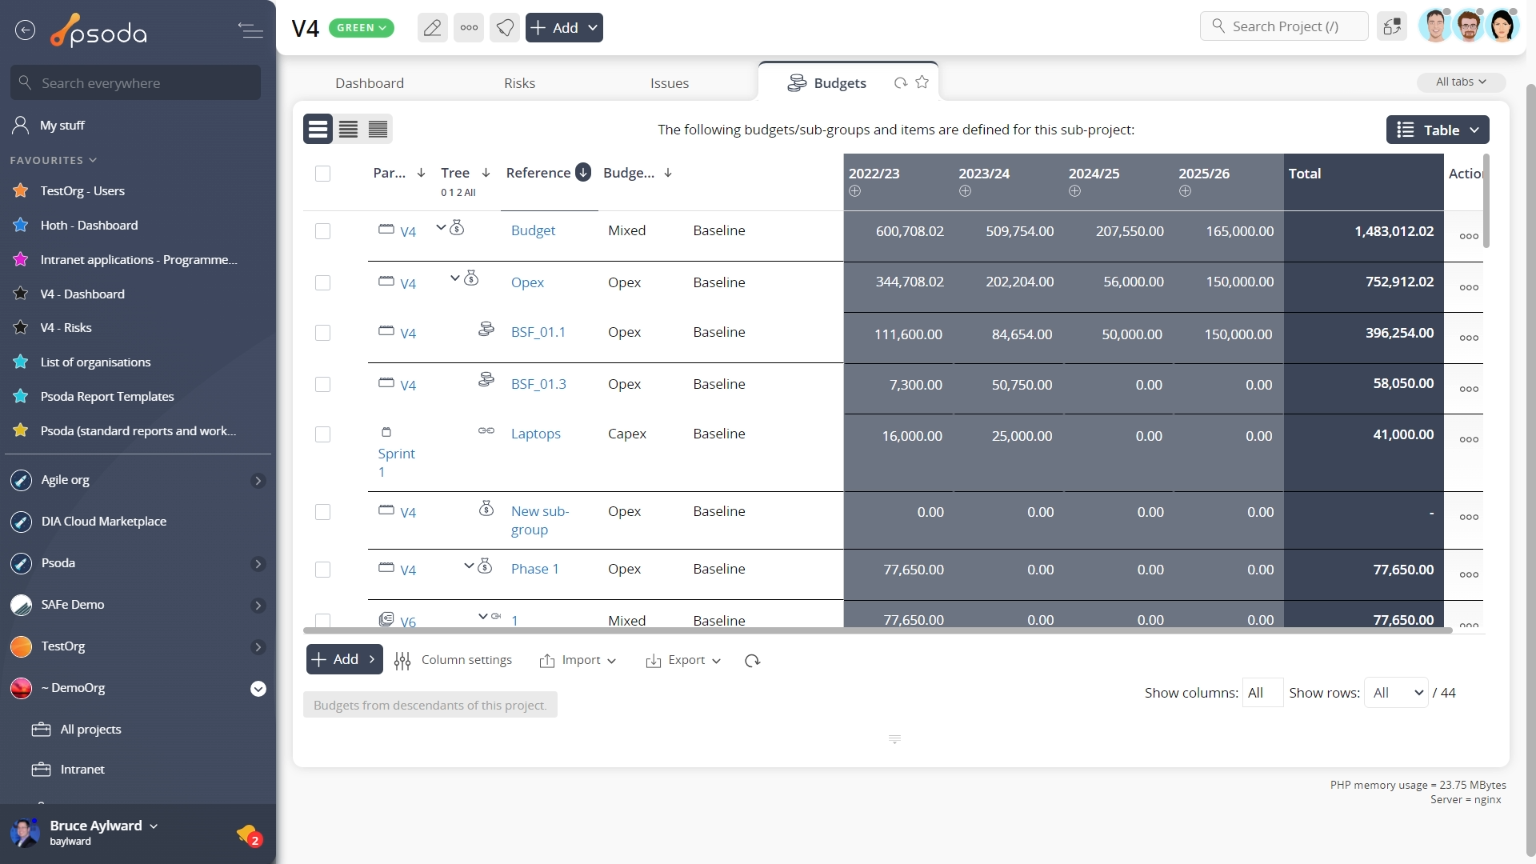
Figure 9 – Project budgets tab
Note that you can customise your table view by clicking the ![]() edit button at the bottom of the budget table or navigate to this same spot to
edit button at the bottom of the budget table or navigate to this same spot to ![]() add more budgets to this project, or
add more budgets to this project, or ![]() import a number of budgets from a CSV file. Here, you can also export this list to
import a number of budgets from a CSV file. Here, you can also export this list to ![]() Excel or
Excel or ![]() CSV files.
CSV files.
 Calendar
This tab shows a calendar view, as shown in Figure 10, of the 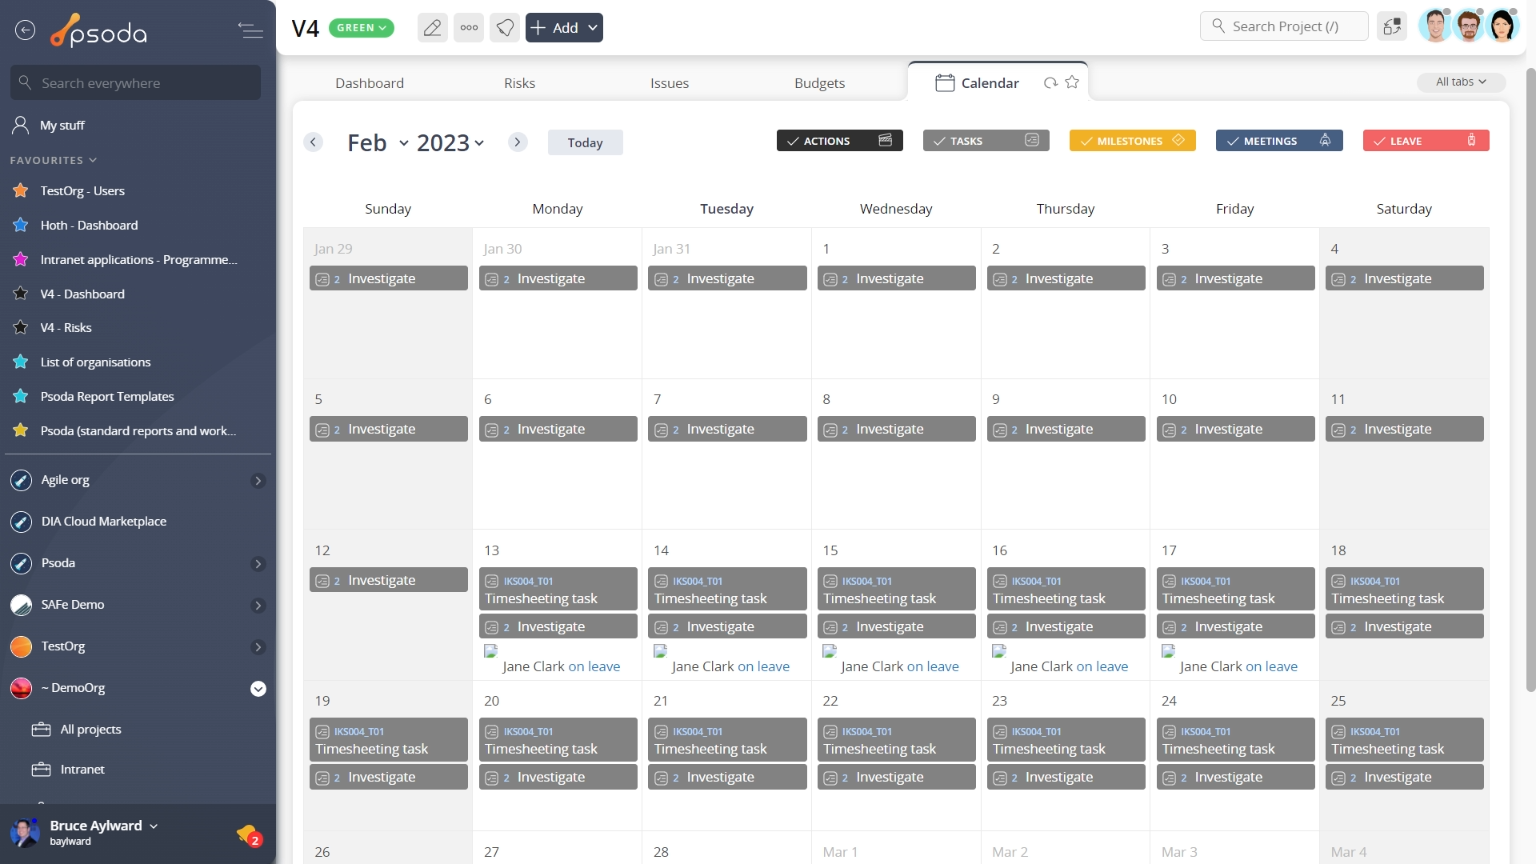
Figure 10 – Project calendar tab
You can adjust whether you which calendar week you want to view by selecting it in the calendar month on the left-hand side of the tab. You can also customise the layers that are views by selecting or de-selecting the listed layers options in this same location.
 Change requests
This tabbed view provides the change requests table, as shown in Figure 11, listing any change requests that have been added to this project.
By default you will be presented with the link to view the change request itself, title, category, description, scheduling information, the user who initiated this request, the owner of the request, it’s current state and any actions or workflow transitions that are available.
From this change request listing, you can utilise any of the functions in the Actions column to act on a specific request. These functions may include 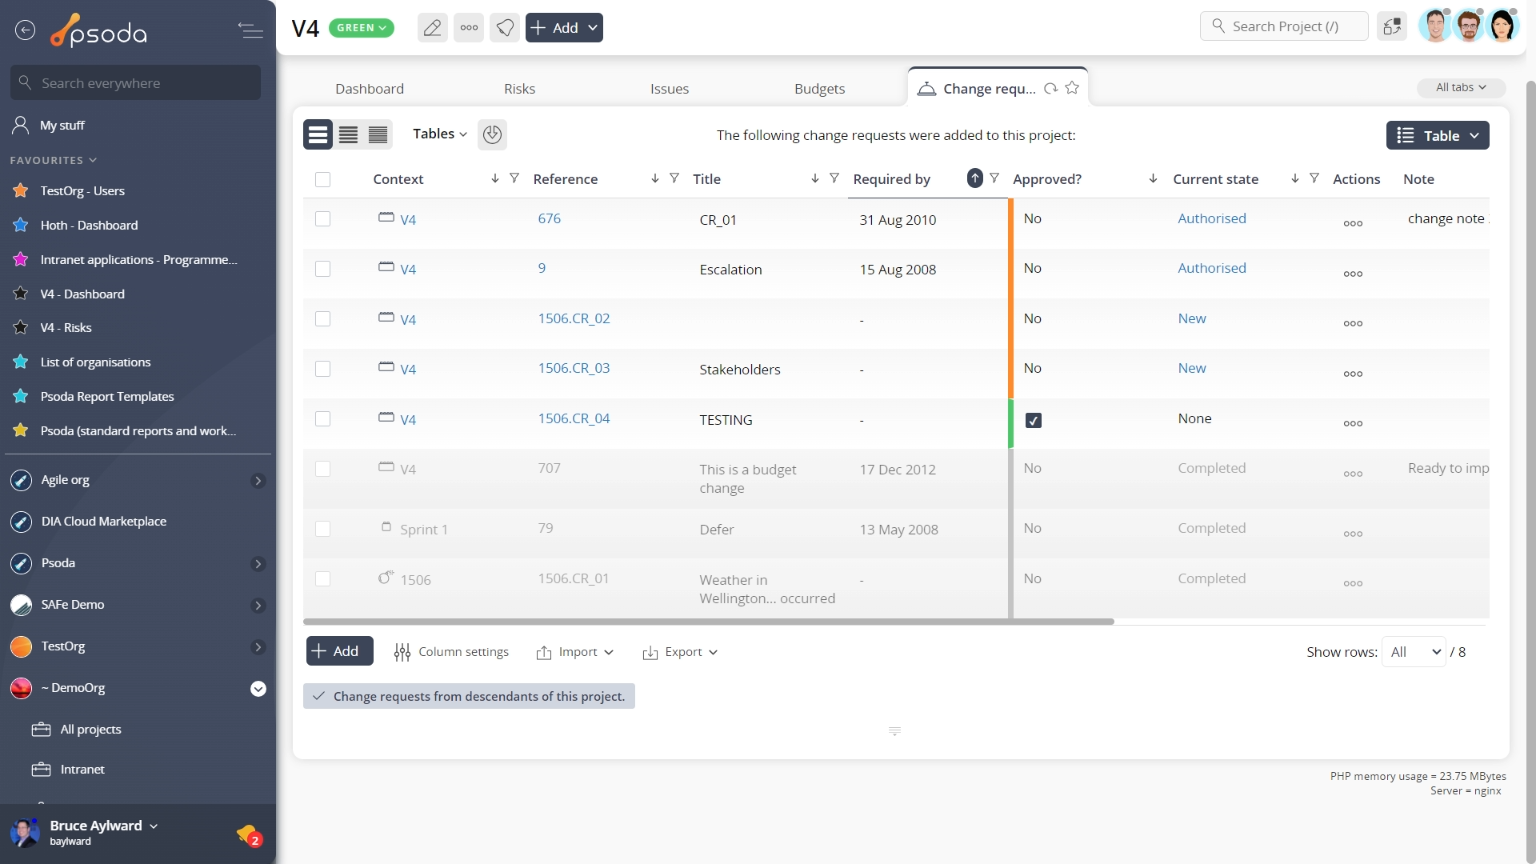 Figure 11 – Project change requests table
Note that at the bottom of the table you can ![]() add more change requests,
add more change requests, ![]() edit the table columns to show or hide request information, or export this list to
edit the table columns to show or hide request information, or export this list to ![]() Excel or
Excel or ![]() CSV files.
CSV files.
At the very bottom of this tabbed view you may decrease/increase the number of contracts listed by selecting the hide/include change requests for projects and sub-projects link.
Comments
This tab shows an asset listing of all of the comments that 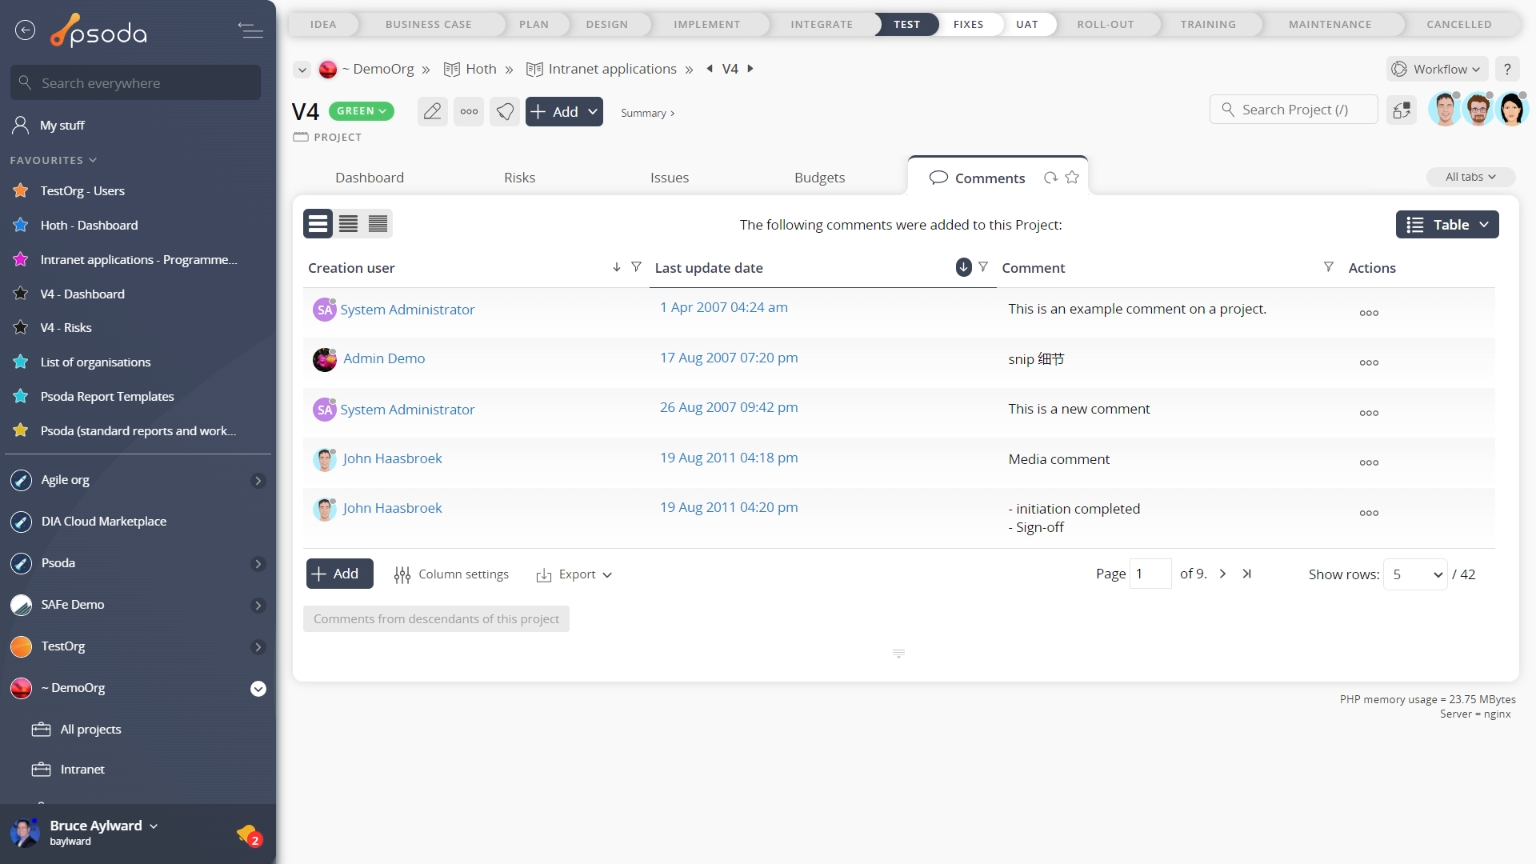
Figure 12 – Project comments tab
Note that you can customise your table view by clicking the Contracts
This tab shows an asset listing of all of the contracts that have been added to this project, as shown in Figure 13. By default, this table will present you with a number of details about the contracts such as it’s category, title, description, vendor, start, review and end dates, manager, any attachments or comments and the contract’s current state. If you select the link in the contract column, you will navigate into that contract’s view page.
From the Actions column of this contracts table, you can act on individual contracts by ![]() editing,
editing, ![]() deleting,
deleting, ![]() moving the contract or adding
moving the contract or adding ![]() comments or
comments or ![]() attachments to the chosen contract .
attachments to the chosen contract .
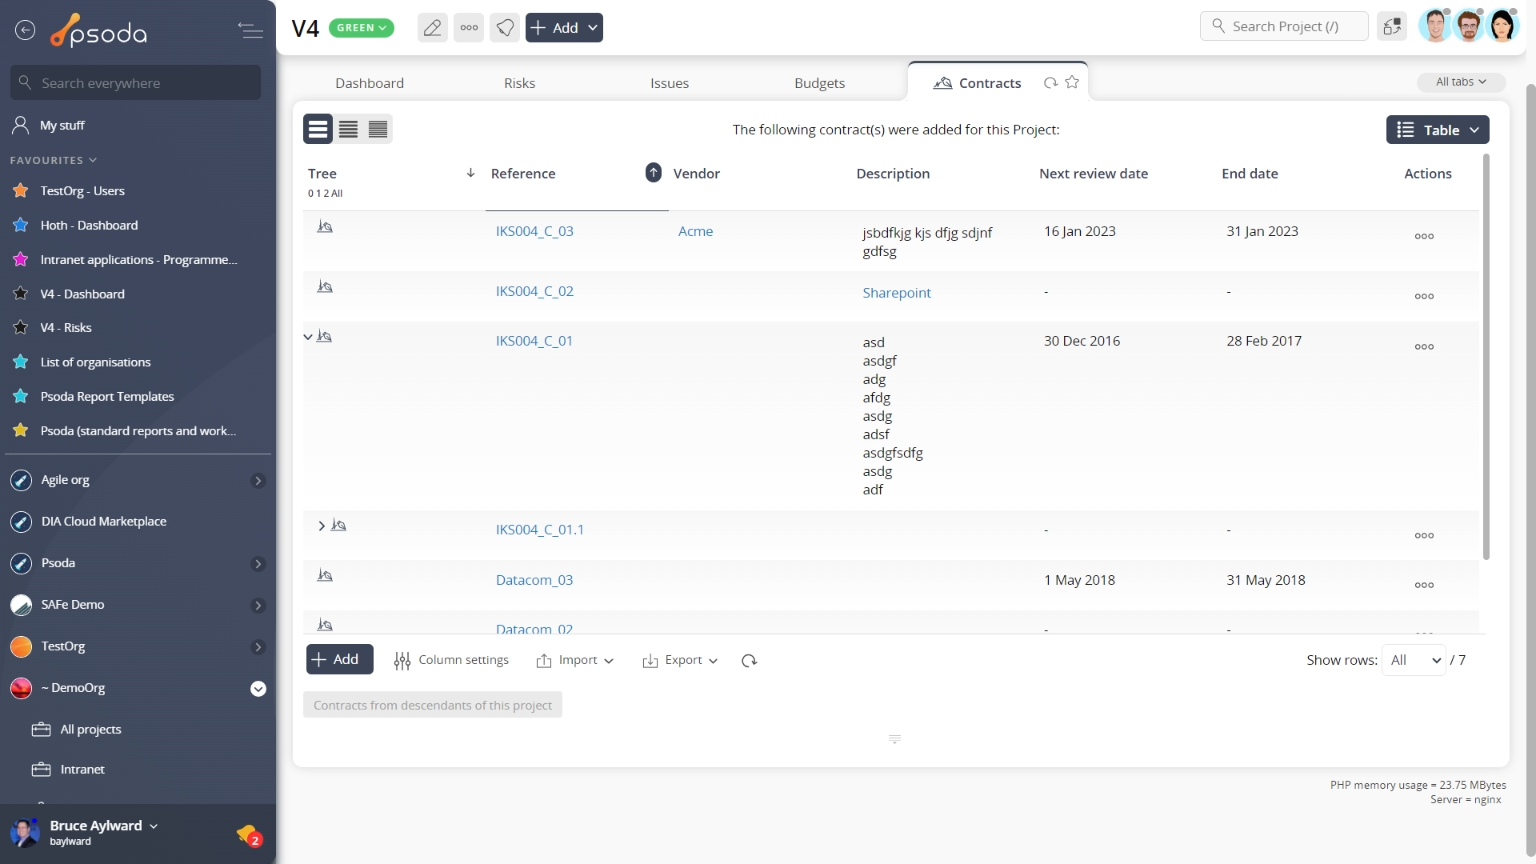
Figure 13 – Project contracts tab
Note that at the bottom of the table you can  Custom fields
This tab shows an asset listing of all of the custom fields that have been added to this project, as shown in Figure 15. By default, this table will present you with a number of details about the custom fields such as which section this custom field applies to, it’s title, description, codename and default value, to name a few. If you select the link in the title column, you will navigate into that custom field’s view page.
From the Actions column of this custom fields table, you can act on individual custom fields by 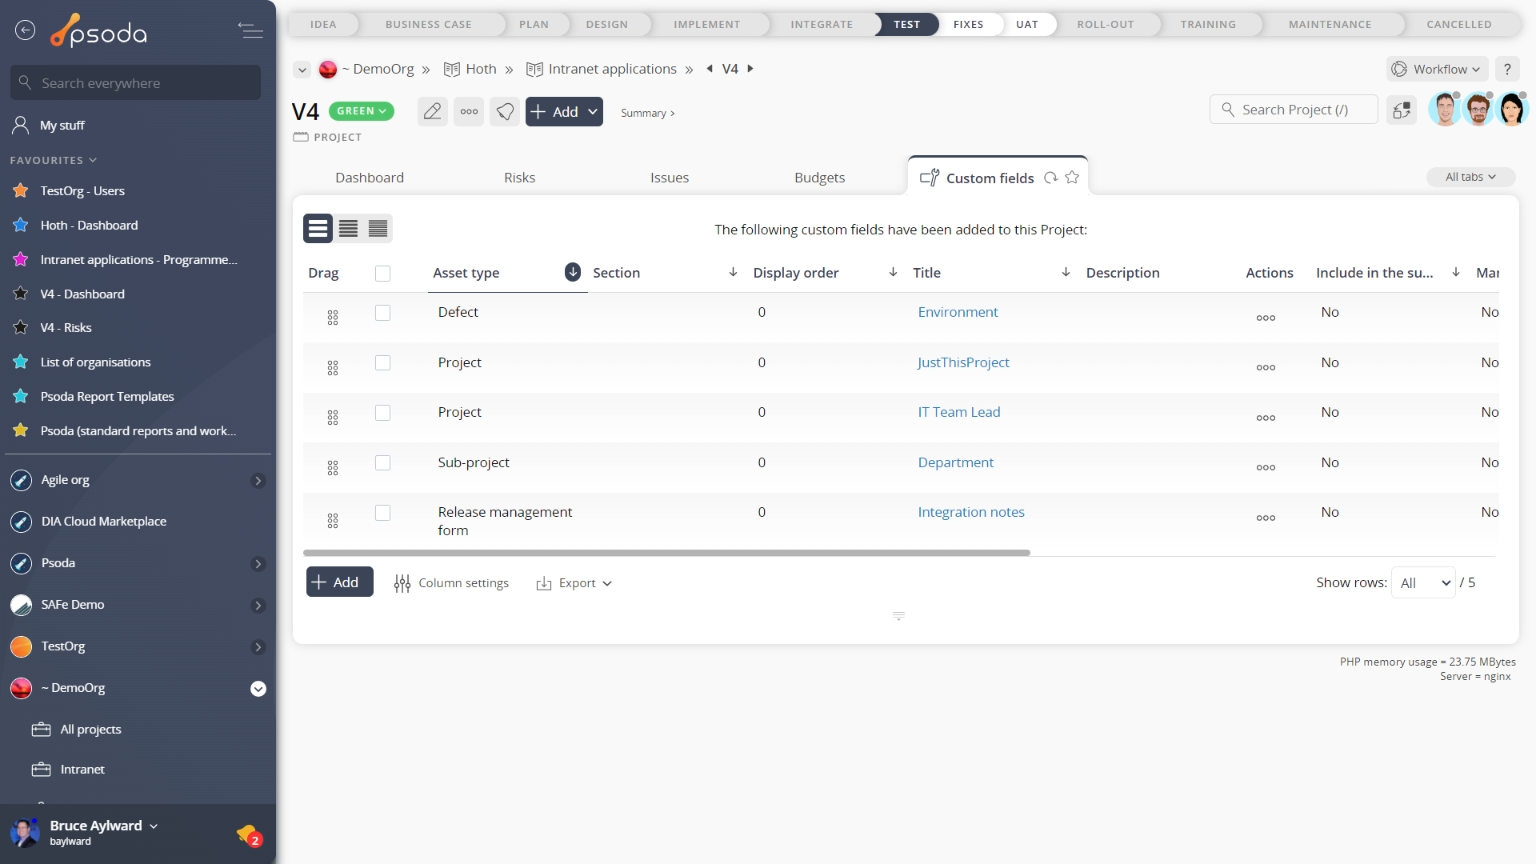
Figure 14 – Project custom fields tab
Note that at the bottom of the table you can ![]() add more custom fields, or customise your table view by clicking the
add more custom fields, or customise your table view by clicking the ![]() edit button to show or hide certain custom field information, or export this list to
edit button to show or hide certain custom field information, or export this list to ![]() Excel or
Excel or ![]() CSV files.
CSV files.
 Dashboard
This tabbed view will display a collection of customisable dashlets, related to the project you are currently viewing. In Figure 15 below, our “example project” has the Custom fields dashlet, Indicators dashlet and Open actions dashlet readily available, to show asset listings of the assets at this project level.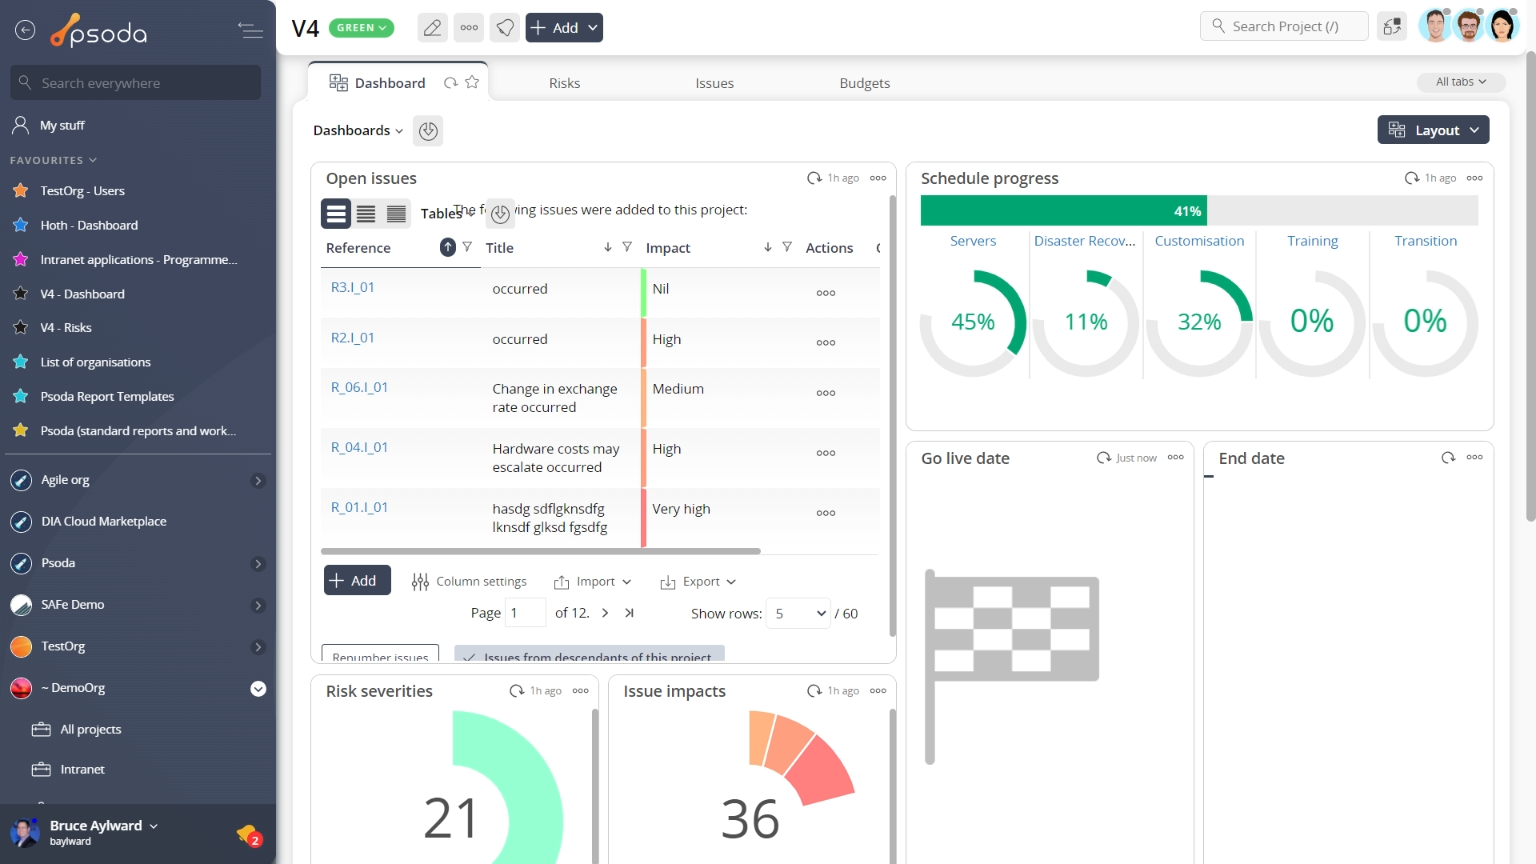
Figure 15 – Project dashboard tab
You can rearrange the order of you dashboard dashlets by utilising the drag-n-drop function, selecting the title of the dashlet to be moved and dragging it to it’s new position.
You may show or hide any dashlets that you need at a given point in time by selecting the ![]() Customise dashboard link at the very bottom of this tabbed view.
Customise dashboard link at the very bottom of this tabbed view.
 Decisions
This tab shows an asset listing of all of the decisions that have been added to this project, as shown in Figure 16. By default, this table will present you with a number of details about the decisions such as it’s context, title, description, user’s who agreed to it and it’s current state, to name a few. If you select the link in the decision column, you will navigate into that decision’s view page.
From the Actions column of this custom fields table, you can act on individual custom fields by 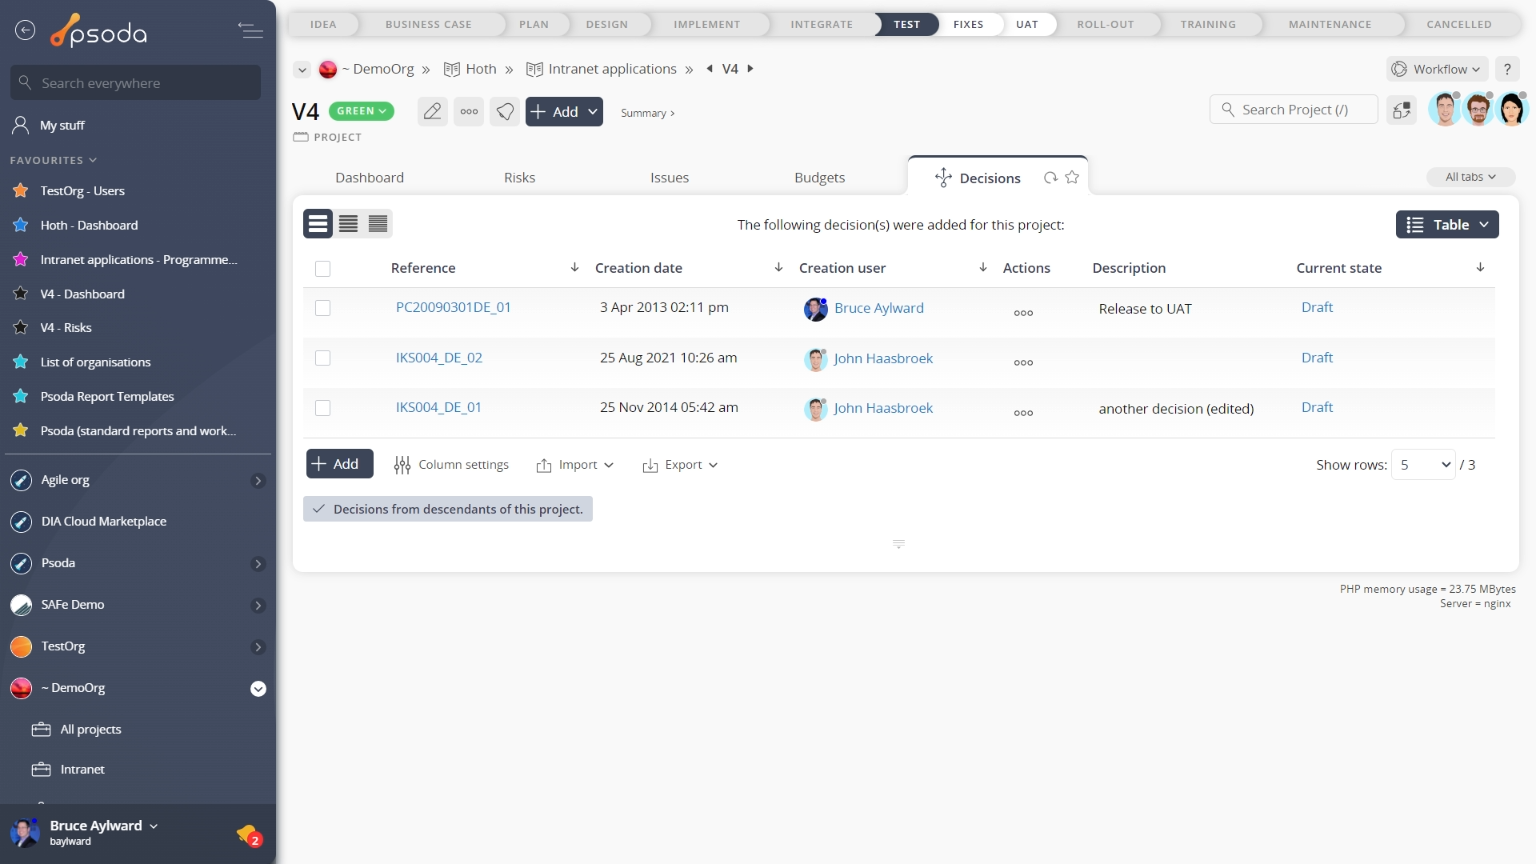
Figure 16 – Project decisions tab
Note that at the bottom of the table you can ![]() add more decisions manually or
add more decisions manually or ![]() import multiple from a CSV file, or customise your table view by clicking the
import multiple from a CSV file, or customise your table view by clicking the ![]() edit button to show or hide certain information. From here you can also export this list to
edit button to show or hide certain information. From here you can also export this list to ![]() Excel or
Excel or ![]() CSV files.
CSV files.
Defects
This tab shows an asset listing of all of the defects that have been logged for this project, as shown in Figure 17. By default, this table will present you with a number of details about the defects such as the defect’s number, type, title, severity, priority, current state, date raised, resolve by date and which user this defect is allocated to, to name a few details.
From the Actions column of this defects table, you can act on individual defects by 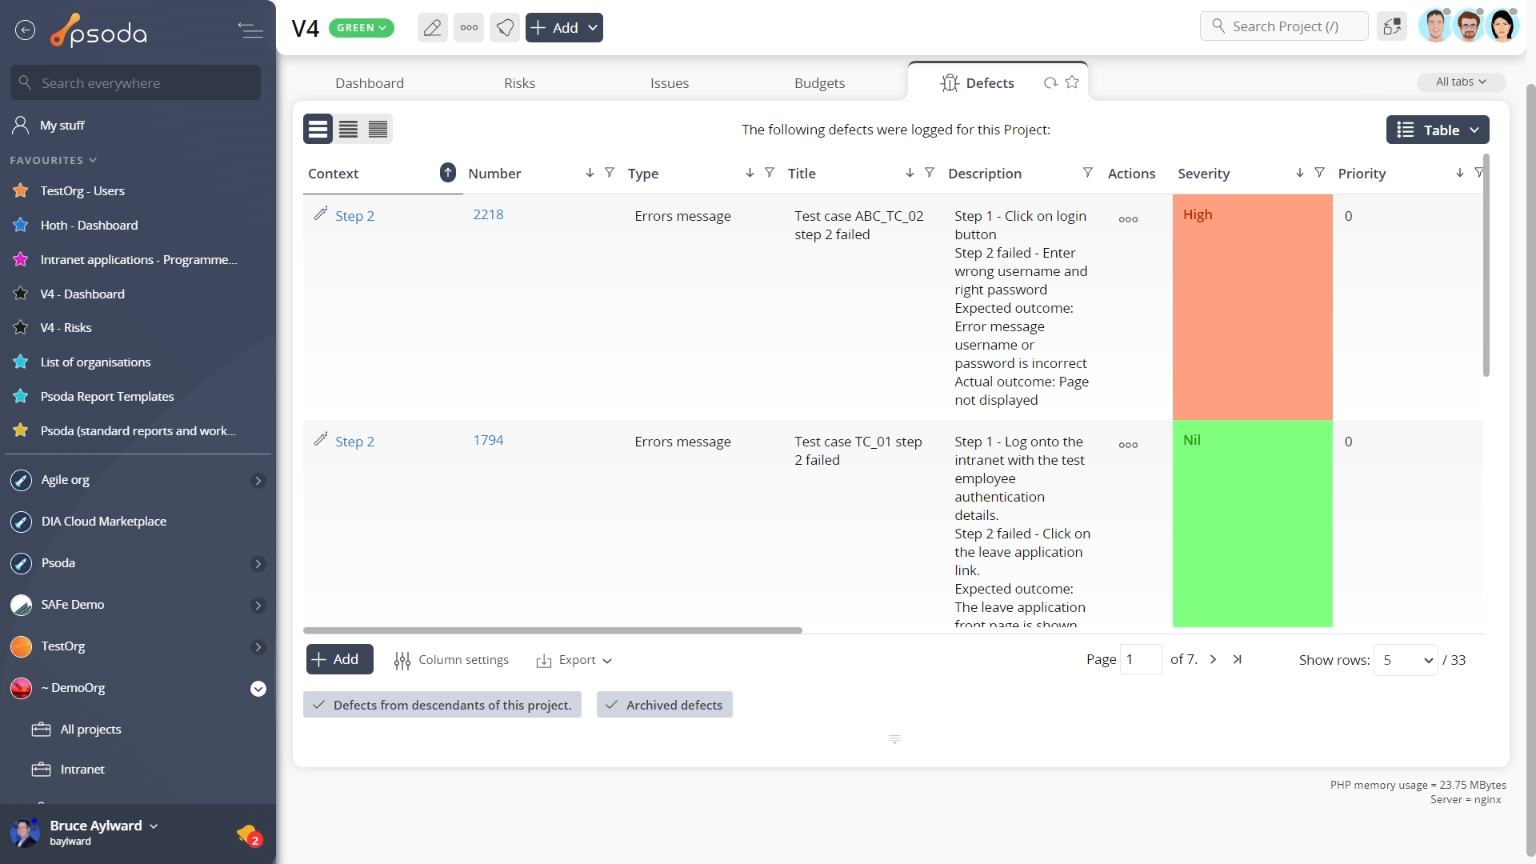
Figure 17 – Project defects tab
Note that you can customise your table view by clicking the ![]() edit button at the bottom of the defect table. Here, you can also export this list to
edit button at the bottom of the defect table. Here, you can also export this list to ![]() Excel or
Excel or ![]() CSV files.
CSV files.
At the very bottom of this tab you may also be presented with the option to decrease/increase the number of defects listed by selecting the hide/include defects for children of this folder or hide/include archived defects links.
Defects overview
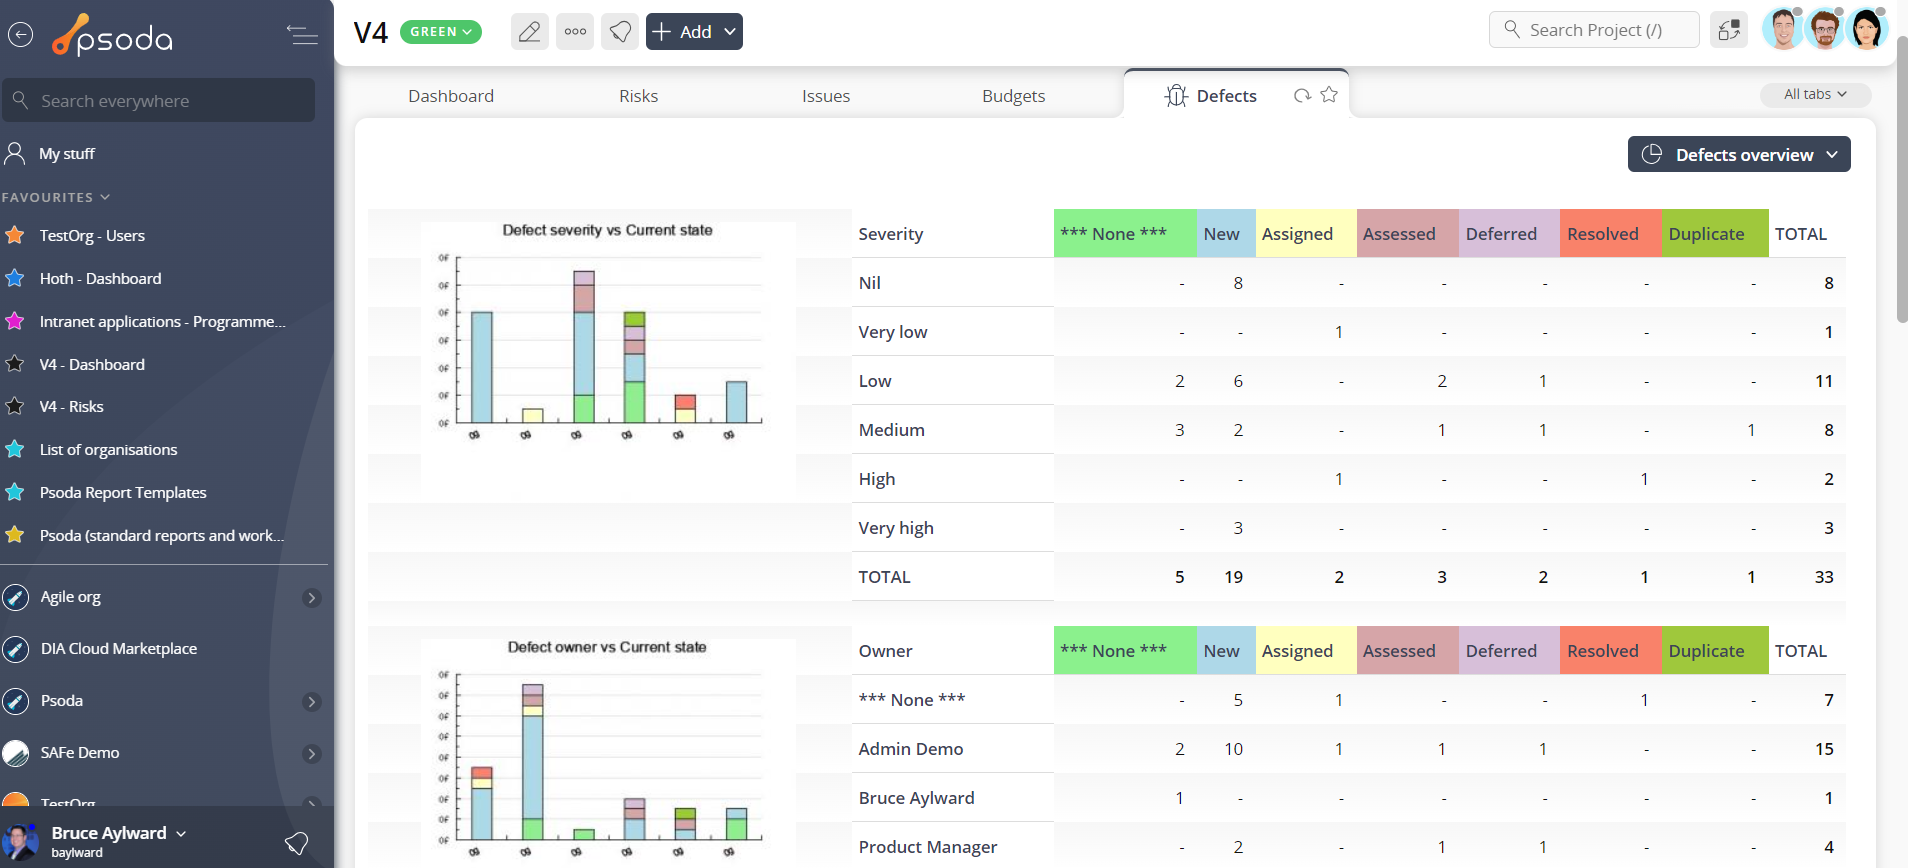
Figure 18 – Project defects overview tab
Instead of a table view, this tab provides a graphical view of your defects by presenting a number of graphs grouping defects by certain categories, as shown in Figure 18. The defects overview charts are generated by information in the defects tab.
 Deleted assets
This tab shows an asset listing of all of the assets that 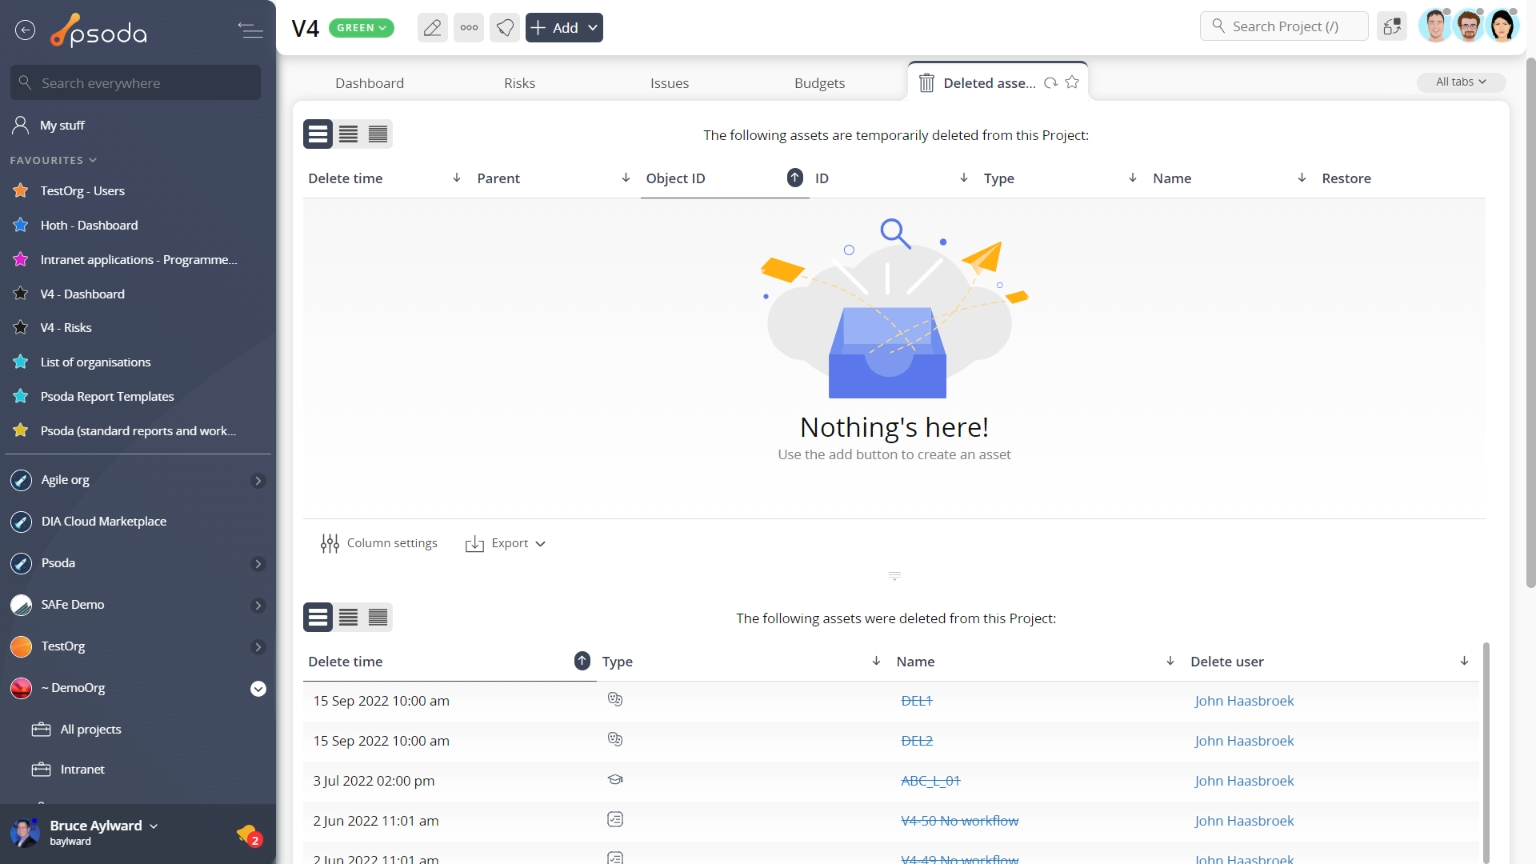
Figure 19 – Project deleted assets tab
Note that you can customise your table view by clicking the ![]() edit button at the bottom of the tables. Here, you can also export the list to
edit button at the bottom of the tables. Here, you can also export the list to ![]() Excel or
Excel or ![]() CSV files.
CSV files.
Dependencies
This tab shows an asset listing of all of the dependencies that have been defined for this project, as shown in Figure 20. By default, this table will present you with a number of details about the dependencies such as the it’s description, impact and change flags. If you click the link under the dependent column, you will navigate into the selected dependent’s view page.
From the Actions column of this dependencies table, you can act on individual dependencies by 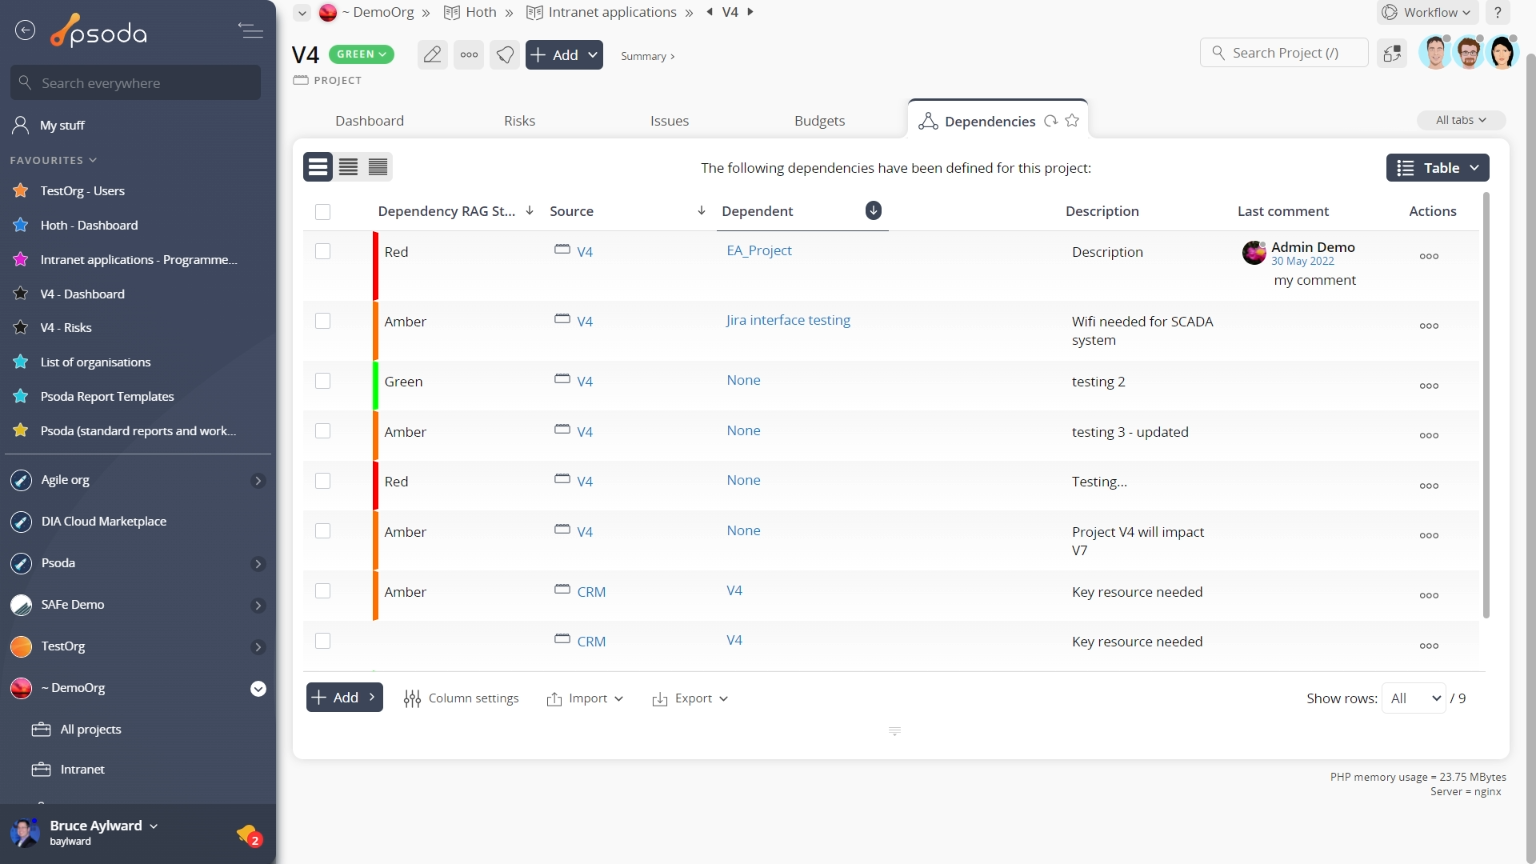
Figure 20 – Project dependencies tab
Note that at the bottom of the table you can ![]() add more dependencies manually or
add more dependencies manually or ![]() import multiple from a CSV file, or customise your table view by clicking the
import multiple from a CSV file, or customise your table view by clicking the ![]() edit button to show or hide certain information. From here you can also export this list to
edit button to show or hide certain information. From here you can also export this list to ![]() Excel or
Excel or ![]() CSV files.
CSV files.
 Details
This tab shows the details for the selected project including visual presentations of number of risks, issues and defects, the project’s description, code, and other scheduling information in radar charts, as seen in Figure 21.
Figure 21 – Project details tab
You will be presented with a number of details such as the scheduling and estimate information, some fields may allow for inline editing although these permissions may be linked to your access rights. If you feel that you should have access to some of these permissions, contact your System Administrator.
 Evaluations
This tab shows an asset listing of all of the evaluations that have been added to this project, as shown in Figure 22. By default, this table will present you with a number of details about the evaluations such as the it’s title and description. If you click the title of an evaluation, you will navigate into the selected evaluation’s view page.
From the Actions column of this evaluations table, you can act on individual evaluations by 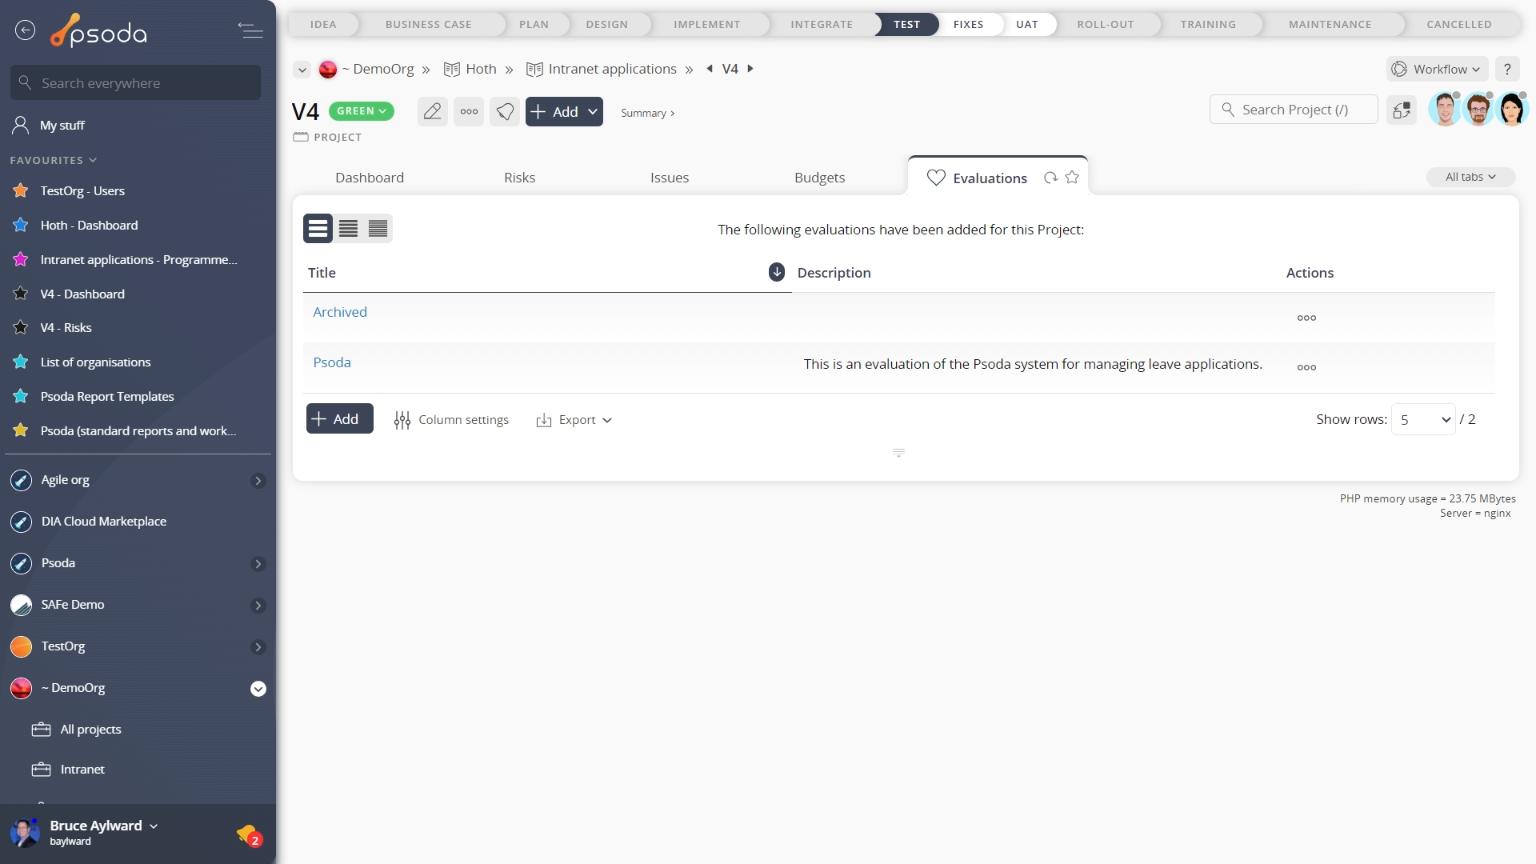
Figure 22 – Project evaluations tab
Note that you can customise your table view by clicking the ![]() edit button at the bottom of the evaluations table or navigate to this same spot to
edit button at the bottom of the evaluations table or navigate to this same spot to ![]() add more evaluations to this project. Here, you can also export this list to
add more evaluations to this project. Here, you can also export this list to ![]() Excel or
Excel or ![]() CSV files.
CSV files.
 Exceptions
This tab shows an asset listing of all of the exceptions that have been added to this project, as shown in Figure 23. By default, this table shows the exception’s title, description and consequences, as well as any recommendations and who created the exception. If you click on the link in the reference column, you will navigate into the selected exception’s view page.
From the Actions column of this exceptions table, you can act on individual exceptions by 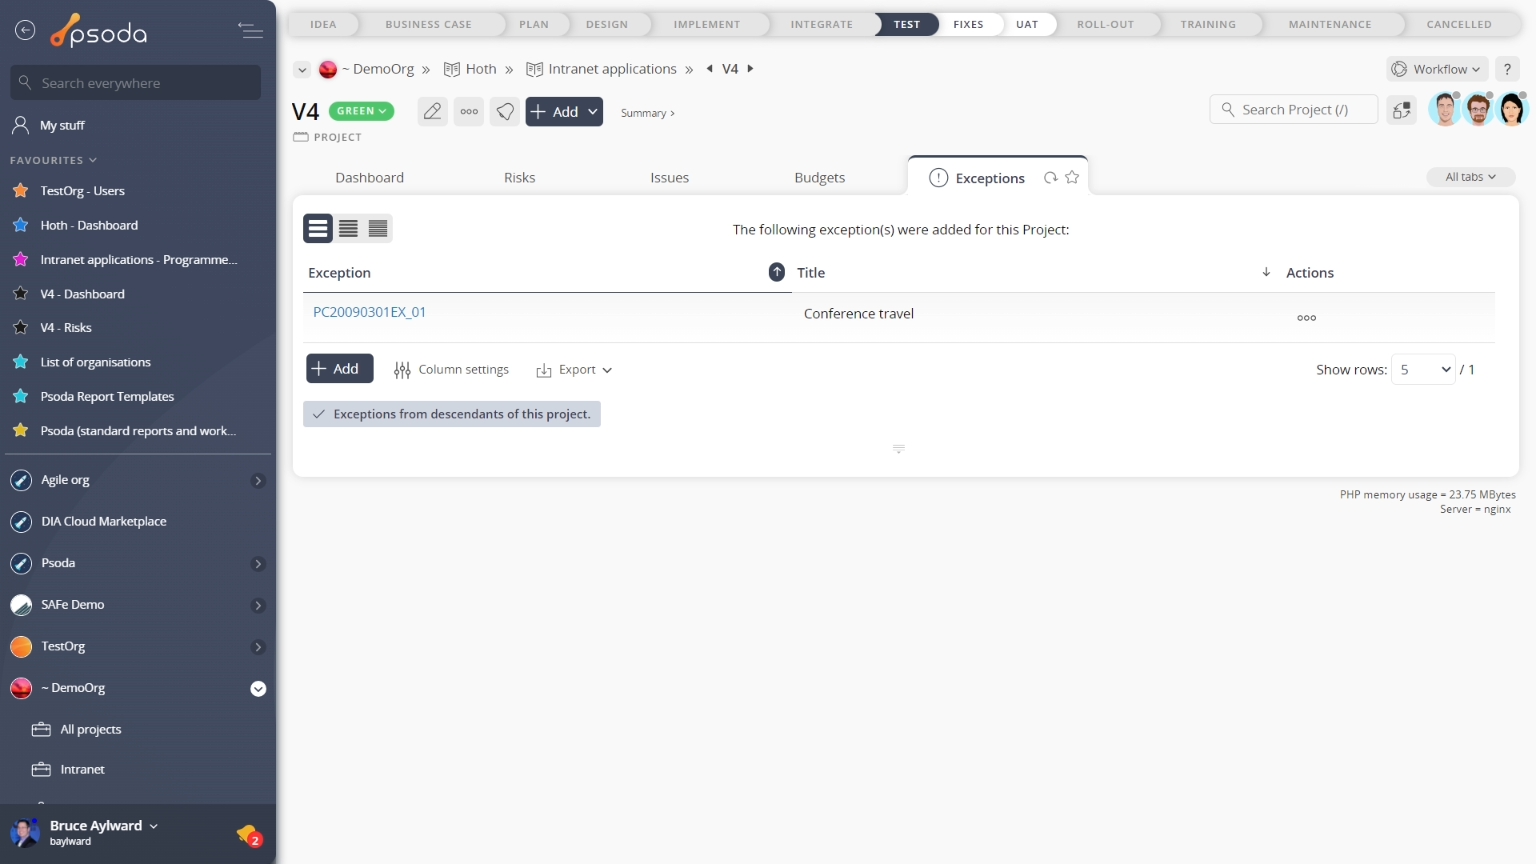
Figure 23 – Project exceptions tab
Note that you can customise your table view by clicking the ![]() edit button at the bottom of the exceptions table or navigate to this same spot to
edit button at the bottom of the exceptions table or navigate to this same spot to ![]() add more exceptions to this project. Here, you can also export this list to
add more exceptions to this project. Here, you can also export this list to ![]() Excel or
Excel or ![]() CSV files.
CSV files.
Expenses
This tab an asset listing of all of the expenses logged for this project, as shown in Figure 24. By default, this table shows the budget item that this expense item is associated with, the reference, description, date, date of payment as well amount including and excluding tax information. The number of comments and attachments added to an expense item is also indicated in this view.
The Actions column of the expenses table provides accessible functions to act on a chosen expense item. These functions include 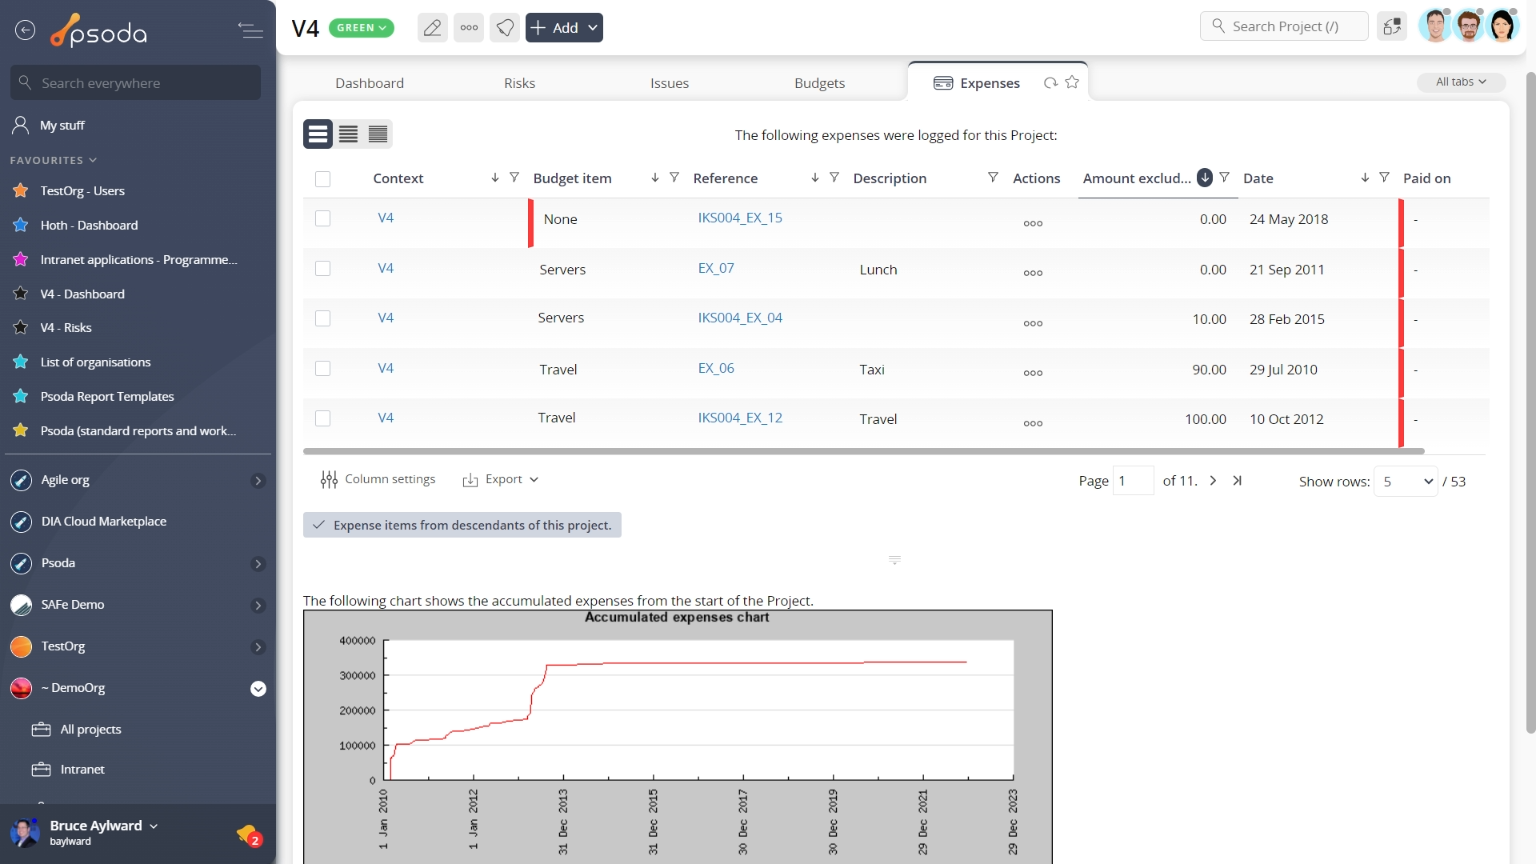 Figure 24 – Project expenses tab
A chart at the bottom of this tabbed view will also visually show you the accumulated expenses from the start of this project.
Note that you can customise your table view by clicking the ![]() edit button at the bottom of the expenses table or navigate to this same spot to
edit button at the bottom of the expenses table or navigate to this same spot to ![]() add more expense items to this project manually, or you can
add more expense items to this project manually, or you can ![]() import multiple expenses from a CSV file. Here, you can also export this list to
import multiple expenses from a CSV file. Here, you can also export this list to ![]() Excel or
Excel or ![]() CSV files.
CSV files.
 GANTT
GANTT
This tabbed view shows the GANTT chart shown in Figure 25, generated by the information in your Schedule tab. By default, this table shows the name of the task group, task or milestone and it’s start and end dates.
On the right-most side of the chart there is a breakdown of tasks in a visual format than will span across a monthly, weekly or daily scale (this is setting dependent). The users who are allocated to each asset will have their names written next to this asset’s timeline.
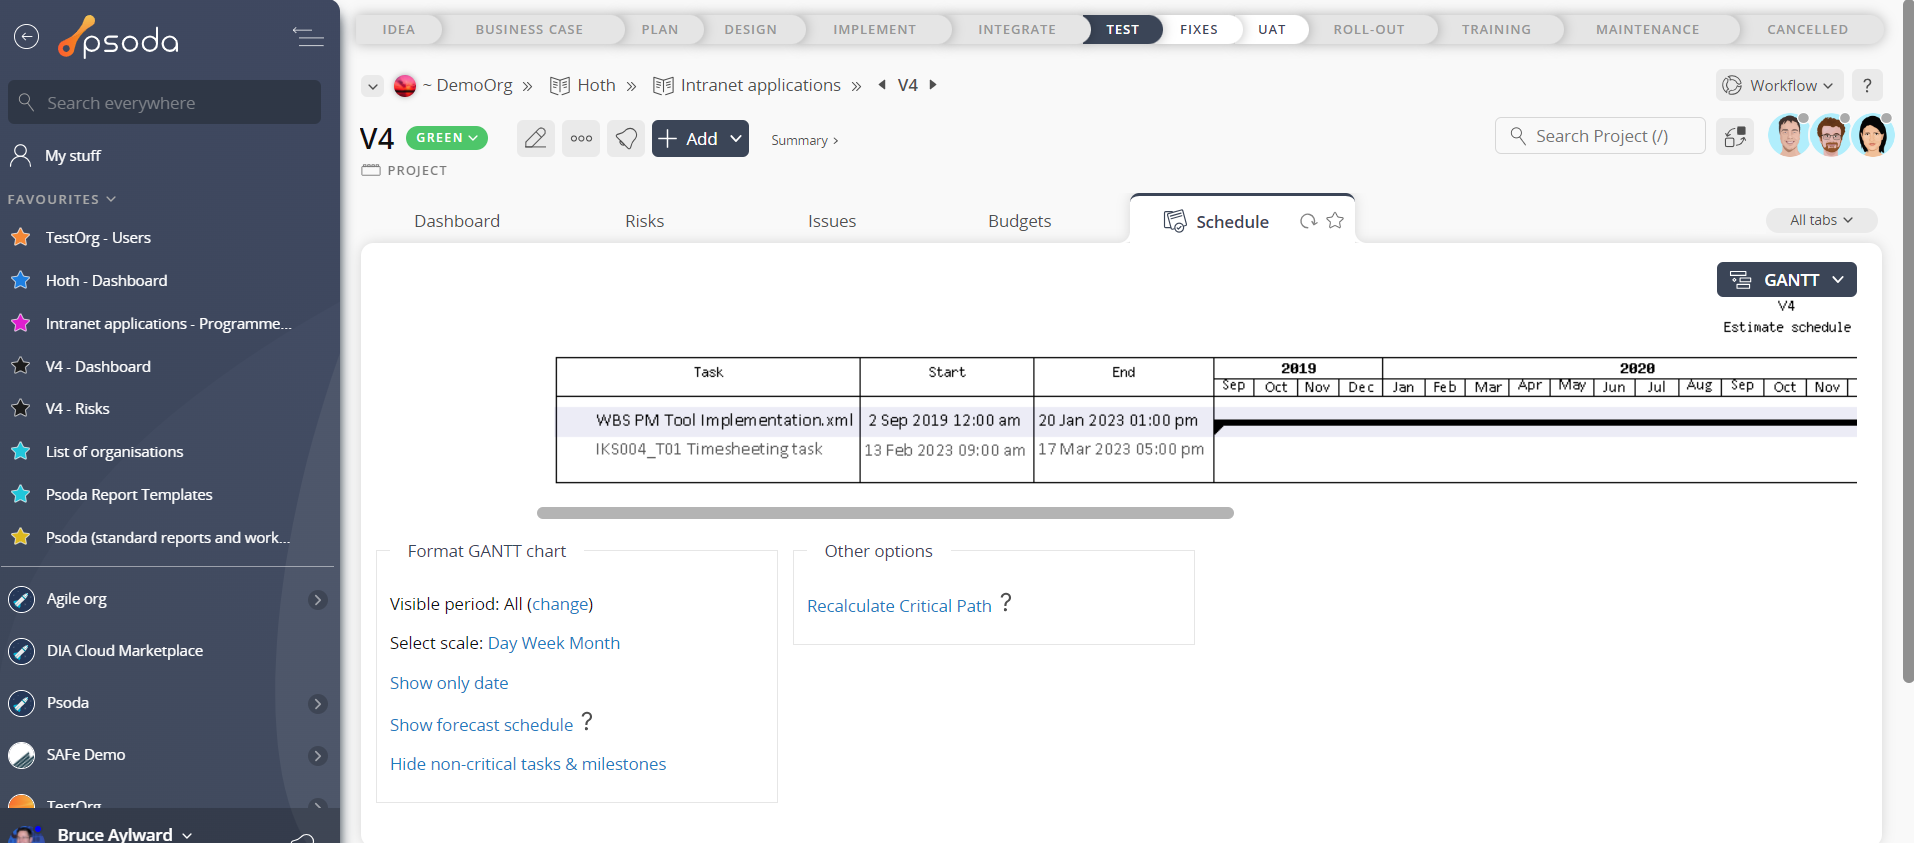
Figure 25 – Project GANTT chart
At the very bottom of this tabbed view you are presented with a number of table information formatting options which will adjust the GANTT’s visible period, or scale, or whether it displays more than just task dates.In addition, the view tasks & milestones link will navigate to the Schedule tabbed view so that you can expand or contract the work breakdown structure viewed in the GANTT.
 History
This tab shows shows some basic history of the project, as shown in Figure 26. By default, this tab will present you with a number of details about the project’s history such as the creation date, creation user, last update date and last update user. If the project has been changed then this section will also show a table of all the changes that has been made, including the date of each change, the field changed, the value before the change and the user who made the change.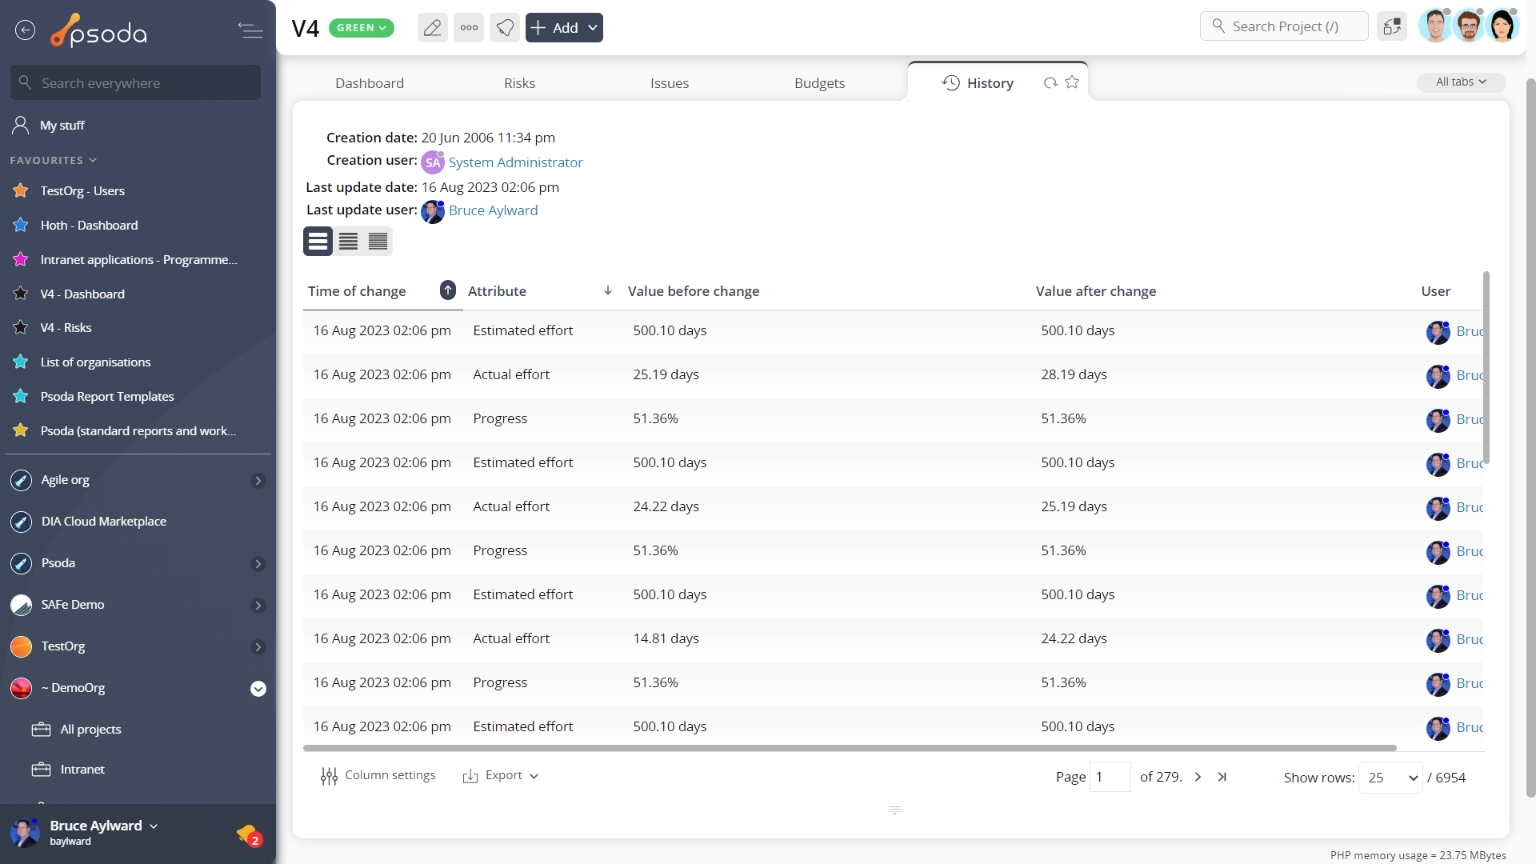
Figure 26 – Project history tab
Note that you can customise your change table view by clicking the ![]() edit button at the bottom of the change table. Here, you can also export this list of changes to
edit button at the bottom of the change table. Here, you can also export this list of changes to ![]() Excel or
Excel or ![]() CSV files.
CSV files.
Interactive GANTT
This tab shows the interactive GANTT chart shown in Figure 27, generated by the information in your Schedule tab of the change request. By default, this table shows the name of the task group, task or milestone and it’s start and end dates.
On the right-most side of the chart we have a breakdown of tasks in a visual format than will span across a monthly, weekly or daily scale (this is setting dependant). The users who are allocated to each asset will have their names written next to this asset’s timeline.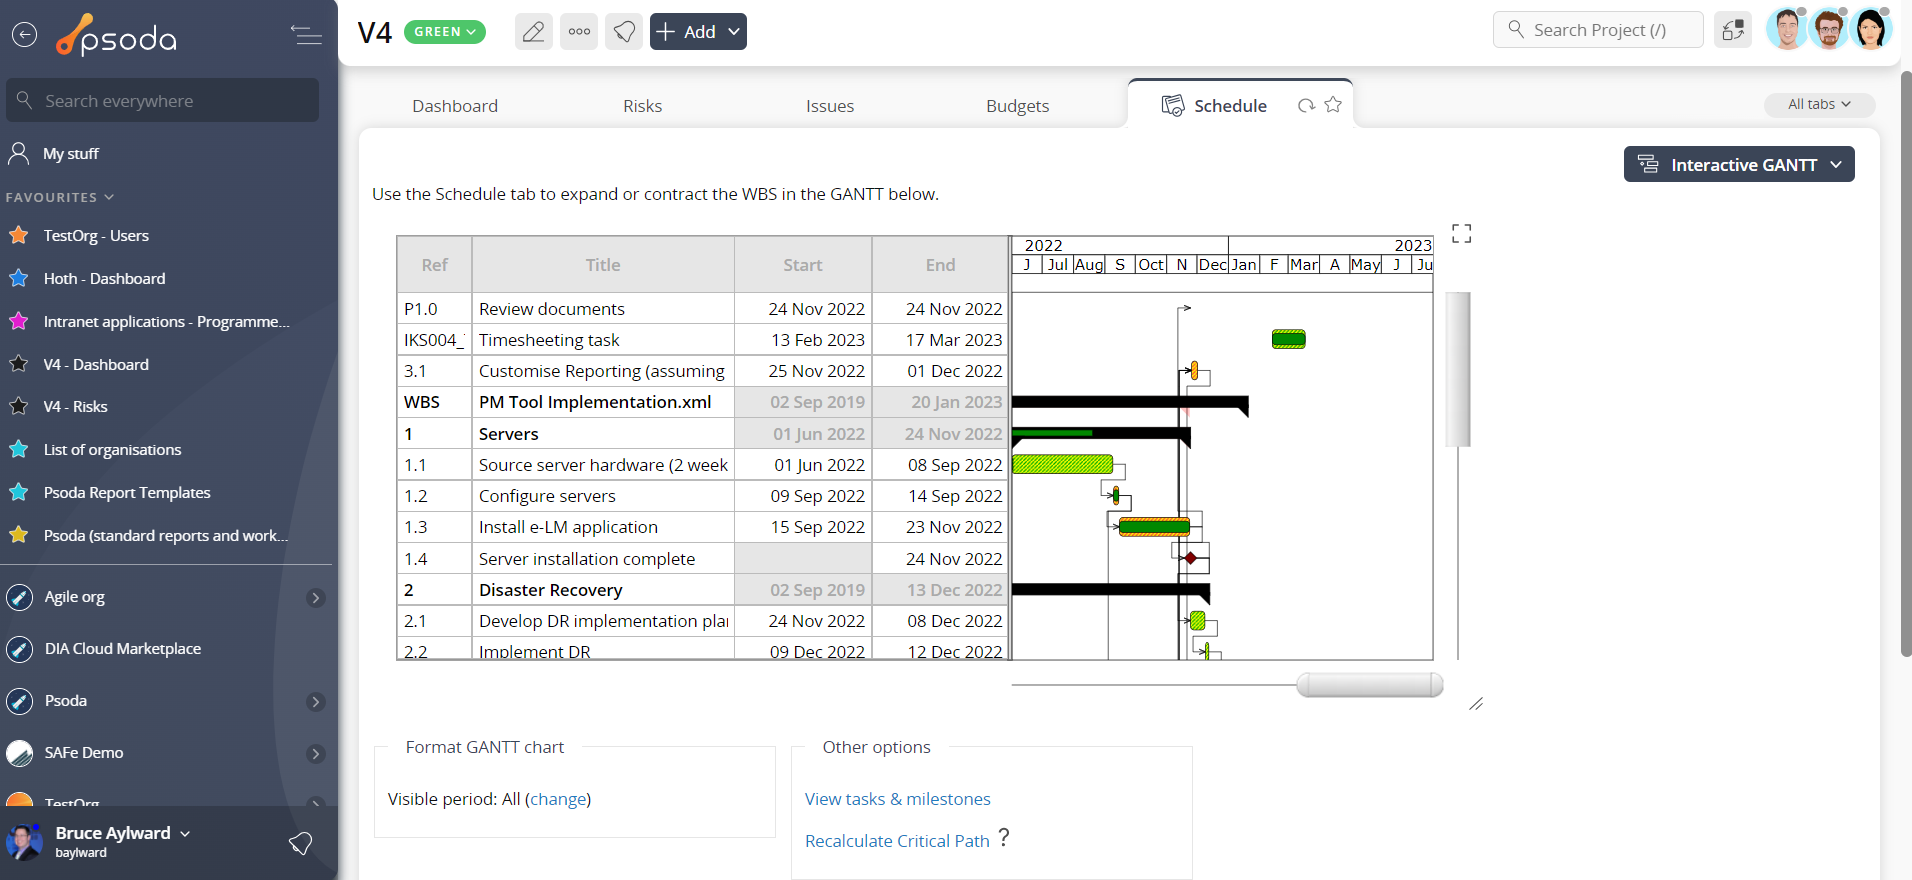
Figure 27 – Project interactive GANTT tab
At the very bottom of this tabbed view you are presented with a number of table information formatting options which will adjust the GANTT’s visible period, or scale, or whether it displays more than just task dates.In addition, the view tasks & milestones link will navigate to the Schedule tab so that you can expand or contract the work breakdown structure viewed in the GANTT.
 Issues
This tabbed view shows the issues table as seen in Figure 28, listing any issues that have been logged for this project. By default, this table provides impact and priority information, plan progress and resolution dates for the issues listed, as well as any actions that can be taken. The workflow column also provides information as to the next workflow transitions available.
The Actions column of the issues table provides accessible functions to act on a chosen issue. These functions include 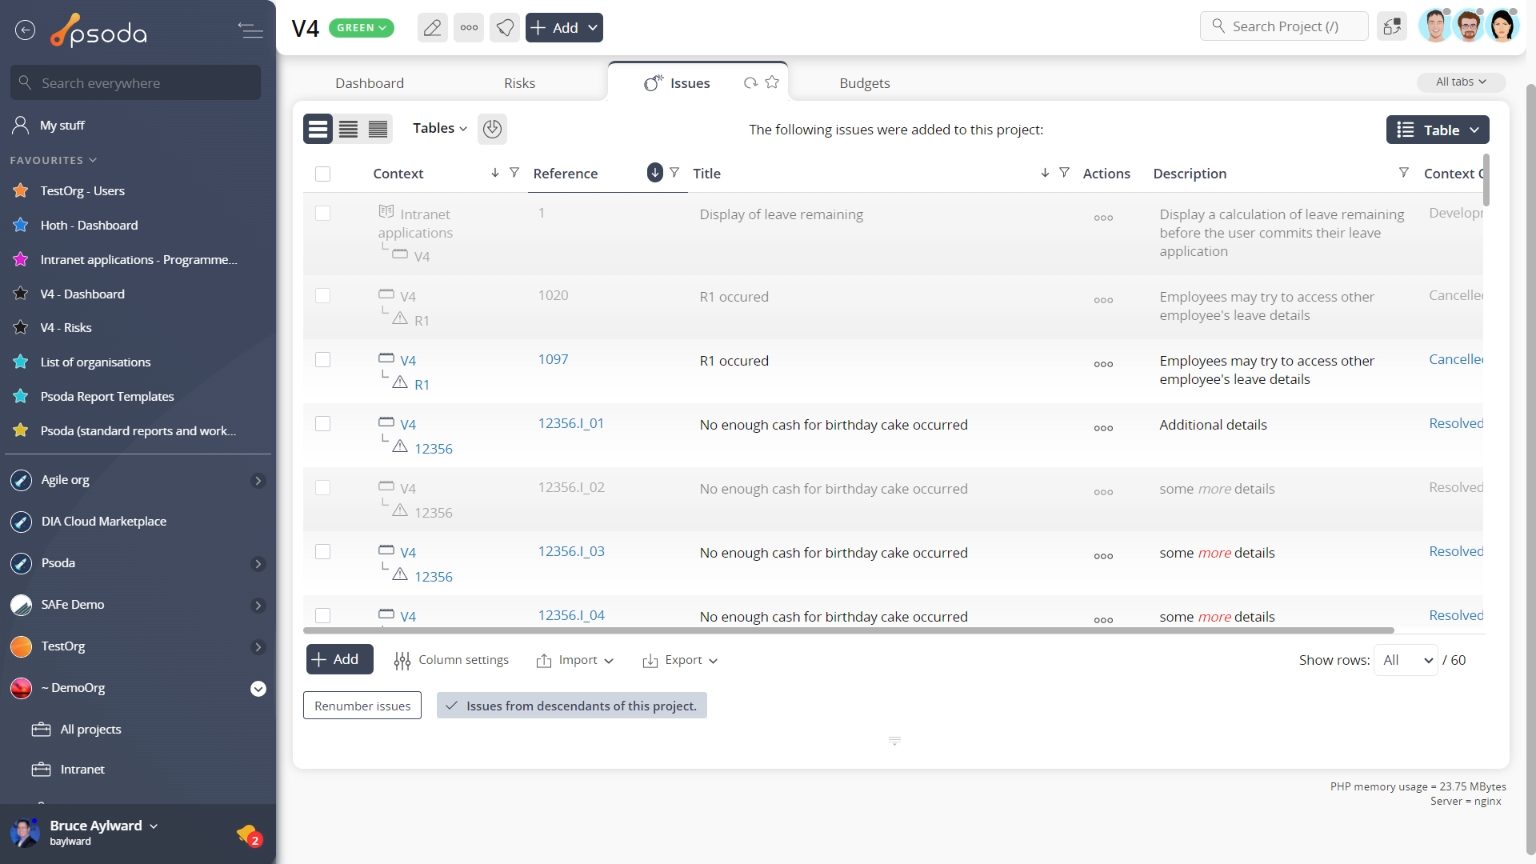
Figure 28 – Project issues tab
Note that at the bottom of the table you canIssues overview
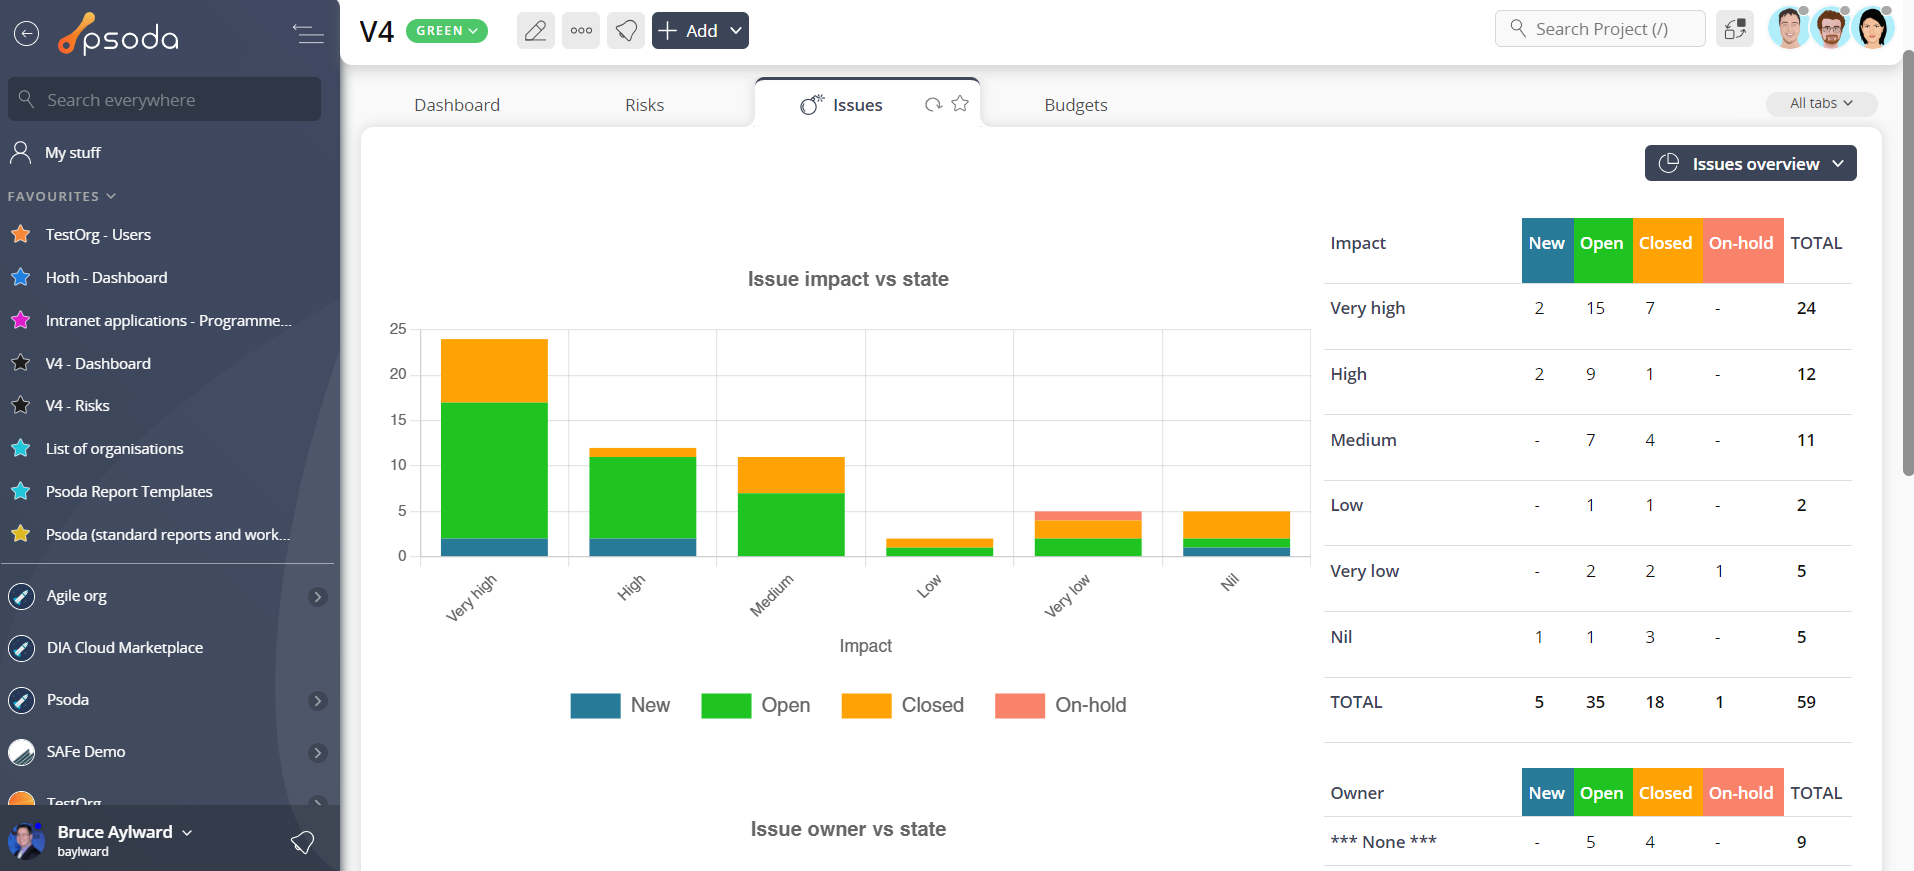
Figure 29 – Project issues overview
Instead of a table view, this tab provides a graphical view of your issues by presenting a number of graphs grouping issues by certain categories, as shown in Figure 29. The issues overview charts are generated by information in the issues tab at this and lower asset levels.
Lessons
This tabbed view shows the issues table as seen in Figure 31, listing any lessons that have been added for this project. By default, this table provides a link into a selected lesson itself, as well as providing other information such as the lesson title, description and context. The workflow column also provides information as to the next workflow transitions available, if a workflow has been selected upon lesson creation.
The Actions column of the lessons table provides accessible functions to act on a chosen issue. These functions include 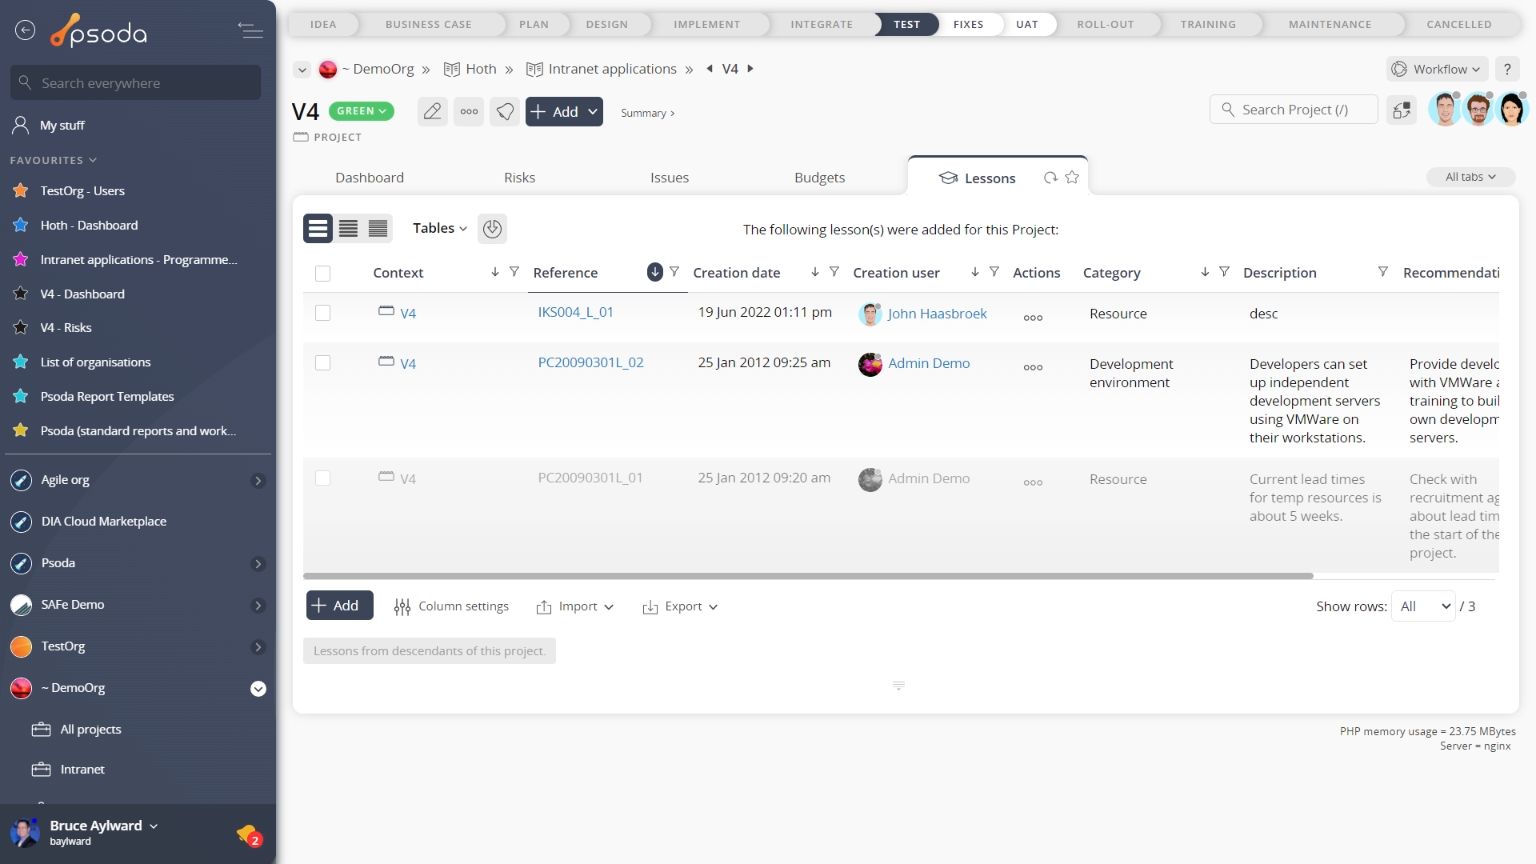 Figure 31 – Project lessons tab
 Materials
This tab shows an asset listing of all of the materials needed for this project, as shown in Figure 32. By default, this table will present you with a number of details about the materials such as, the description, quantity needed, unit price, total price, the vendor as well as if the material has been ordered or delivered. Materials that are due to be ordered or delivered are flagged in red under the order by and needed by columns. You can sort the table by clicking on the column headings and if you click on the link below the material column you will navigate into the selected material’s view page.
From the Actions column of this materials table, you can act on individual materials by 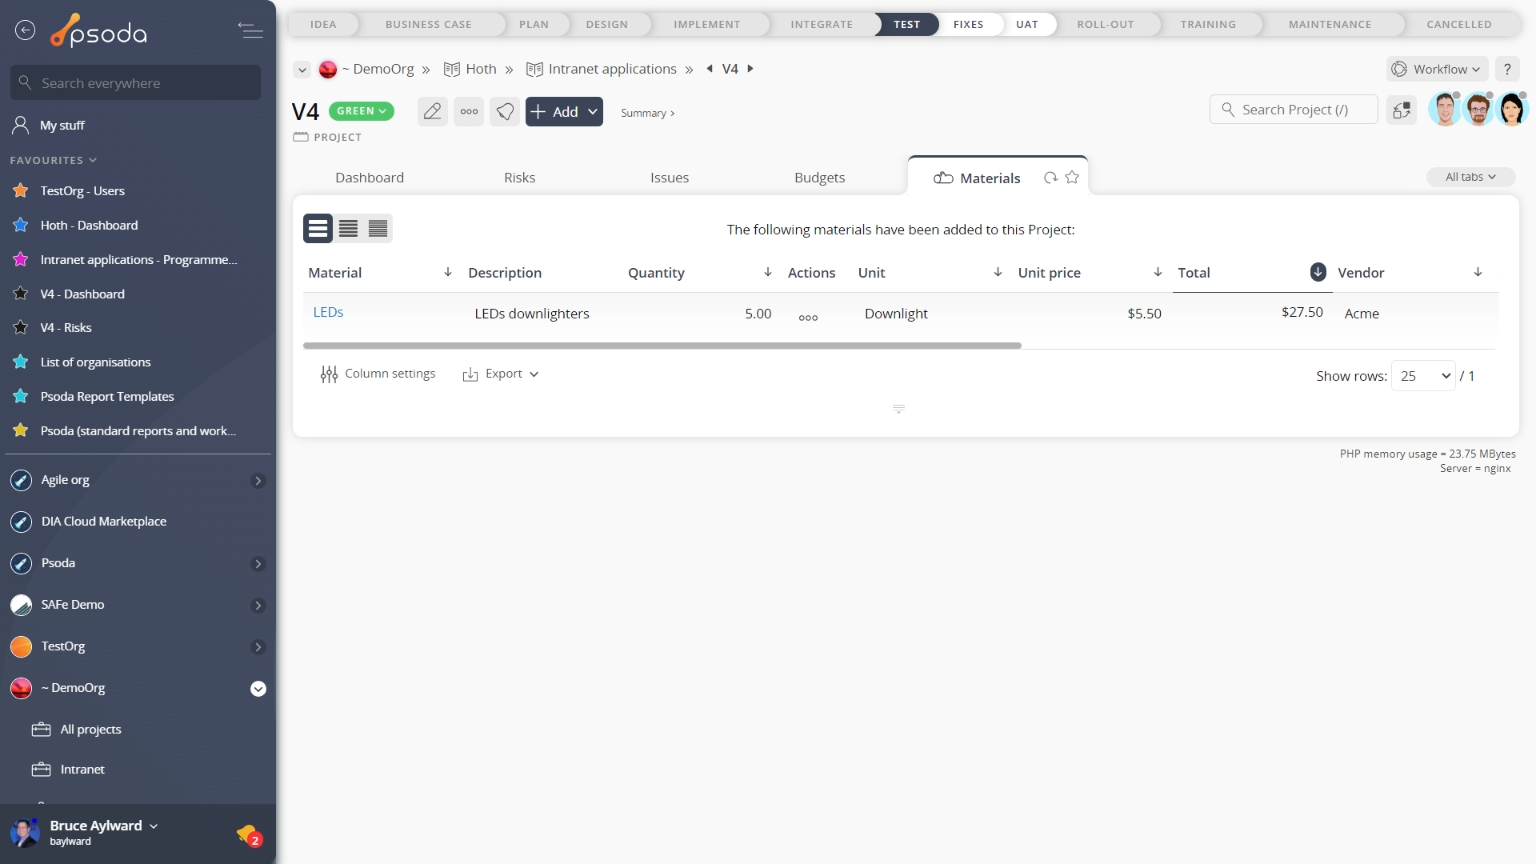
Figure 32 – Project materials tab
Note that you can customise your table view by clicking the Meetings
This tab shows an asset listing of all of the meetings that have been added to this project, as shown in Figure 33. By default, this table will present you with a number of details about the meetings such as the date and time, duration, meeting’s subject, users who are required to attend, as well as users who have been selected for optional attendance or resources description, the meeting’s agenda, minutes and current state. If you click on the link beneath the date and time column, you will navigate into the selected meeting’s view page.
From the Actions column of this materials table, you can act on individual materials by 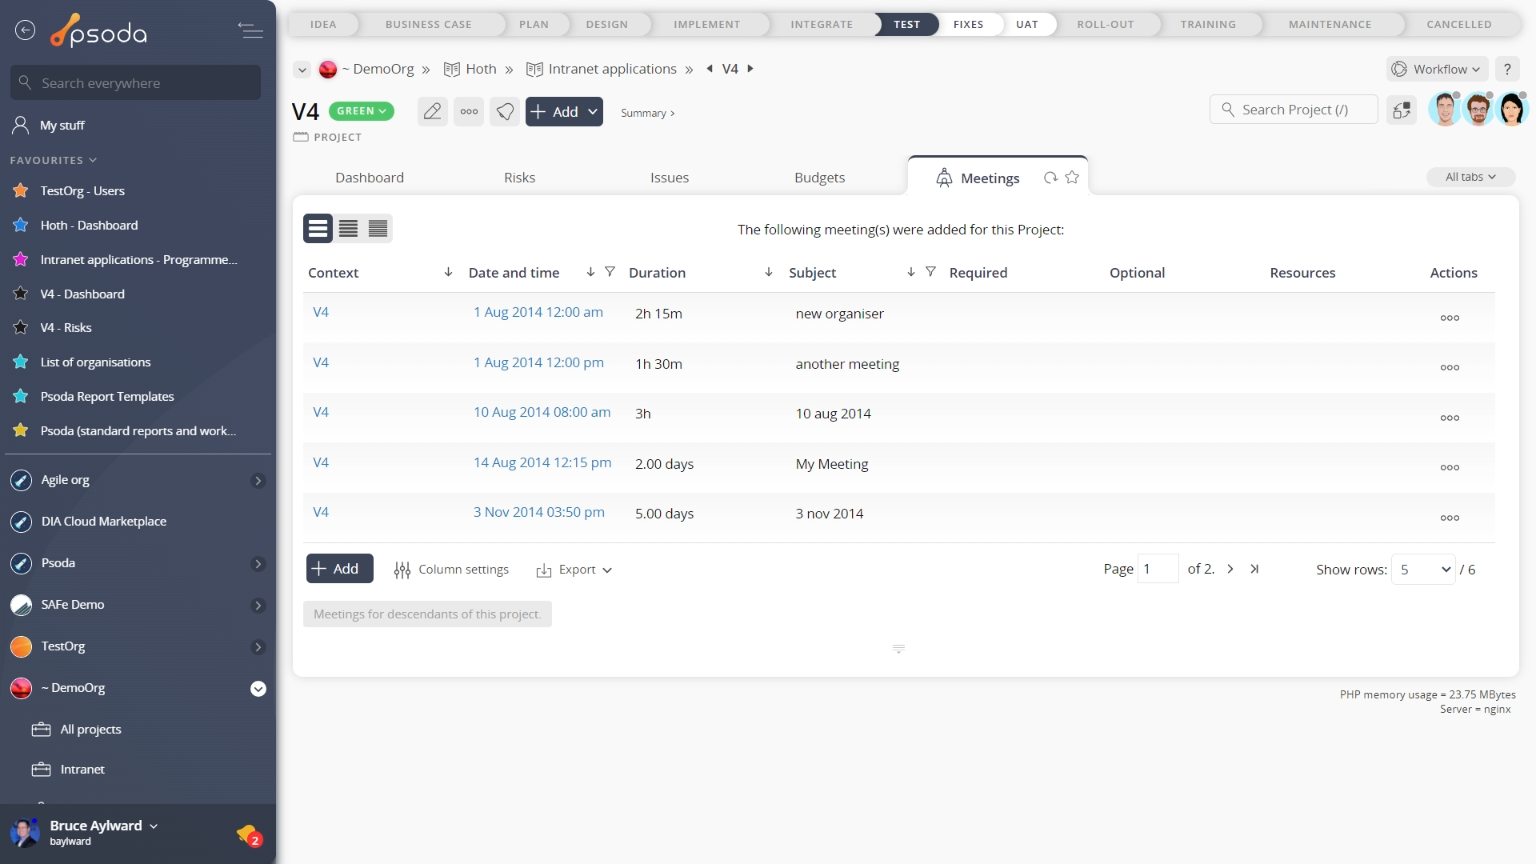
Figure 33 – Project meetings tab
Note that you can customise your table view by clicking the ![]() edit button at the bottom of the table, where you will also be presented with the option to
edit button at the bottom of the table, where you will also be presented with the option to ![]() add more meetings to this project. Here, you can also export this list to
add more meetings to this project. Here, you can also export this list to ![]() Excel or
Excel or ![]() CSV files.
CSV files.
At the very bottom of this tab you have the option to increase/decrease the number of meetings listed by selecting the include/hide meetings for children of this project link.
 Release management forms
This tab shows an asset listing of all of the release management forms that have been added to this project, as shown in Figure 34. By default this requirements table will list some details for the release management forms such as the title, description, users who agreed with this release management form, the user that created it and it’s current state. If you click on the link in the release management form column, you will navigate into the selected release management form’s view page.
From the Actions column of this release management forms table, you can act on individual release management forms by 
Figure 34 – Project release management forms tab
Note that you can customise your table view by clicking the ![]() edit button at the bottom of the table, where you will also be presented with the option to
edit button at the bottom of the table, where you will also be presented with the option to ![]() add more release management forms to this project. Here, you can also export this list to
add more release management forms to this project. Here, you can also export this list to ![]() Excel or
Excel or ![]() CSV files.
CSV files.
At the very bottom of this tab you have the option to increase/decrease the number of release management forms listed by selecting the include/hide release management forms from sub-programmes/projects link.
 Reports
This tabbed view shows a listing of the reports as seen in Figure 35, listing any reports available for this project.
Figure 35 shows a portion of this alphabetical listing, and your specific list may vary slightly depending on if your System Administrator has created any new report templates that have been customised to be available to your organisation only.
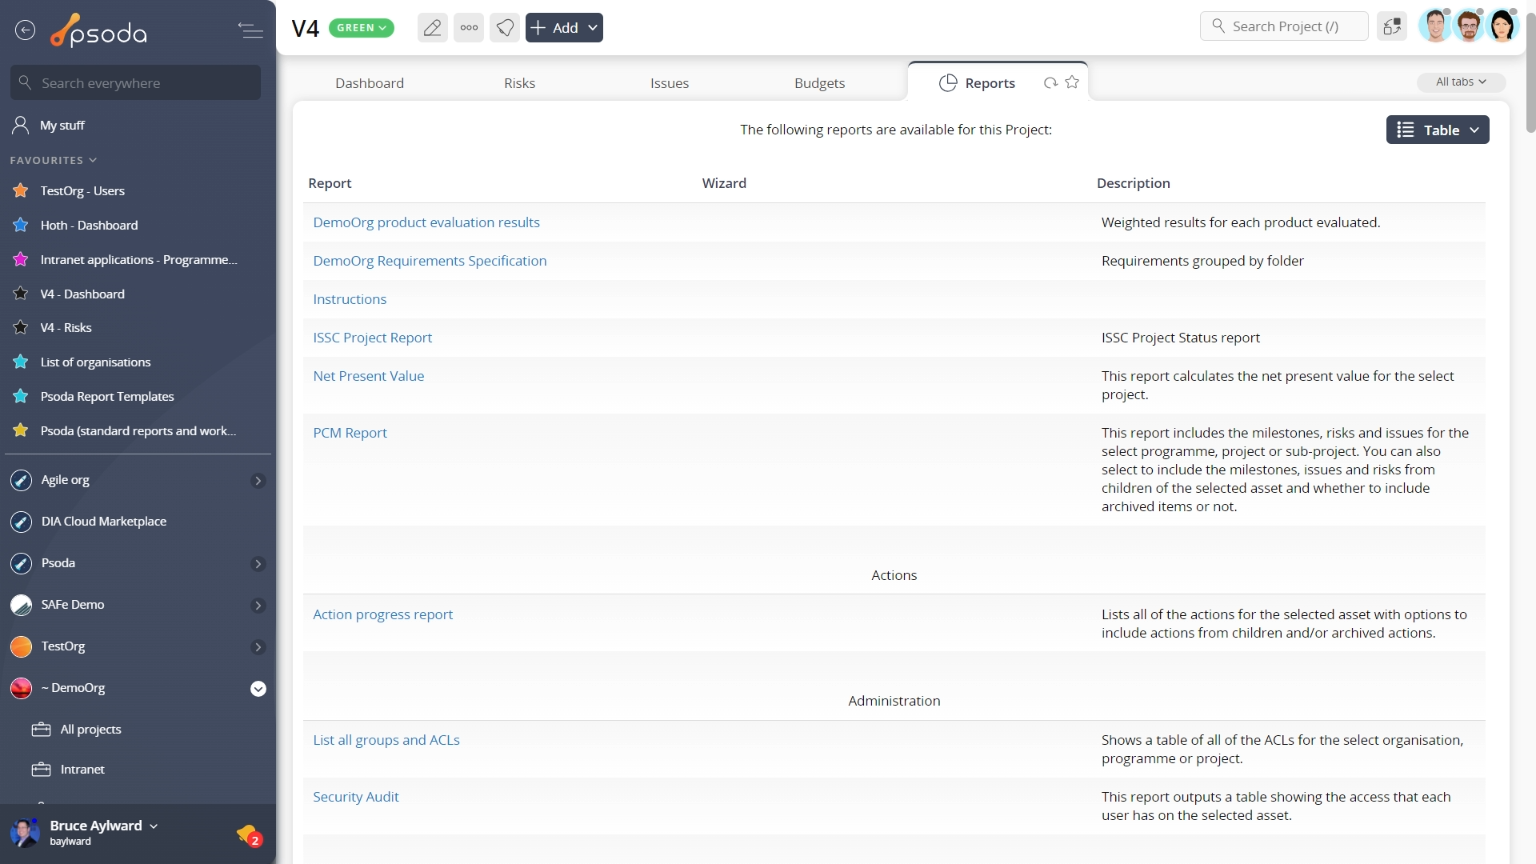
Figure 35 – Project report tab
This listing is unable to be customised, but provides the name of the report and a more detailed description of what information this report is built for and how the report is grouped.
Once you click on a report’s name, the run report form will popup. These popup forms vary depending on the report being run.
Requirements
This tab shows an asset listing of all of the requirements on this project, as shown in Figure 36. By default this requirements table will list some details for the requirements such as the reference, category, description, priority, weighting and current state. If you click on the link in the reference column, you will navigate into the selected requirement’s view page.
From the Actions column of this requirements table, you can act on individual requirements by 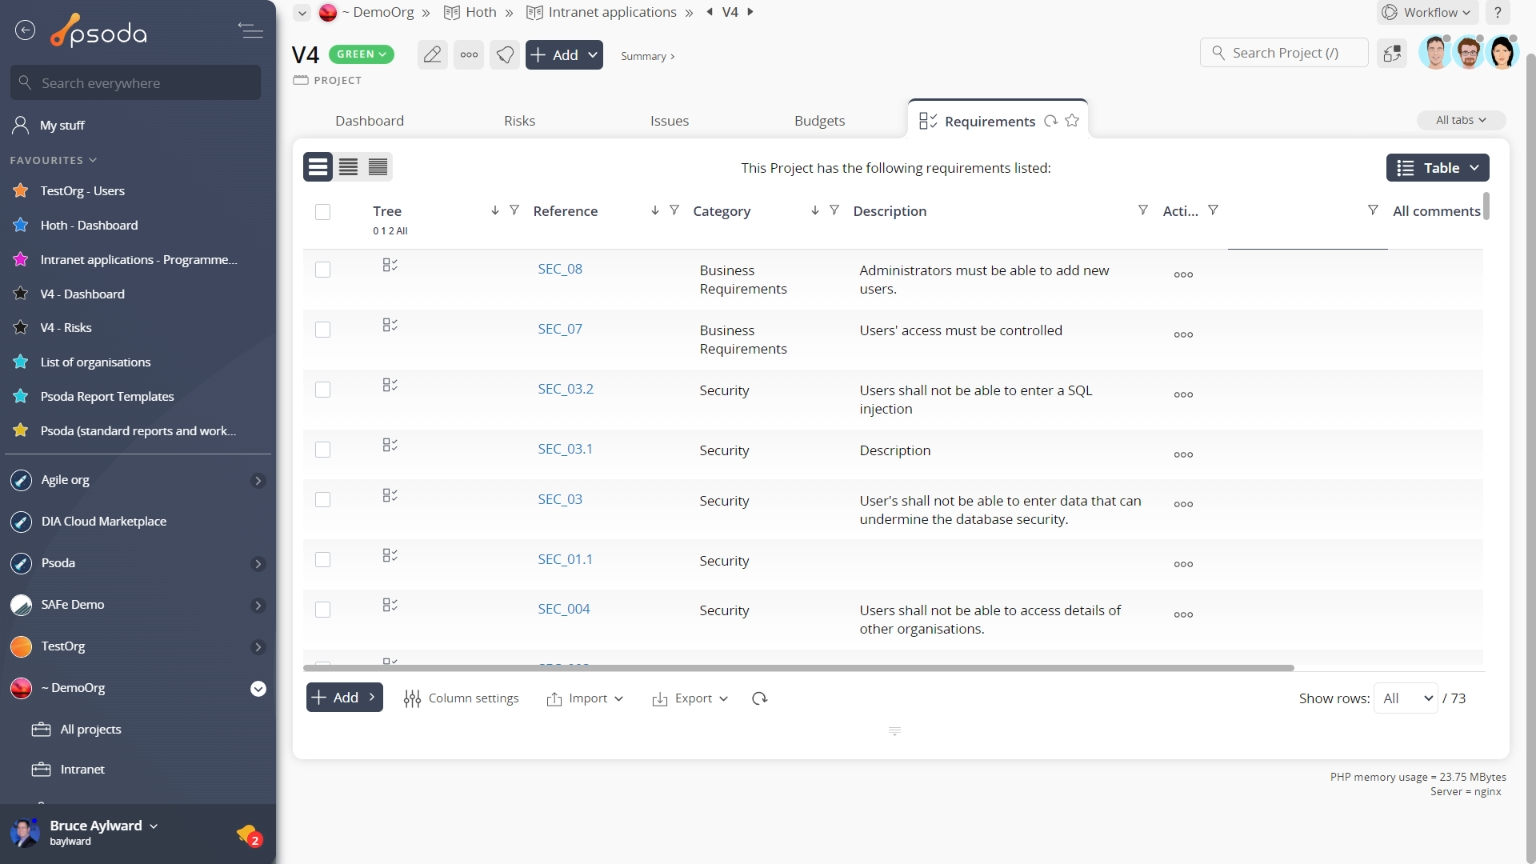
Figure 36 – Project requirements tab
Note that you can customise your table view by clicking the Risks
Risks
This tabbed view shows the risks table as seen in Figure 37, listing any risks that have been logged for this project. By default, you will be shown the risk’s context, reference, title, description, proximity, any workflow transitions that may be available and other details also captured in the screenshot below.
The Actions column of this table provides accessible functions to act on a chosen role. These functions include 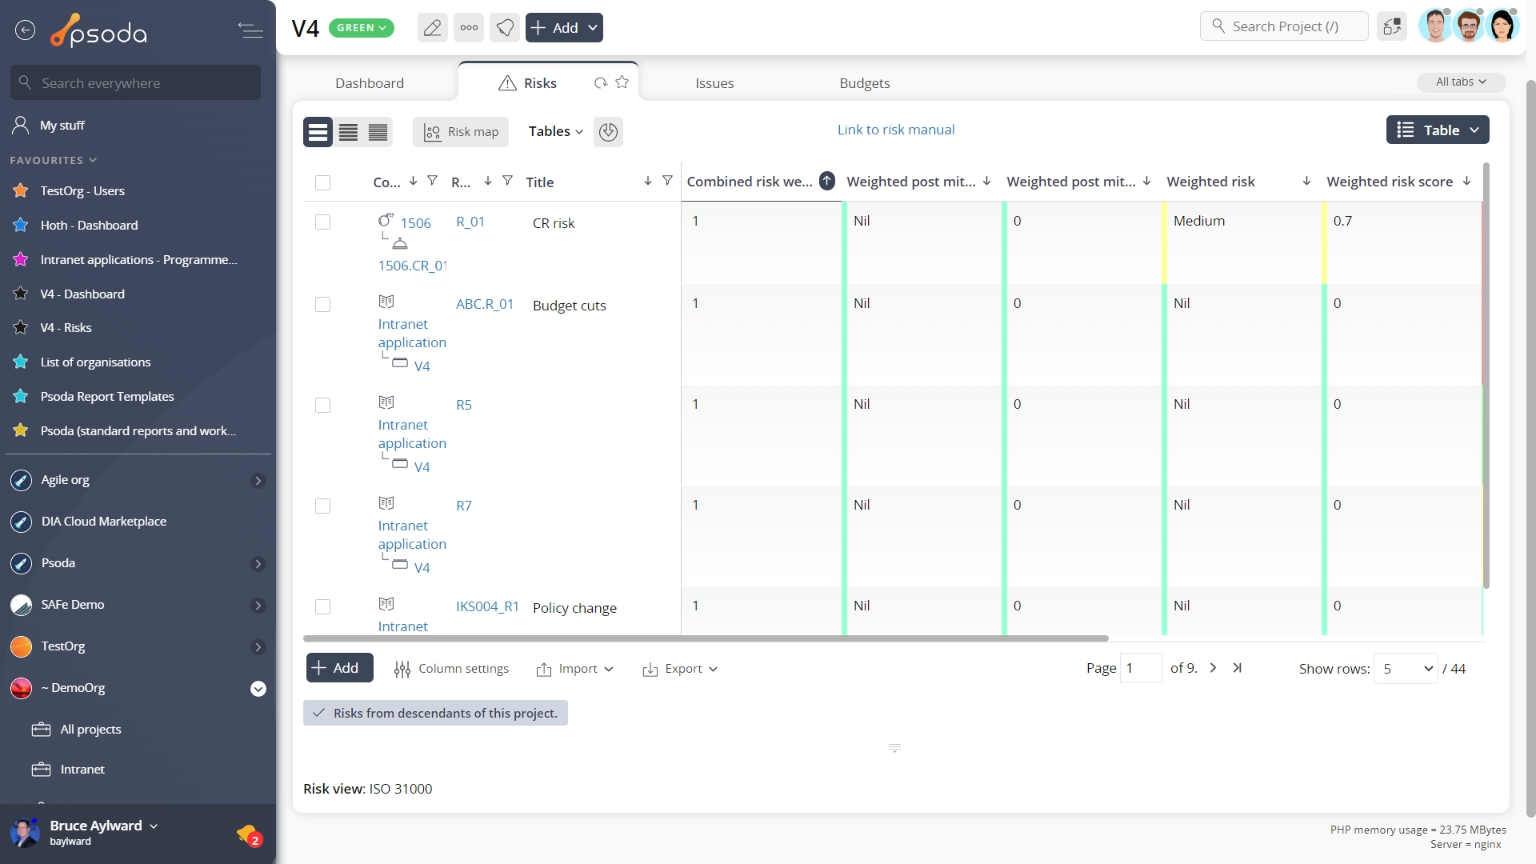
Figure 37 – Project risk table
Note that at the bottom of this table you can Roles
Roles
This tabbed view shows the roles table as seen in Figure 39, listing any roles that have been defined for this project. By default, you will be shown the role’s name, description and editable daily and hourly rates for members of this role, along with a list of users who are members of this role.
The Actions column of this table provides accessible functions to act on a chosen role. These functions include 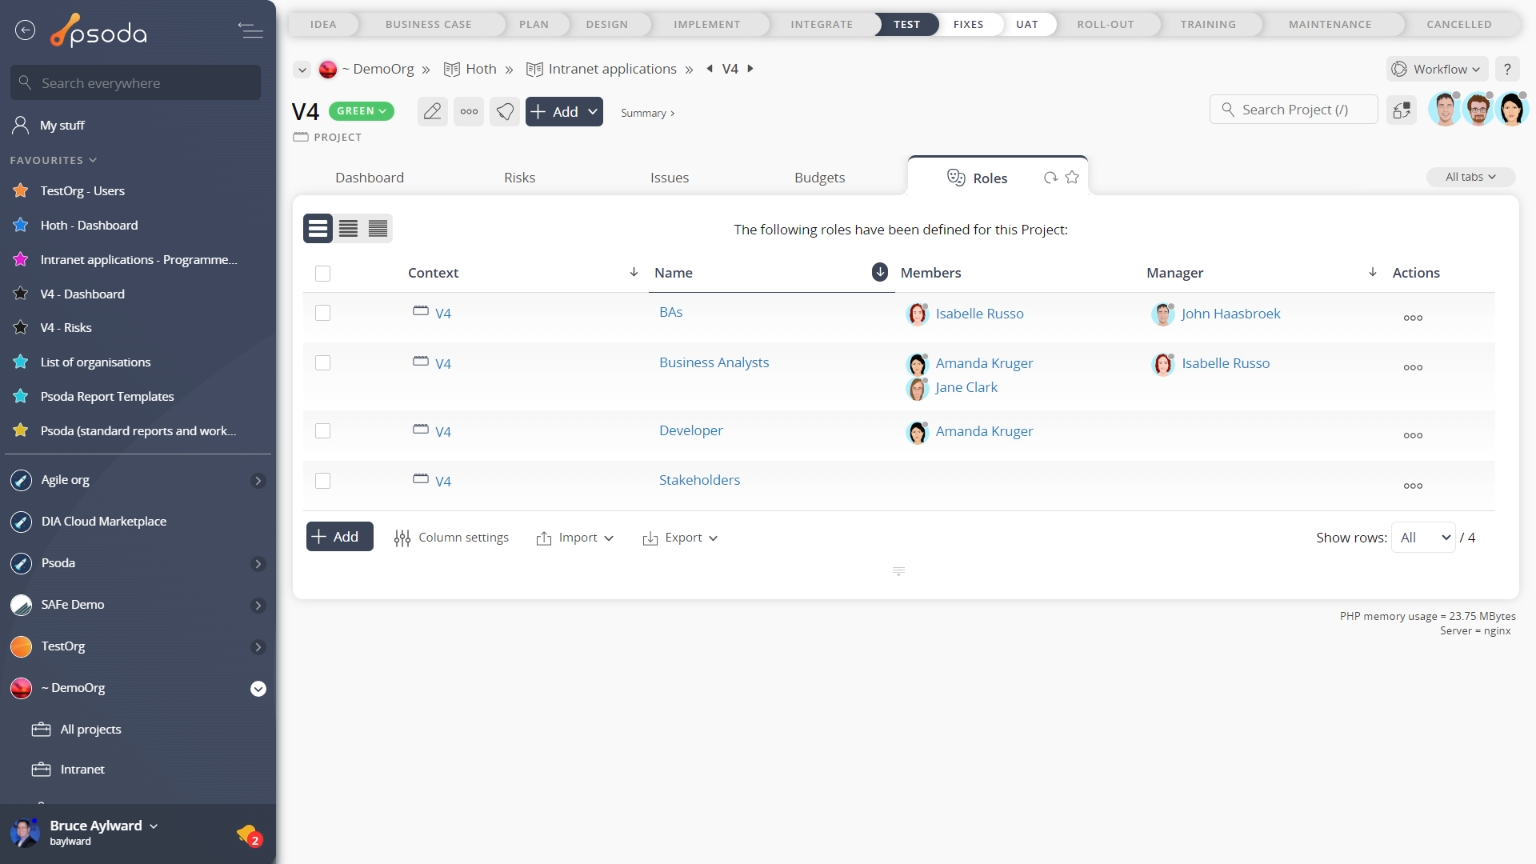
Figure 39 – Project roles table
Note that at the bottom of this table you can ![]() add another role to this project,
add another role to this project, ![]() edit the table columns to show or hide role information, or export this role list to
edit the table columns to show or hide role information, or export this role list to ![]() Excel or
Excel or ![]() CSV files.
CSV files.
Sub-projects
This tab shows an asset listing of all of the sub-projects that have been defined for this project, as shown in Figure 41. By default, this table will be ordered by RAG status and present you with a number of details about the sub-projects such as the RAG status and change, estimate information, open assets within the listed sub-project and it’s current state. If you click on the link below the name column you will navigate into the selected sub-project’s view page.
From the Actions column of this sub-projects table, you can act on individual sub-projects by ![]() editing,
editing, ![]() deleting,
deleting, ![]() copying or
copying or ![]() moving the selected sub-project, or
moving the selected sub-project, or ![]() adding another sub-project to the chosen sub-project.
adding another sub-project to the chosen sub-project.
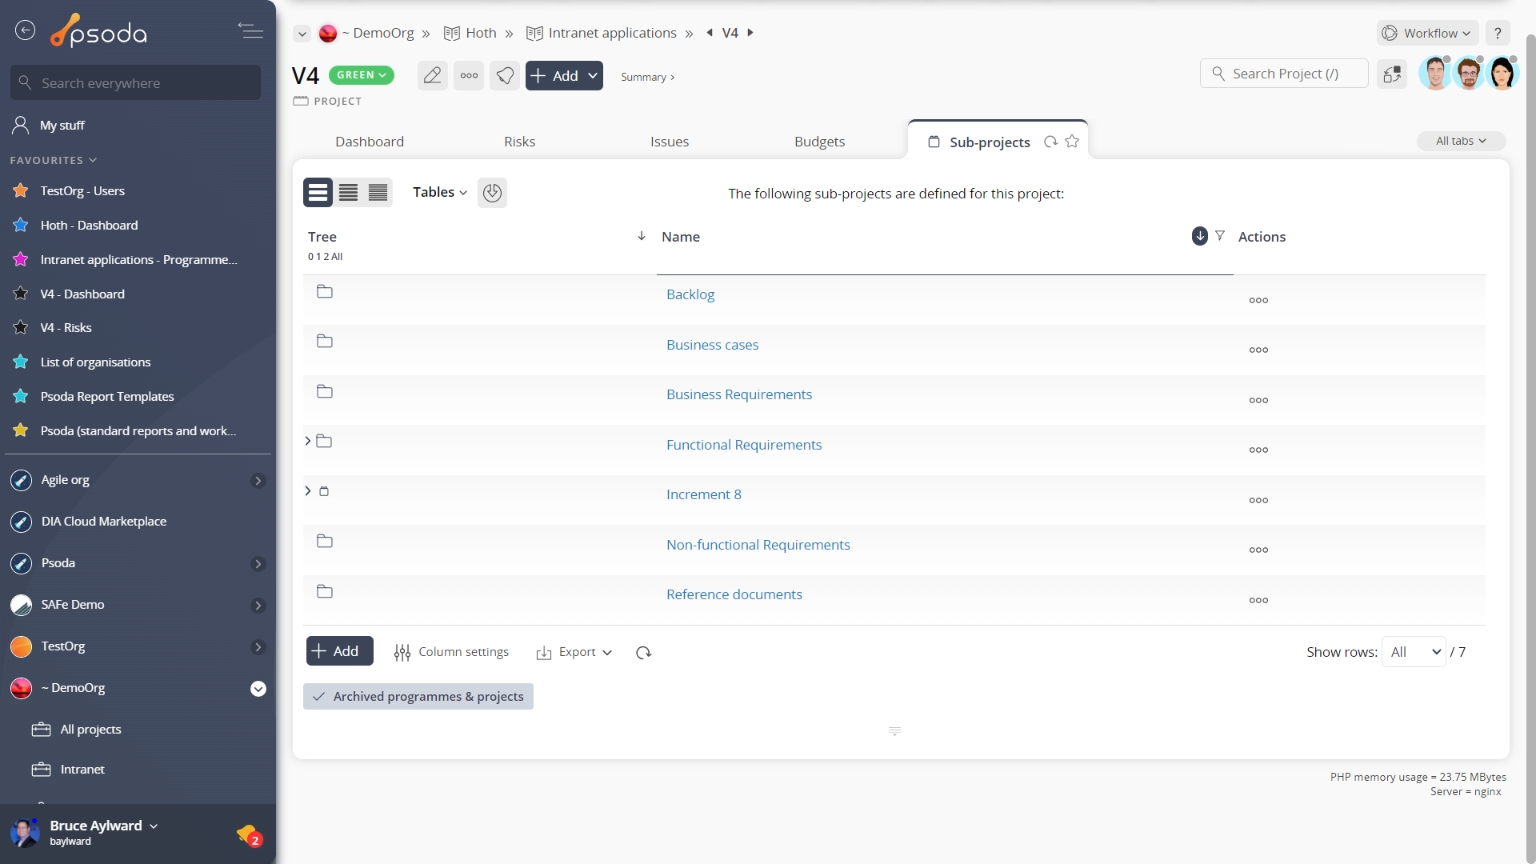
Figure 41 – Project sub-projects tab
Note that you can customise your table view by clicking the Schedule
This tabbed view shows the tasks and milestones table as seen in Figure 42, listing any 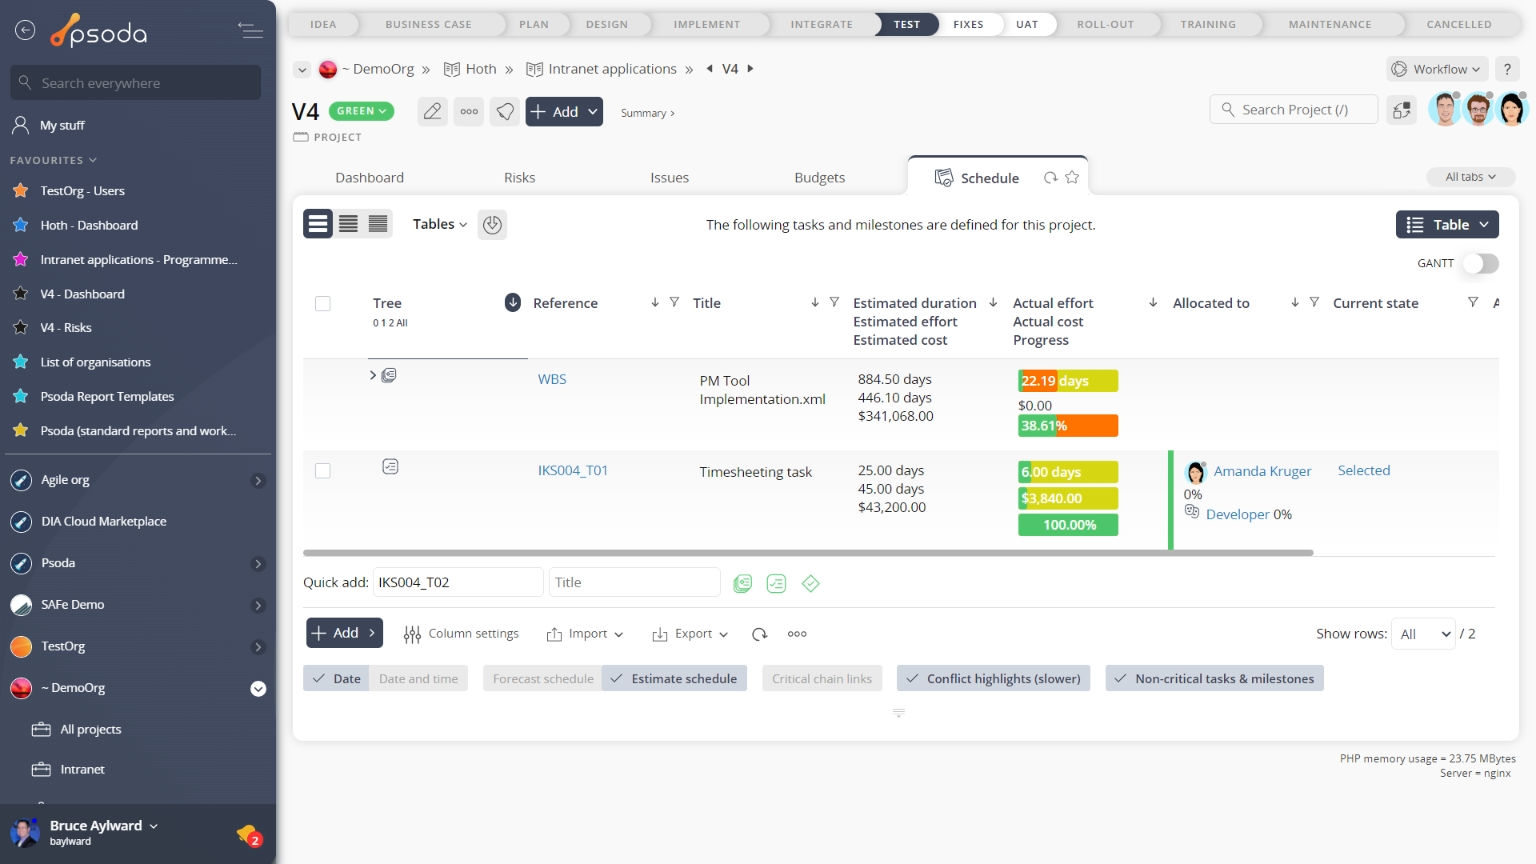
Figure 42 – Project tasks and milestones table
Note that at the bottom of this table you can add another ![]() task group,
task group, ![]() task or
task or ![]() milestone,
milestone,![]() edit the table columns to show or hide asset information, or export this information to
edit the table columns to show or hide asset information, or export this information to ![]() Excel or
Excel or ![]() CSV files.
CSV files.
At the very bottom of this tabbed view you are presented with a number of table information formatting options which will increase/decrease the information you’re presented with, as well as other options to import task group/WBS information, view the information in a GANTT format or run a recalculation.
From this other options subsection at the bottom of this tabbed view, you may also have access to ![]() mass approve,
mass approve, ![]() mass complete or mass archive tasks.
mass complete or mass archive tasks.
 Test case overview
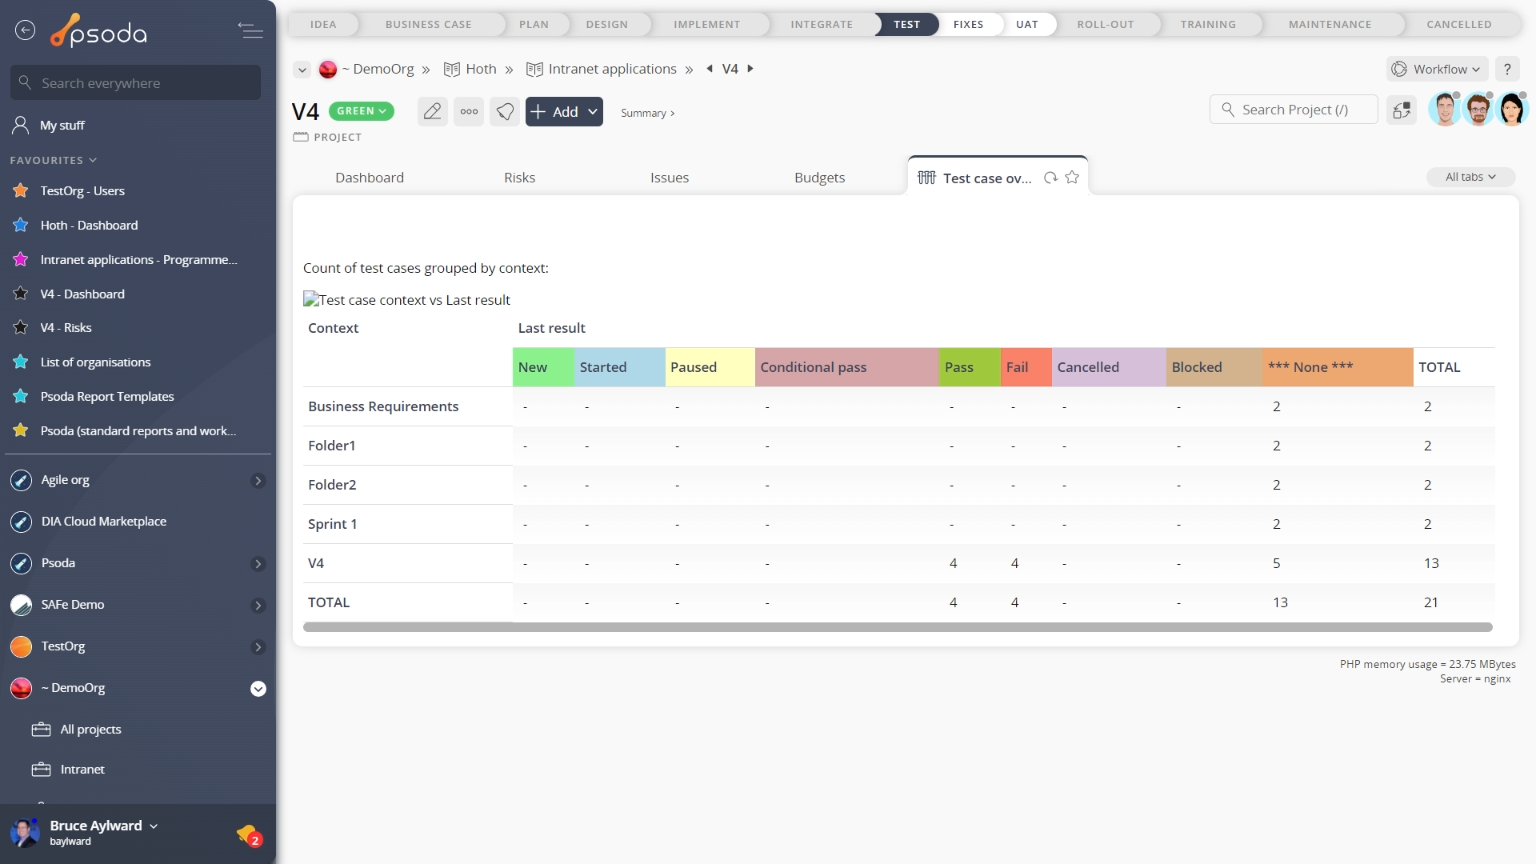
Figure 43 – Project test case overview
Instead of a table view, this tab provides a graphical view of your test cases by presenting a number of graphs grouping test cases by certain categories, as shown in Figure 43. The test cases overview charts are generated by information in the test cases tab at lower asset levels.
Test cases
This tab shows an asset listing of all of the test cases that have been listed for this project, as shown in Figure 44. If you click on the link in the reference column, you will navigate into the selected test case’s view page. By default this test cases table will show some details of the listed test cases such as the reference, title, pre-conditions, description, requirement being tested, current state and the last result.
From the Actions column of this test cases table, you can act on individual test cases by 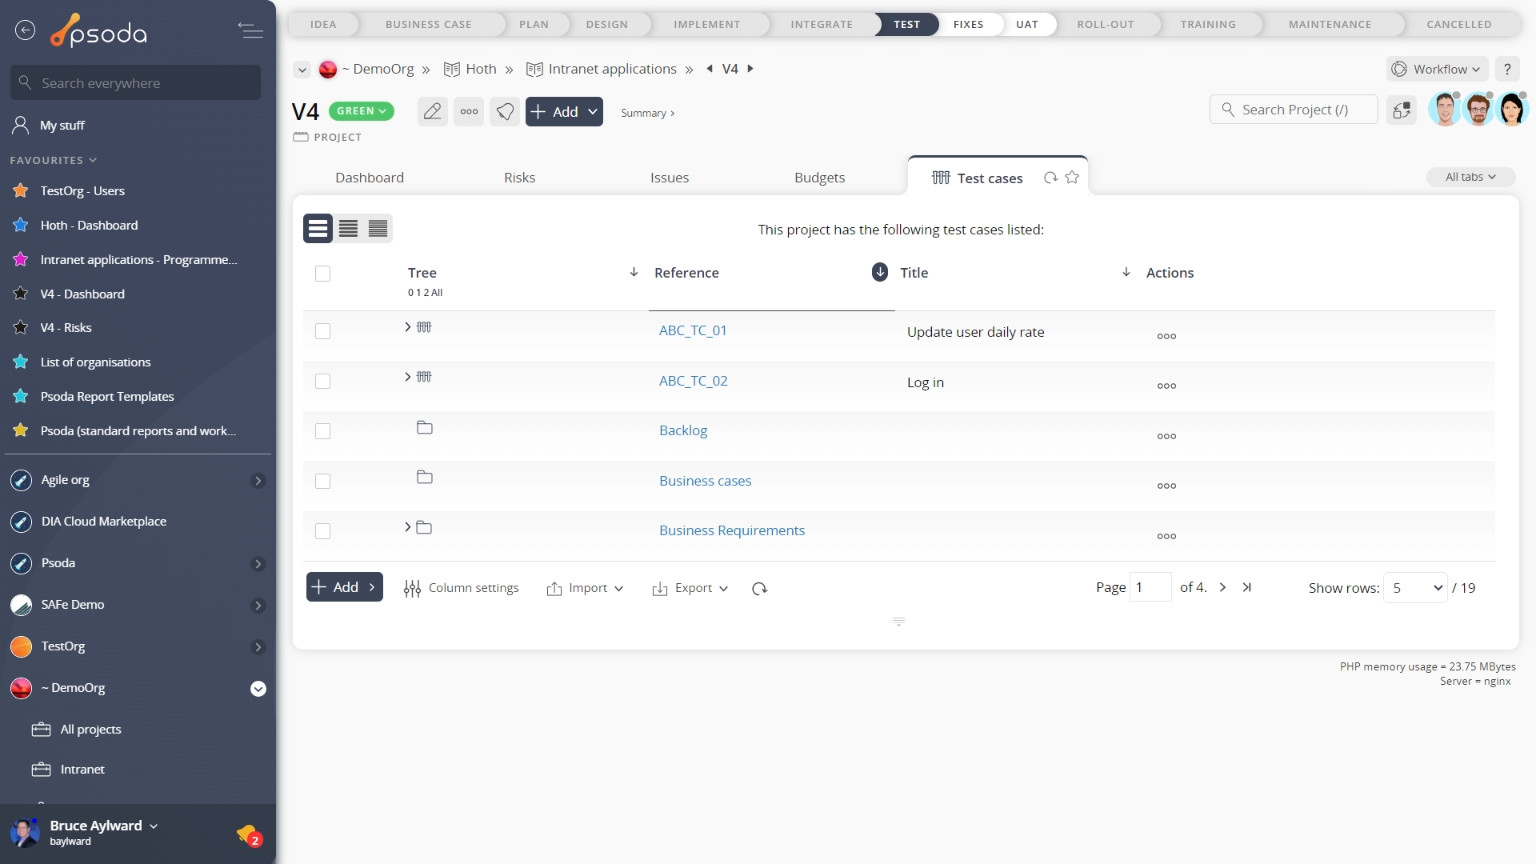
Figure 44 – Project test cases tab
At the bottom of the table you can add more ![]() sub-folders or
sub-folders or ![]() test cases manually or
test cases manually or ![]() import multiple from a CSV file. Note that you can customise your table view by clicking the
import multiple from a CSV file. Note that you can customise your table view by clicking the ![]() edit button from here too, as well as being able to export this list to
edit button from here too, as well as being able to export this list to ![]() Excel or
Excel or ![]() CSV files.
CSV files.
 Test runs
This tab shows an asset listing of all of the test runs that have been listed for this project, as shown in Figure 45. If you click on the link in the short name column, you will navigate into the selected test run’s view page. By default this test runs table will show some details of the listed test runs such as the short name, description, progress, passrate, context and status to name a few.
From the Actions column of this test runs table, you can act on individual test runs by 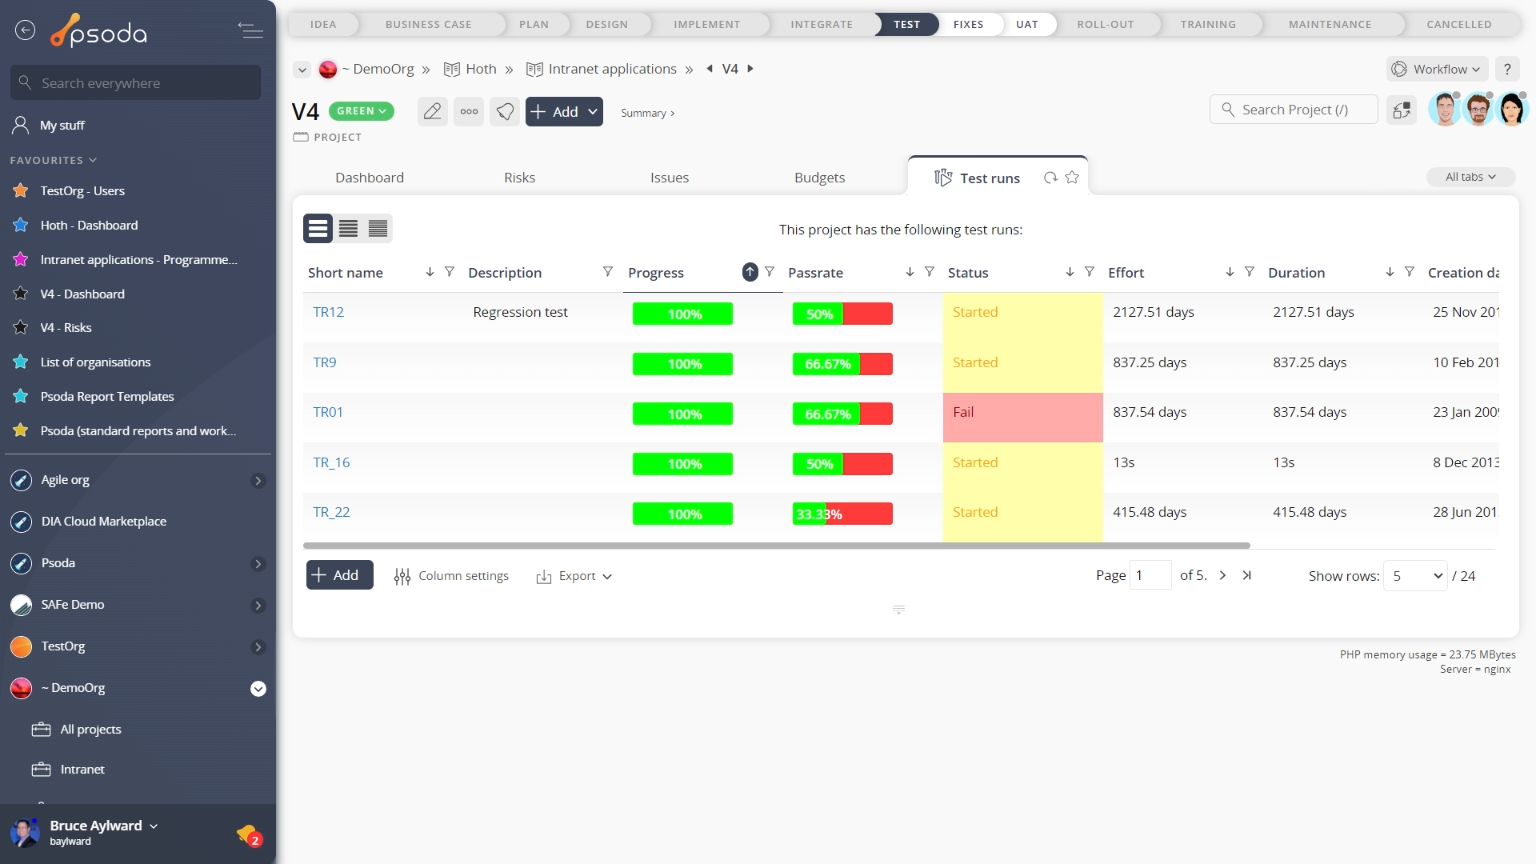
Figure 45 – Project test runs tab
From the bottom of the table you can ![]() add more test runs and customise your table view by clicking the
add more test runs and customise your table view by clicking the ![]() edit button. From here you may also be able to export this list to
edit button. From here you may also be able to export this list to ![]() Excel or
Excel or ![]() CSV files.
CSV files.
Traceability matrix
This tab shows the traceability matrix for this project, as shown in Figure 47. The traceability matrix tool is used to visualise the relationships between requirements and requirements, requirements and test cases and other project entities. It can also be used to add new relationships or to toggle the relationship flags.
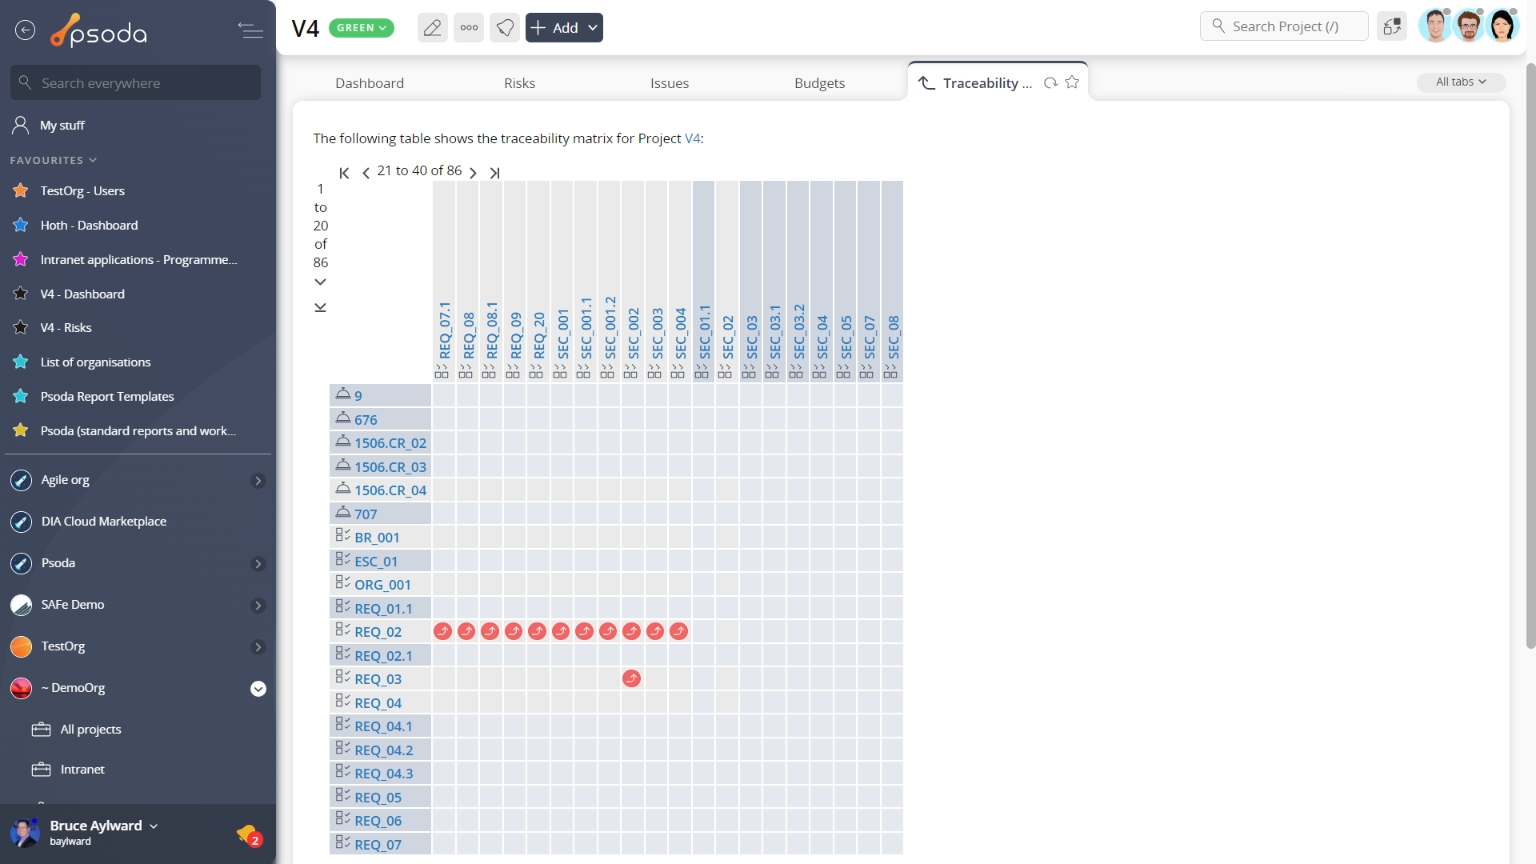
Figure 47 – Project traceability matrix tab
Below the matrix itself, you can edit which assets you want to include on the horizontal and vertical axes by selecting or de-selecting the associated check boxes and selecting the Update matrix button. Whiteboards
This tab shows an asset listing of all of the whiteboards that have been added to this project, as shown in Figure 48. By default, this table will present you with a number of details about the whiteboards such as it’s context, title, description, type, the user who created this whiteboard and it’s current state. If you click on the link beneath the whiteboard column, you will navigate to the selected whiteboard’s view page.
From the Actions column of this whiteboards table, you can act on individual whiteboard by 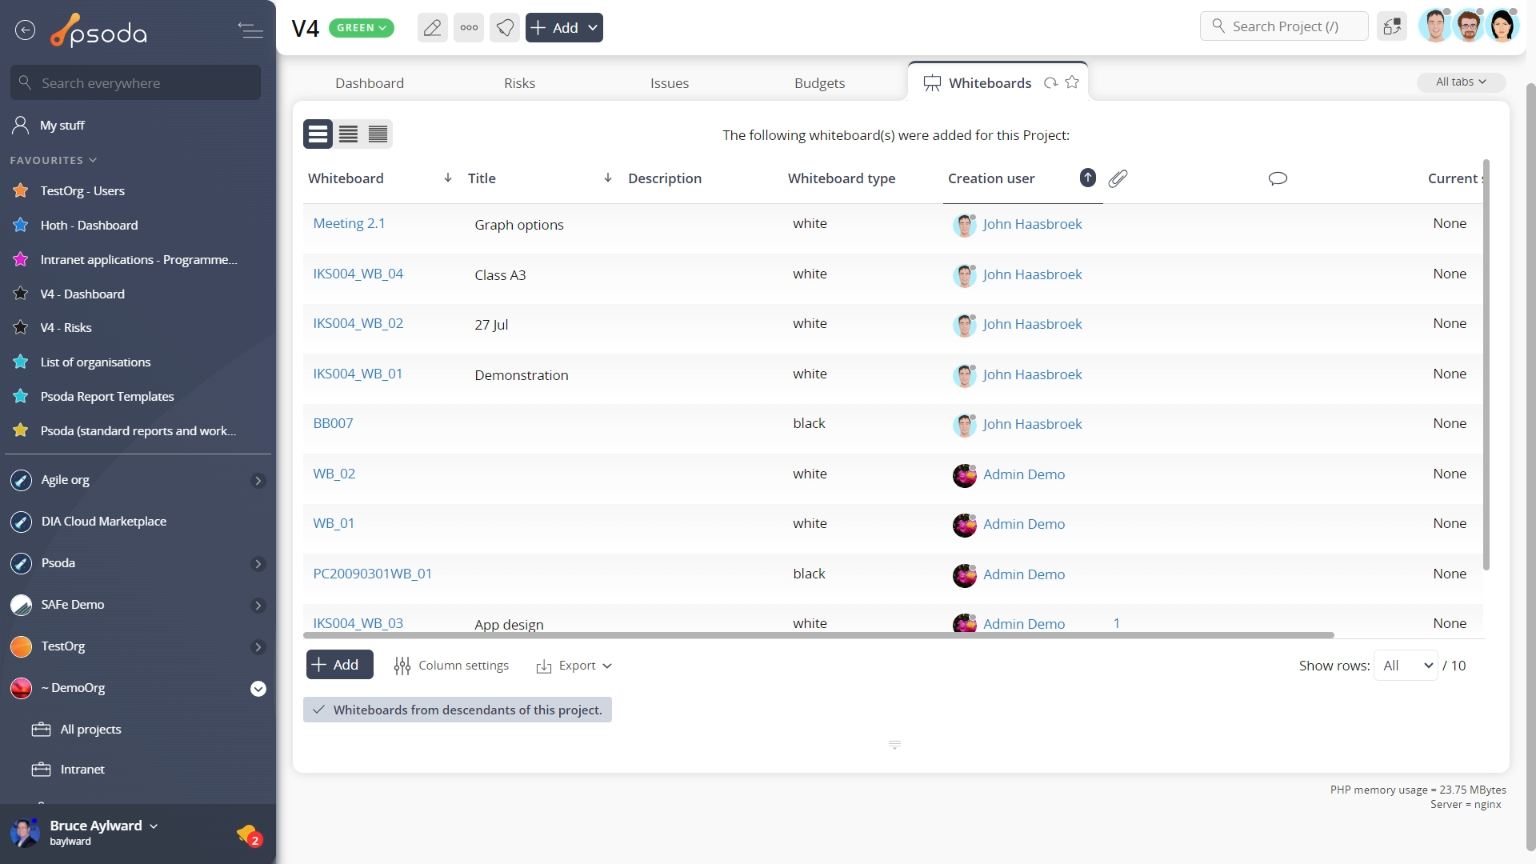
Figure 48 – Project whiteboards tab
Note that you can customise your table view by clicking the Workflow Timeline
This tab shows you a table containing each of the state transitions that have been applied to this project on the applied workflow. Note that you can customise your table view by clicking the 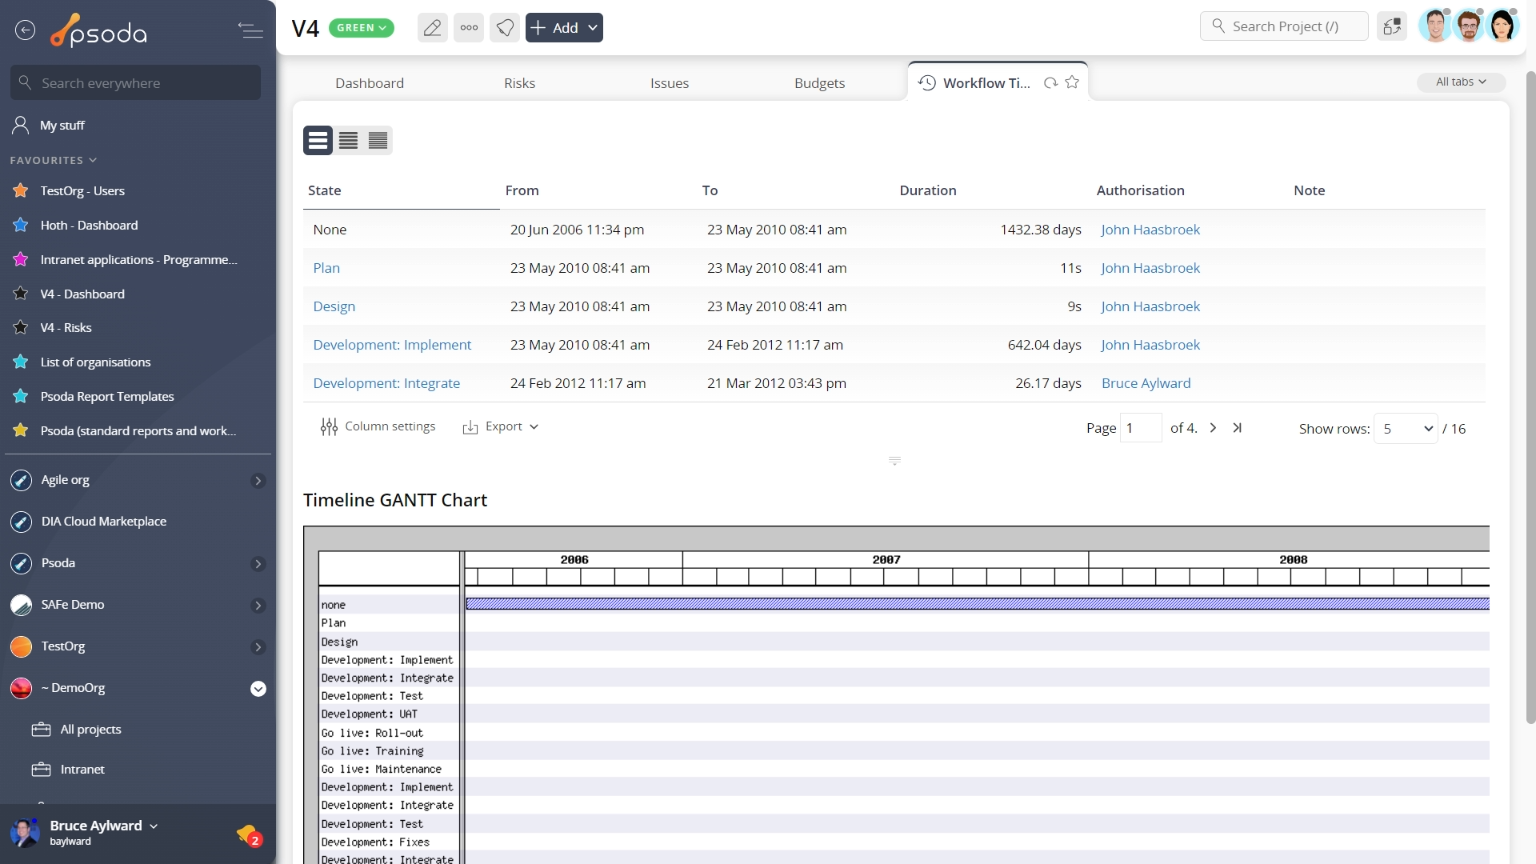 Figure 49 – Project workflow timeline tab
Below the state transition timeline table, you will be presented with a visual breakdown of the timeline in a GANTT chart, as shown in Figure 49.
 Workload
Instead of a table view, this tab provides a graphical view of the workload for the roles and individuals on your project
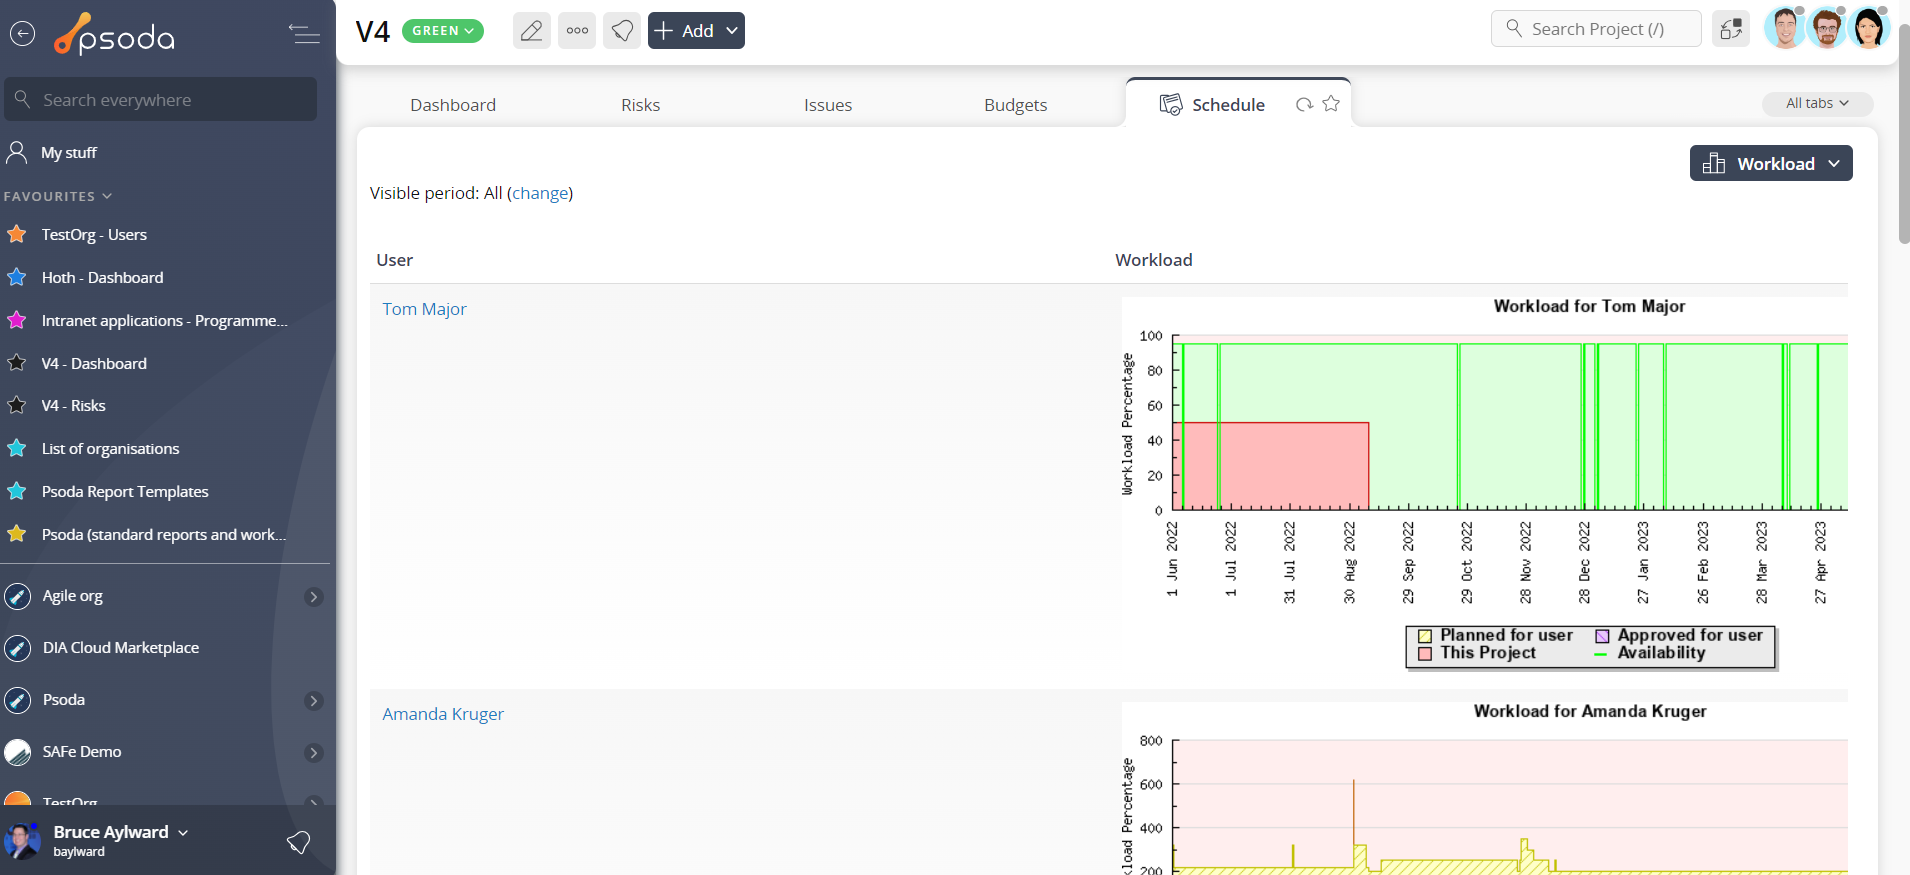
Figure 50 – Project workload tab
The chart shown in Figure 50 is generated from the information in the Tasks tab.
Map
This tab provides a map which can be drawn on. There are four different drawing types: marker, shape, line and rectangle as seen in the bottom left of the map, and also a delete button which is used to delete any shapes added to this project. The map will show shapes from any child programmes, projects, or sub-projects. There is also a date range slider a the bottom of the map which will hide any projects outside of that range (based on the project start and end date). The most common use case of the map tab is to map out the locations of different programmes, projects, and sub-projects, and see how they evolve over time using the date range slider.
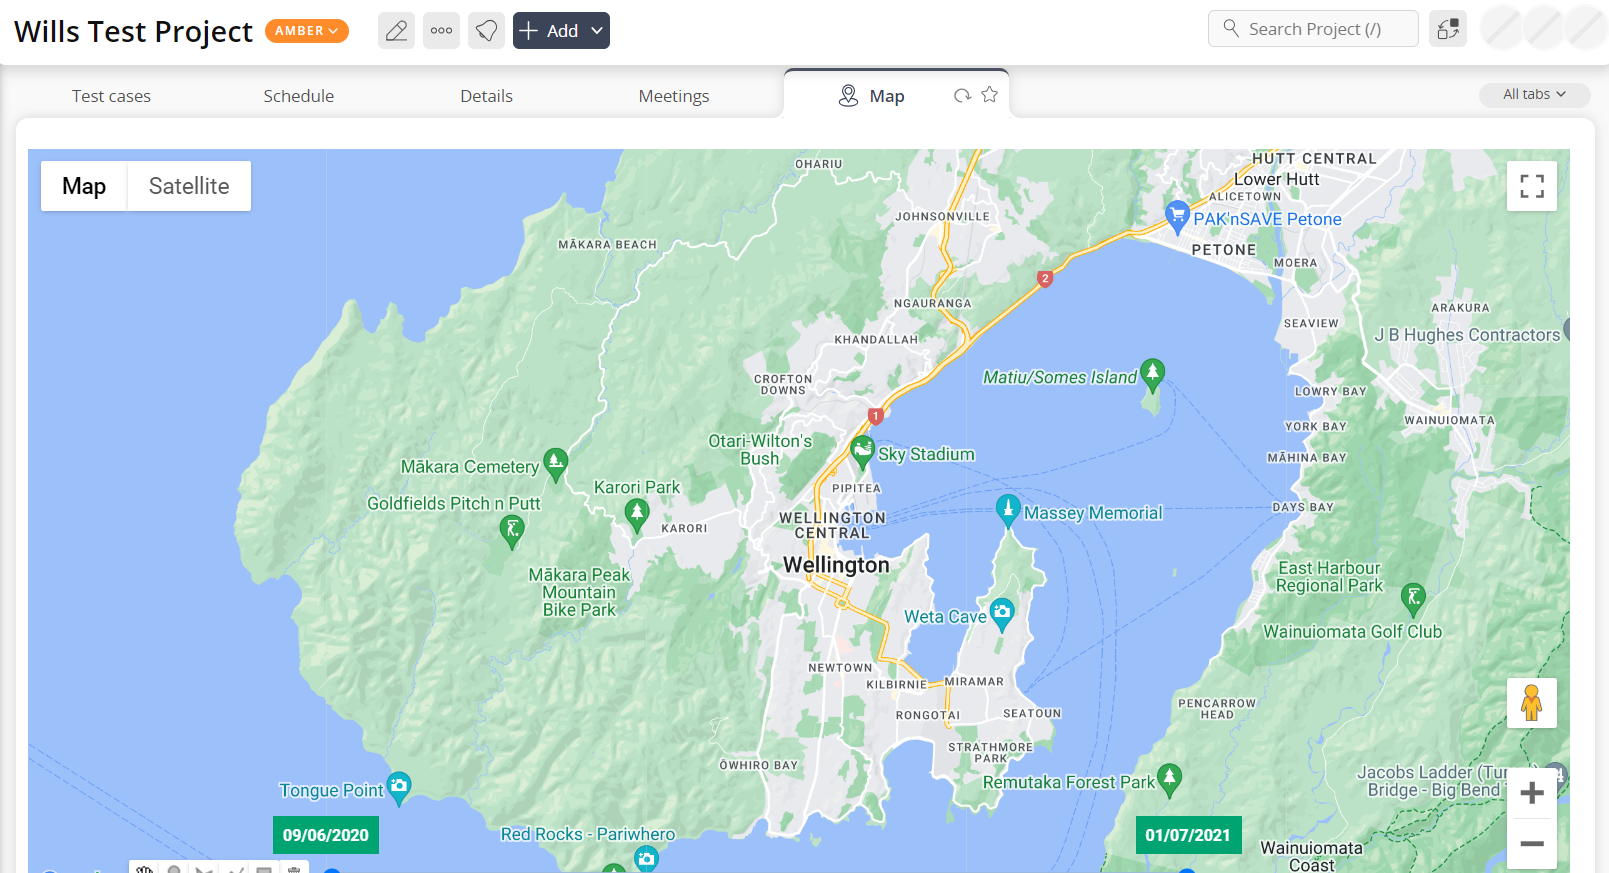
Figure 51 – Project map tab